
Journal of Resources and Ecology >
Evaluation of Inner Mongolia Wind Erosion Prevention Service based on Land Use and the RWEQ Model
|
WANG Yangyang, E-mail: wangyy.18b@igsnrr.ac.cn |
Received date: 2021-11-01
Accepted date: 2022-04-15
Online published: 2022-07-15
Supported by
The Strategic Priority Research Program of Chinese Academy of Sciences(XDA20020402)
The National Natural Science Foundation of China(41971272)
Inner Mongolia is the important ecological barrier zone in northern China, which plays an important role in the prevention and control of wind in the regional ecosystem. Based on the Revised Wind Erosion Equation (RWEQ) model and the cost-recovery method, this study simulated the wind erosion prevention service (WEPS) in Inner Mongolia in 2010 and 2015, investigated the spatial pattern of material and monetary value of WEPS, and analyzed the differences among various cities and various ecosystems. The results indicated that the total WEPS of Inner Mongolia was estimated to be 73.87×10⁸ t in 2015, which was 4.61×10⁸ t less than in 2010, while the monetary value of WEPS was calculated to be 738.66×10⁸ yuan in 2015, which was 46.16×10⁸ yuan less than in 2010. Among all the leagues and cities, Xilin Gol League supported the highest WEPS, reaching 18.65×10⁸ t in 2015, while Wuhai provided the lowest. The WEPS of Hulunbeier increased the most, by 4.37×10⁸ t from 2010 to 2015. The WEPS in the grassland ecosystem was the highest among the different ecosystems, accounting for more than 55% of the total WEPS in Inner Mongolia, but it was reduced by 1.05×10⁸ t during the same period. The WEPS in the forest ecosystem increased the most, reaching 0.19×10⁸ t. This study found that the implementation of projects such as returning farmland to forests and grasses and sand control effectively increased the WEPS by increasing the forest area. However, unsuitable land use increased the desertification of ecosystems which resulted in a reduction of WEPS in Inner Mongolia.
WANG Yangyang , XIAO Yu , XU Jie , XIE Gaodi , QIN Keyu , LIU Jingya , NIU Yingnan , GAN Shuang , HUANG Mengdong . Evaluation of Inner Mongolia Wind Erosion Prevention Service based on Land Use and the RWEQ Model[J]. Journal of Resources and Ecology, 2022 , 13(5) : 763 -774 . DOI: 10.5814/j.issn.1674-764x.2022.05.002
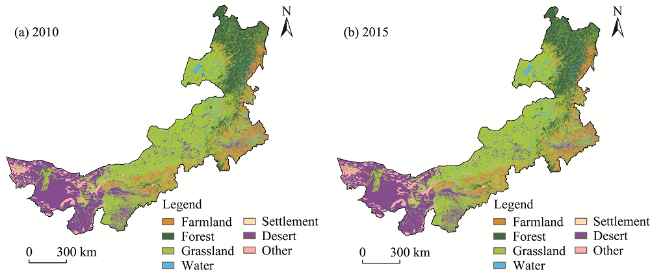
Fig. 1 Landuse maps of Inner Mongolia in 2010 and 2015 |
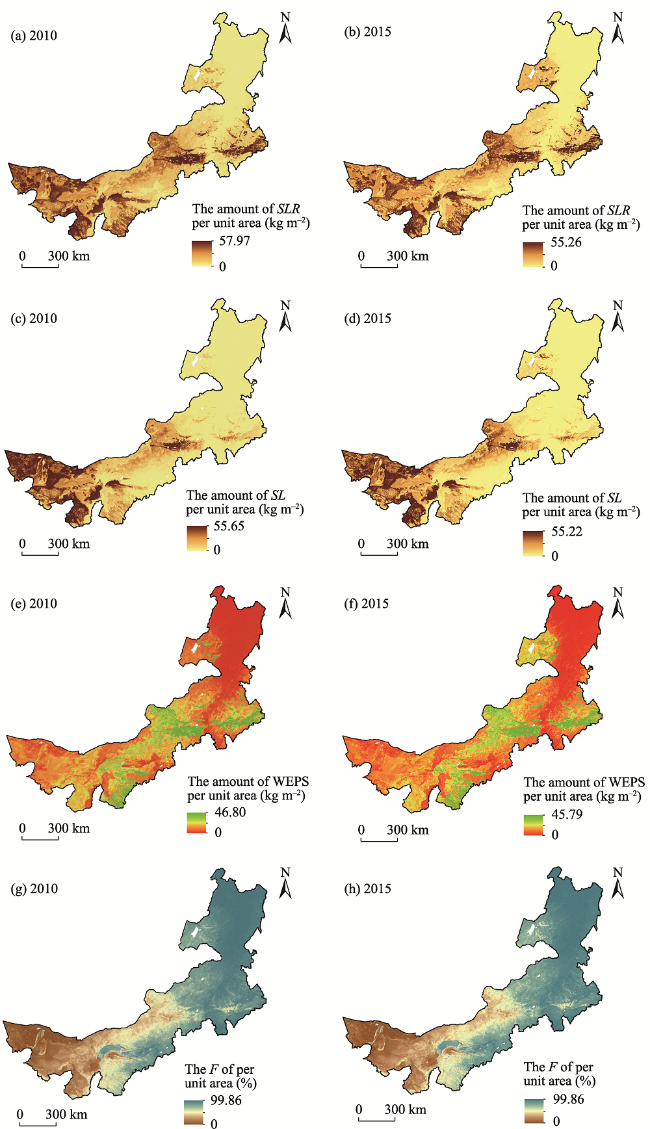
Fig. 2 The amounts of SLR, SL, WEPS and F per unit area in Inner Mongolia in 2010 and 2015. |
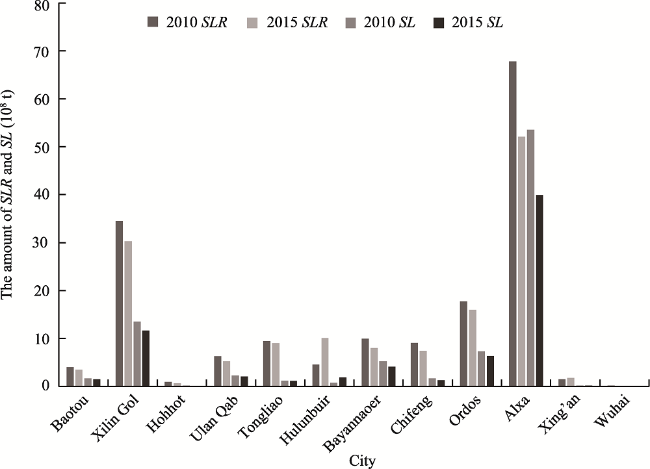
Fig. 3 The SL and SLR of different cities in Inner Mongolia in 2010 and 2015 |
Table 1 The amount of sand-fixing function of different cities in Inner Mongolia in 2010 and 2015 |
| City | 2010 | 2015 | Amount of change | F (%) | |||||||||
|---|---|---|---|---|---|---|---|---|---|---|---|---|---|
| Average (kg m-2) | Total (108 t) | Value (108 yuan) | Percentage (%) | Average (kg m-2) | Total (108 t) | Value (108 yuan) | Percentage (%) | Total (108 t) | Value (108 yuan) | Average 2010 | Average 2015 | Change | |
| Baotou | 8.38 | 2.31 | 23.13 | 3 | 7.15 | 1.97 | 19.73 | 3 | -0.34 | -3.40 | 63.40 | 64.11 | 0.71 |
| Xilin Gol | 10.50 | 20.99 | 209.95 | 27 | 9.33 | 18.65 | 186.52 | 25 | -2.34 | -23.43 | 71.46 | 72.35 | 0.89 |
| Hohhot | 4.68 | 0.80 | 7.98 | 1 | 3.44 | 0.59 | 5.87 | 1 | -0.21 | -2.11 | 86.93 | 87.36 | 0.43 |
| Ulan Qab | 7.47 | 4.05 | 40.48 | 5 | 5.89 | 3.19 | 31.90 | 4 | -0.86 | -8.58 | 71.66 | 72.24 | 0.58 |
| Tongliao | 14.00 | 8.25 | 82.45 | 11 | 13.37 | 7.88 | 78.76 | 11 | -0.37 | -3.69 | 91.30 | 91.49 | 0.19 |
| Hulunbuir | 1.53 | 3.82 | 38.22 | 5 | 3.28 | 8.19 | 81.88 | 11 | 4.37 | 43.66 | 94.44 | 93.82 | -0.62 |
| Bayannaoer | 7.41 | 4.77 | 47.72 | 6 | 6.13 | 3.95 | 39.48 | 5 | -0.82 | -8.24 | 51.45 | 52.51 | 1.06 |
| Chifeng | 8.58 | 7.34 | 73.45 | 9 | 7.10 | 6.08 | 60.83 | 8 | -1.26 | -12.62 | 89.69 | 90.19 | 0.50 |
| Ordos | 12.17 | 10.44 | 104.40 | 13 | 11.16 | 9.57 | 95.73 | 13 | -0.87 | -8.67 | 63.64 | 64.47 | 0.83 |
| Alxa | 5.98 | 14.26 | 142.59 | 18 | 5.10 | 12.16 | 121.63 | 16 | -2.10 | -20.96 | 24.33 | 26.12 | 1.79 |
| Xing’an | 2.53 | 1.37 | 13.66 | 2 | 2.91 | 1.57 | 15.70 | 2 | 0.20 | 2.04 | 95.08 | 95.01 | -0.07 |
| Wuhai | 3.72 | 0.08 | 0.80 | 0 | 2.89 | 0.06 | 0.62 | 0 | -0.02 | -0.18 | 56.77 | 57.50 | 0.73 |
| Total | 78.48 | 784.82 | 100 | 73.87 | 738.66 | 100 | -4.61 | -46.16 | |||||
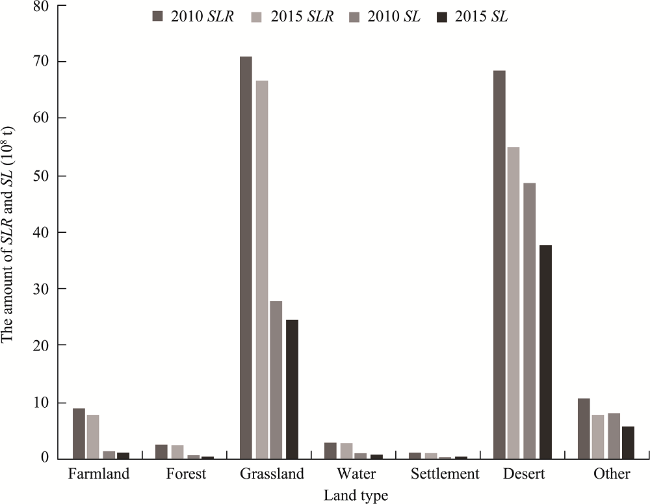
Fig. 4 The SL and SLR of different ecosystems in Inner Mongolia in 2010 and 2015 |
Table 2 The WEPS and F of different ecosystems in Inner Mongolia in 2010 and 2015 |
| Type | 2010 | 2015 | Variation | F (%) | |||||||||||
|---|---|---|---|---|---|---|---|---|---|---|---|---|---|---|---|
| Average (kg m-2) | Total (108 t) | Value (108 yuan) | Percentage (%) | Average (kg m-2) | Total (108 t) | Value (108 yuan) | Percentage (%) | Total (108t) | Value (108 yuan) | Average (kg m-2) | Area (km2) | Average 2010 | Average 2015 | Change | |
| Farmland | 6.78 | 7.73 | 77.32 | 10 | 5.89 | 6.70 | 67.03 | 9 | -1.03 | -10.28 | -0.89 | -147 | 89.56 | 89.63 | 0.07 |
| Forest | 1.20 | 1.97 | 19.74 | 3 | 1.31 | 2.17 | 21.67 | 3 | 0.19 | 1.93 | 0.12 | 236 | 96.84 | 96.77 | -0.07 |
| Grassland | 8.25 | 43.35 | 433.53 | 55 | 8.06 | 42.31 | 423.14 | 57 | -1.04 | -10.39 | -0.19 | -558 | 73.47 | 73.38 | -0.09 |
| Water | 6.59 | 2.00 | 19.95 | 3 | 6.91 | 2.09 | 20.88 | 3 | 0.09 | 0.93 | 0.32 | -79 | 81.75 | 81.76 | 0.01 |
| Settlement | 7.88 | 0.92 | 9.15 | 1 | 6.64 | 0.95 | 9.54 | 1 | 0.04 | 0.39 | -1.23 | 2745 | 84.13 | 81.88 | -2.25 |
| Desert | 8.25 | 19.84 | 198.35 | 25 | 7.33 | 17.46 | 174.63 | 24 | -2.37 | -23.73 | -0.92 | -2091 | 33.08 | 32.93 | -0.15 |
| Other | 5.26 | 2.68 | 26.78 | 3 | 4.28 | 2.18 | 21.76 | 3 | -0.50 | -5.01 | -0.98 | -105 | 32.61 | 32.58 | -0.03 |
| Total | 78.48 | 784.82 | 100 | 73.87 | 738.66 | 100 | -4.61 | -46.16 | |||||||
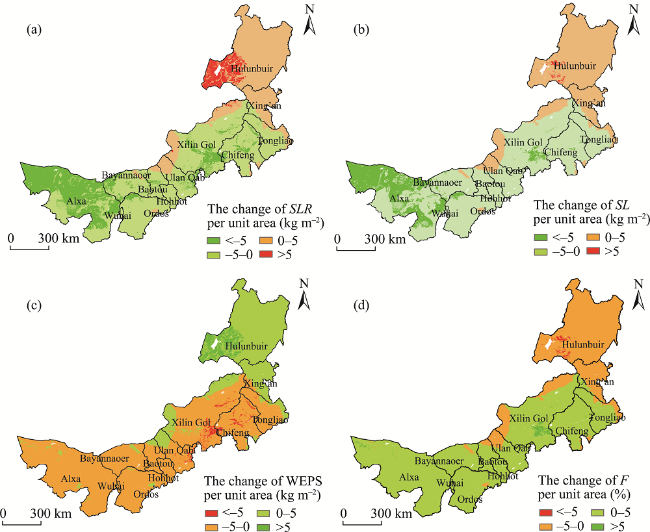
Fig. 5 The changes of SLR, SL, WEPS and F per unit area of Inner Mongolia from 2010 to 2015. |
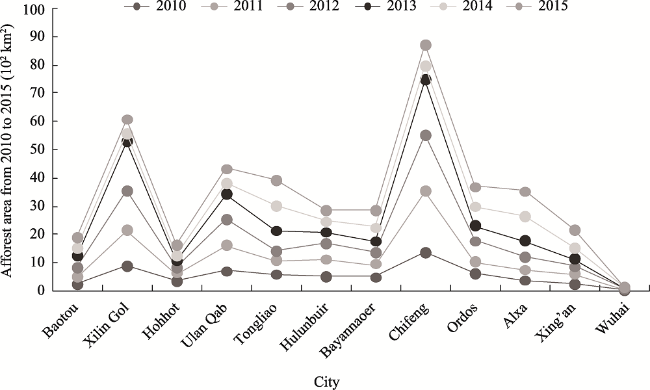
Fig. 6 Afforestation areas of different cities in Inner Mongolia from 2010 to 2015 |
Table 3 Afforestation in Inner Mongolia from 2010 to 2015 (Unit: 102 km2) |
| Year | Total afforestation area | Afforestation area | Converting farmland to forest and barren hills for afforestation | Natural forest protection resource afforestation | Afforestation of Beijing-Tianjin sandstorm source control project | The fifth phase of the shelterbelt project | Total | ||
|---|---|---|---|---|---|---|---|---|---|
| Artificial | Aerial seeding | Closing hills for afforestation | |||||||
| 2010 | 65.78 | 23.02 | 7.90 | 34.86 | 5.50 | 11.70 | 28.96 | 15.48 | 127.42 |
| 2011 | 73.20 | 33.50 | 11.40 | 28.30 | 4.00 | 8.70 | 40.80 | 12.50 | 139.20 |
| 2012 | 78.10 | 35.70 | 6.50 | 35.90 | 4.00 | 11.60 | 42.20 | 12.30 | 148.20 |
| 2013 | 80.30 | 34.80 | 7.90 | 37.60 | 4.03 | 8.83 | 46.90 | 8.56 | 148.62 |
| 2014 | 67.20 | 46.00 | 6.90 | 14.30 | 1.60 | 8.60 | 16.20 | 13.40 | 107.00 |
| 2015 | 73.40 | 41.60 | 8.30 | 23.50 | 2.50 | 9.50 | 12.60 | 14.10 | 112.10 |
| Total | 437.98 | 214.62 | 48.90 | 174.46 | 21.63 | 58.93 | 187.66 | 76.34 | 782.54 |
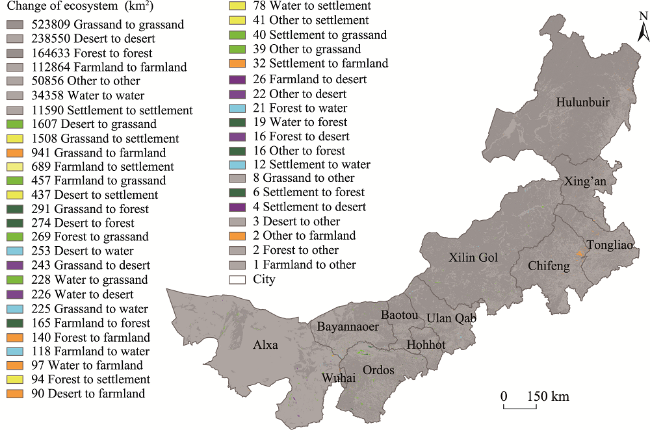
Fig. 7 The changes of different ecosystems in Inner Mongolia from 2010 to 2015 |
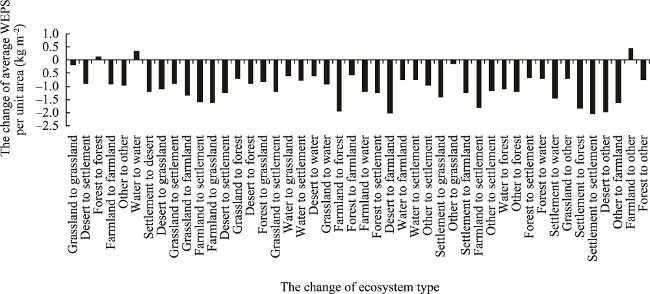
Fig. 8 Changes in the average of WEPS in different ecosystems in Inner Mongolia from 2010 to 2015 |
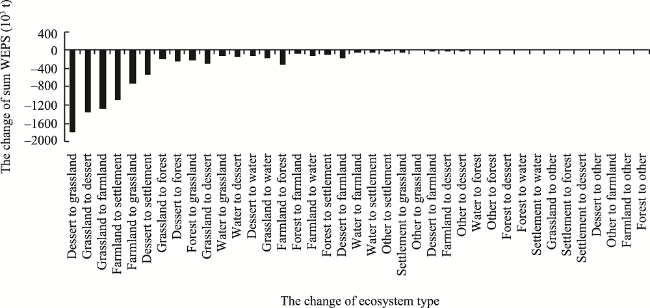
Fig. 9 Changes in the sum of WEPS in different ecosystems in Inner Mongolia from 2010 to 2015 |
| [1] |
|
| [2] |
|
| [3] |
|
| [4] |
|
| [5] |
|
| [6] |
|
| [7] |
|
| [8] |
|
| [9] |
|
| [10] |
|
| [11] |
|
| [12] |
|
| [13] |
|
| [14] |
|
| [15] |
|
| [16] |
|
| [17] |
|
| [18] |
|
| [19] |
|
| [20] |
|
| [21] |
|
| [22] |
|
| [23] |
|
| [24] |
|
| [25] |
|
| [26] |
|
| [27] |
|
| [28] |
|
/
| 〈 |
|
〉 |