Resources and Environment

Frequency and Causes of Oil Spill Accidents from Ships and Storage Tanks in Quanzhou, China

  • SHI Jing ,
  • TIAN Yujun , * ,
  • REN Lili
Expand
  • China Waterborne Transport Research Institute, Beijing 100088, China
*TIAN Yujun, E-mail:

SHI Jing, E-mail:

Received date: 2021-09-18

  Accepted date: 2022-02-08

  Online published: 2022-07-12

Abstract

With the rapid development of Quanzhou, the risk of offshore oil spill accidents has increased. Once a spill accident takes place, the spilled oil causes decades or even hundreds of years of continuous pollution to the marine environment. The direct economic loss may be as high as hundreds of millions of yuan, while the natural resources that are almost impossible to fully recover after such pollution may generate inestimable indirect economic losses in the long term. Therefore, predicting the accident probability, analyzing the causes of risk and putting forward suggestions for improvement have important practical guiding significance for reducing the risk and improving the emergency prevention and ability to control offshore oil spill accidents. Based on the statistical data of cargo throughput, the number of ships entering and leaving the port, and maritime pollution accidents in Quanzhou from 2011 to 2020, the frequency of oil spills during the 14th Five-Year Plan could be predicted by using the direct calculation method and fault tree analysis (FAT). The results show that the frequency of operational and average oil spills from ships are once in 4.92 years and once in 2.41 years, respectively, while the frequency of oil spills from storage tanks is once in 7.28 years. The main causes are anthropic factors, which are manifested as irregular operation, misoperation, unfamiliar equipment, disorganization of the emergency response and failure of the emergency facilities. Therefore, the suggestions put forward for reducing accidents in the future include enhancing the inspection of crew member qualifications as well as the offshore supervision of engineering operation vessels and fishing vessels, increasing the proportion of terminal emergency equipment and personnel and participation in emergency actions, clarifying the division of responsibilities between the terminal and cleanup company, and revising the relevant standards for the evaluation of the terminal’s ability to cope with the emergency of offshore oil spill accidents.

Cite this article

SHI Jing , TIAN Yujun , REN Lili . Frequency and Causes of Oil Spill Accidents from Ships and Storage Tanks in Quanzhou, China[J]. Journal of Resources and Ecology, 2023 , 14(2) : 391 -398 . DOI: 10.5814/j.issn.1674-764x.2023.02.017

1 Introduction

As a pioneer for the construction of the “21st Century Maritime Silk Road”, Quanzhou has once again become highly dependent on its dynamic port shipping economy with the official implementation of the national maritime Belt and Road Initiative (Quanzhou Maritime Safety Administration of the People’s Republic of China, 2020). In 2020, the throughput of the Quanzhou Port registered 128 million t, breaking the 100 million t mark for nine years in a row. However, this has led to the increased risks of offshore oil spills due to the continuous construction and operation of oil tanks at the port, the rapid growth of ship traffic and an ever-present trend of building large ships, thus posing a serious threat to the coastal ecological environment, natural resources and stable economic and social development. The Chinese government and all sectors of society are now attaching greater importance to both risk prevention and control.

2 Data

The data for this study came from the Announcement on the Security Status of Maritime Traffic in Quanzhou and the official website of the Quanzhou Maritime Safety Administration of China. The statistics were obtained for years 2011 to 2020 (Ministry of Transport of the People’s Republic of China, 2015; Quanzhou Maritime Safety Administration of the People’s Republic of China, 2012,2013,2014,2015, 2017,2018,2019,2020,2021).

3 Methodology

The methods for analyzing accident frequency include the direct calculation method and deductive reasoning method. The former includes analogy and posterior frequency calculation. The conclusion of the analogy should be revised in accordance with the status quo and future trends of the comprehensive development of regional transportation. Usually, the analogy is a subjective estimate made by experienced experts. The posterior frequency calculation is based on the conditional frequency of the event risk type. The deductive reasoning consists of event tree analysis (ETA) and fault tree analysis (FTA). The ETA is from cause to effect, while the FTA is from effect to cause.
From 2011 through 2020, there were no oil spill accidents from storage tanks in Quanzhou. Since the oil spill accidents related to storage tanks usually take place due to multiple causes that are mutually inter-related, the fault tree analysis is more applicable.

3.1 Oil spill accidents from ships

Quanzhou is currently and will be carrying out port construction for the next 5 years. Enhanced ship density, larger ships, and the completion and commissioning of large crude oil terminals will lead to increased risks of oil spills. However, improved traffic management and channel conditions will effectively reduce the frequency of oil spill accidents. Given the complexity of the analogy method and the objectivity of accident frequency analysis conclusions, the posterior frequency calculation is adopted for the frequency analysis of oil spill accidents from ships.

3.1.1 Analysis process of the posterior frequency calculation

First, historical data and experience are used to obtain the basic frequency value of oil spill accidents from ships. Second, the basic frequency value of oil spill accidents from ships is used as the basic value to calculate the conditional frequency of the oil spill accidents based on the accident-influencing factors that are obtained via logical analysis. Finally, the frequency of oil spill accidents from ships is analyzed and obtained by classifying and summarizing the conditional frequency of the influencing factors in accordance with the operational and average oil spills from ships. The analysis process of the posterior frequency calculation is shown in Fig. 1.
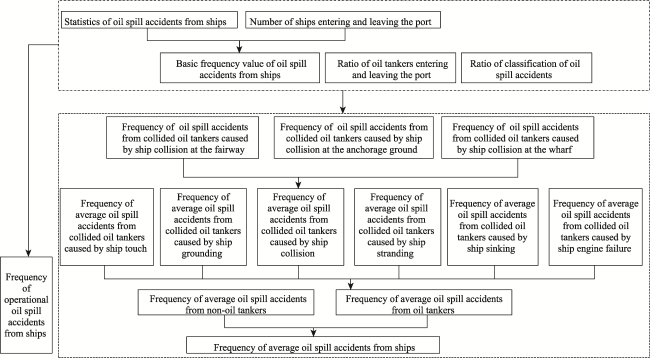
Fig. 1 Analysis process of the posterior frequency calculation

3.1.2 Basic frequency value of oil spill accidents from ships

The basic frequency value of oil spill accidents from ships refers to the frequency of oil spill accidents that may take place on each ship within the same research period in the research area.
The frequency of oil spill accidents from a ship sailing at sea is subject to a discrete binomial distribution. The formula for calculating the basic value of the risk frequency of oil spill accidents from ships is as follows (Wang et al., 2009; Zhang, 2011):
$F(k)=C_{n}^{k}{{f}^{k}}{{(1-f)}^{n-k}}=\frac{n!}{k!(n-k)!}{{f}^{k}}{{(1-f)}^{n-k}}$
where $F\left( k \right)$ refers to the frequency of k accidents from n ships;f refers to the frequency that each ship encounters an accident, i.e., the basic frequency value of oil spill accidents from ships; 1–f is the frequency that no accident takes place on each ship; n is the number of ships, k is the number of accidents that take place on n ships, and $C_{n}^{k}$ is the combination of k accidents from n ships. If the confidence coefficient of no oil spill accidents from ships taking place in Quanzhou is 95%, then:
$F(k\ge 1)=\underset{k=1}{\overset{n}{\mathop{\mathop{\sum }^{}}}}\,\text{C}_{n}^{k}{{f}^{k}}{{(1-f)}^{n-k}}\le 0.95$
where$F\left( k\ge 1 \right)$ refers to the frequency that more than one accident takes place on ships; and
$\text{F}(\text{k}=0)=\text{C}_{\text{n}}^{0}{{(1-\text{f})}^{\text{n}}}={{(1-\text{f})}^{\text{n}}}$
Where $F\left( k=0 \right)$ refers to the frequency that no accidents take place onships. As it is known that:
$F(k=0)=1-F(k\ge 1)$
then
$f\le 1-\sqrt[n]{0.05}$

3.1.3 Operational oil spill accidents

Operational oil spill accidents mainly occur during the loading or unloading cargo oil (including bulk hazardous chemicals), refueling or other operations. The causes may include equipment damage, misoperation and illegal discharge. The formula for calculating the occurrence frequency of operational oil spill accidents from ships in Quanzhou is:
$F(o)=f\times r(o)\times n$
Where $F(o)$ refers to the frequency of operational oil spill accidents from ships; $r(o)$ refers to the ratio of operational oil spill accidents to the total number of oil spill accidents; and o represents operational oil spill accidents from ships.

3.1.4 Average oil spill accidents

In accordance with associated statistical data, the causes of average oil spill accidents in Quanzhou include collision, touch, stranding, fire, engine failure, sinking, wind damage, and grounding. The possible locations where a ship collision accident may take place include the fairway, anchorage ground and wharf apron. In the fairway or anchorage ground, if an oil spill is caused by oil tanker collision, at least one of the two ships that collide with each other is an oil tanker; but at the wharf, the accident may take place under the circumstance that only one oil tanker has collided with the wharf apron. Fire and wind damage are secondary accidents of ship traffic accidents, or causes of ship accidents, so they are not separately included in the frequency calculation. Oil spill accidents triggered by touching, stranding, fire, engine failure, sinking, wind damage, and grounding may occur with only one oil tanker involved. The formula for calculating the occurrence frequency of average oil spill accidents from ships in Quanzhou is:
$\text{F}(\text{a})=\text{F}(\text{y})+\text{F}(\text{N})$
where F(a) refers to the frequency of average oil spill accidents from ships; F(y) refers to the frequency of average oil spill accidents from oil tankers; F(N) refers to the frequency of average oil spill accidents from non-oil tankers; a represents the average oil spill accidents from ships; y represents the average oil spill accidents from oil tankers; and N represents the average oil spill accidents from non-oil tankers.
The formula for calculating the occurrence frequency of average oil spill accidents from non-oil tankers is:
$F(N)=r(a)\times f\times \left( 1-\frac{R}{2} \right)\times n$
where $r\left( a \right)$ is the ratio of average oil spill accidents to the total number of oil spill accidents from ships; and R is the ratio between the number of oil tankers entering and leaving the port and the total number of ships entering and leaving the port. Assuming that the number of oil tankers accounts for one-half of the total oil tankers entering and leaving the port, the ratio of the number of oil tankers entering and leaving the port is $\frac{R}{2}$ and that of non-oil tankers entering and leaving the port is $1-\frac{R}{2}$.
The formula for calculating the occurrence frequency of average oil spill accidents from oil tankers (Zhang, 2011) is:
$\text{F}(\text{y})=\text{F}(\text{c})+\text{F}(\text{B})$
where F(c) refers to the frequency of average oil spill accidents from collided oil tankers caused by ship collision; F(B) refers to the frequency of $\text{average}$ oil spill accidents from oil tankers in scenario B; c represents the collision in an average oil spill accident; and B represents the touch, stranding, engine failure, sinking or grounding in an average oil spill accident.
$\text{F}(\text{c})=\text{F}(\text{A})+\text{F}(\text{w})$
where $F(A)$ refers to the frequency of $\text{average}$ oil spill accidents from collided oil tankers in scenario A; $F(w)$ refers to the frequency of $\text{average}$ oil spill accidents from collided oil tankers caused by ship collision at the wharf; A represents the collision at the fairway or at the anchorage ground in an average oil spill accident; and w represents the collision at the wharf in an average oil spill accident.
$\text{F}(\text{A})=\text{r}(\text{a})\times \text{r}(\text{c})\times \text{r}(\text{A})\times \text{f}\times \left[ {{\left( \frac{\text{R}}{2} \right)}^{2}}+2\times \frac{\text{R}}{2}\times \left( 1-\frac{\text{R}}{2} \right) \right]\times \text{n}$
where r(c) is the ratio of oil spill accidents from ships to the total number of average oil spill accidents; and r(A) represents the ratio of oil spill accidents caused by ship collision at the fairway or the anchorage ground to the number of oil spill accidents caused by ship collision.
$F(w)=r(a)\times r(c)\times r(w)\times f\times \frac{R}{2}\times n$
Where r(w) represents the ratio of oil spill accidents caused by ship collision at the wharf to the number of oil spill accidents caused by ship collision.
$\text{F}(\text{B})=\text{r}(\text{a})\times \text{r}(\text{B})\times \text{f}\times \frac{\text{R}}{2}\times \text{n}$
Where r(B) represents the ratio of oil spill accidents caused by touch, stranding, engine failure, sinking or grounding to
the number of average oil spill accidents.

3.2 Oil spill accidents from storage tanks

3.2.1 Fault Tree Model of oil spill accidents from storage tanks

In accordance with the operational process documents of part of the storage tank farms in Quanzhou, a report on the typical oil spill accidents of storage tank farms in China, and a report of the C9 leakage accident, the causes of the oil spill accidents in the storage tank farms and the internal logical relationship were determined, and a fault tree was established accordingly (Hu, 1988). In the model, T represents the top event; a capital letter plus a number (such as A1) represents an intermediate event, where the letters that are same indicate events that belong to the same level, and events at different levels are distinguished in alphabetical order; and X plus a number represents a bottom event. The fault tree model of oil spill accidents in a storage tank farm is shown in Fig. 2.
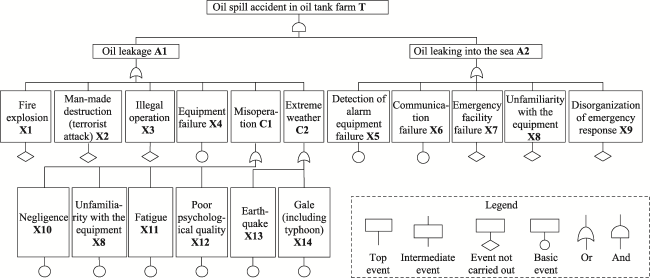
Fig. 2 Fault Tree Model of oil spill accident in a storage tank farm

3.2.2 Qualitative analysis

The minimum cutset reflects the danger of the system, so the more the minimum cutsets, the smaller the order and the greater the danger. By solving the minimal radius set, an effective way to avoid the top event can be found, and the factors influencing the avoidance methods can be qualitatively analyzed. Moreover, preliminary sorting is performed in accordance with the frequency that each bottom event occurs in the minimum cutset. Through that sorting process, the importance of each bottom event can be determined qualitatively and important links for avoiding risks can be pinpointed.

3.2.3 Quantitative analysis

The quantitative analysis includes the calculations of the occurrence frequency of top events, Fussell-vesely importance and Birnbaum importance, with the purpose of quantitatively determining the occurrence frequency of top events and their obvious causes.
Taking the occurrence frequency of bottom events as the basic data, the “And” and “Or” operation rules are adopted to calculate the occurrence frequency of the top events, i.e., the occurrence frequency of an oil spill accident in the storage tank farm. As for the occurrence frequency of the bottom events, the acquisition method is determined in accordance with the completeness of statistical data related to the oil spill accidents in the storage tank farm. If the number of research events is sufficient to support the statistical work of the bottom events or if there is a frequency statistics database of the bottom events, then the occurrence frequency of the bottom events can be calculated or acquired by searching in the database. If the number of research events is too few to generate any statistical significance, then the occurrence frequency of each bottom event can be determined by consulting the literature, drawing on the experience data of other ports or statistical data of other similar events, or statistically analyzing other data associated with the situation, such as the natural economy data issued by local authorities.
Fussell-vesely importance reflects the degree of influence of the bottom events upon the occurrence frequency of the top events. The calculation formula is:
${{\text{I}}_{\text{FV}}}\left( \text{Xi} \right)=\frac{\sum\limits_{i=1}^{m}{F({{c}_{i}})}}{F}$
where ${{\text{I}}_{\text{FV}}}\left( \text{Xi} \right)$ represents the Fussell-vesely importance of bottom event $\text{Xi}$; $\underset{\text{i}=1}{\overset{\text{m}}{\mathop \sum }}\,\text{F}\left( {{\text{c}}_{\text{i}}} \right)$ represents the algebraic sum of the occurrence frequencies of all minimum cutsets composed of bottom event $\text{Xi}$; F represents the occurrence frequency of top event $\text{T}$; $i$ is the number of the bottom event and m is the total number of bottom events.
Birnbaum importance reflects the sensitivity of the occurrence frequency of a top event to a change in the frequency of a bottom event. Its calculation formula is:
${{\text{I}}_{\text{B}}}\left( \text{Xi} \right)=\frac{\sum\limits_{i=1}^{n}{\text{F}\left( {{\text{c}}_{\text{i}}} \right)}}{\text{F}\left( \text{Xi} \right)}$
where ${{\text{I}}_{\text{B}}}\left( \text{Xi} \right)$ represents the Birnbaum importance of bottom event $\text{Xi}$; $\text{F}\left( \text{Xi} \right)$ represents the occurrence frequency of bottom event $\text{Xi}$; and $\underset{\text{i}=1}{\overset{\text{m}}{\mathop \sum }}\,\text{F}\left( {{\text{c}}_{\text{i}}} \right)$ represents the algebraic sum of the occurrence frequencies of all the minimum cutsets composed of bottom event $\text{Xi}$.

4 Results

4.1 Oil spill accidents from ships

From 2011 through 2020, three offshore oil spill accidents occurred in Quanzhou. Among them, there was one operational oil spill accident, leading to the leakage of C9 into the sea during loading. The amount of leakage was 69.1 t. The cause of the accident was that as the tide level decreased and weight of the ship increased, so the ship sank and the loading hose was torn apart. To make matters worse, the terminal company concealed the situation during the emergency response process; and such concealment led to the wrong emergency decisions, eventually allowing the area of the leakage to expand by several times. There were also two average oil spill accidents. The amount of the leakage was less than 1 ton. These accidents were caused respectively by ship grounding and sinking, both involving non-oil tankers.
The throughput of oil products (including liquid dangerous goods) in Quanzhou has occupied more than half of the total throughput. The very large crude carriers (VLCC) enter and leave the port more than 200 times per year. The ships seen entering the port are mostly huge and from foreign countries, and the share of VLCCs has significantly increased. Generally, the oil spill accidents from oil tankers may cause the leakage of hundreds or even thousands of tons of pollutants into the sea, so they may impose greater impacts upon the marine ecological environment and the local economic and social environment. Therefore, the risk of oil spill accidents from oil tankers cannot be ignored.

4.1.1 Basic frequency value of oil spill accidents from ships

From 2011 through 2020, the number of ships entering and leaving the port of Quanzhou remained basically stable, registering an average of 44349 ships per year. The growth rate in most years remained at between 0.02 and 0.03; the largest annual growth rate was 0.22, while the lowest annual growth rate was ‒0.09. The Quanzhou Port is now under rapid development. Meanwhile, given that the Chinese shipping industry is suffering severely from the continued depression of the global shipping economy and the great impact of COVID-19 upon foreign trade, the number of ships entering and leaving the port will keep growing at a slow but steady pace. It is expected that during the “14th Five-Year Plan” period (from 2021 to 2025), the average annual growth rate of ships entering and leaving the port will remain at 0.025, and the number of ships entering and leaving the port will total n=44349×(1+0.025)5×5=250885 ships, so it can be concluded that the basic frequency value of oil spill accidents from ships is 1.19×10‒5.

4.1.2 Frequency of operational oil spill accidents

The operational oil spill accidents in Quanzhou account for 34% of the total oil spill accidents from ships. Based on this proportion, the frequency of operational oil spill accidents in Quanzhou during the “14th Five-Year Plan” period is 1.015, i.e., with an operational oil spill occurring once in about 4.92 years.

4.1.3 Frequency of average oil spill accidents

Pursuant to the statistical data of average oil spill accidents in Fujian from 2008 to 2019 and the port conditions of Quanzhou, the value of classification ratio r of the average oil spill accidents is shown in Table 1, and collision accidents that took place in the fairway, anchorage ground and terminal accounted for 75%, 15% and 10% of the ship collision accidents, respectively. On average, oil spill accidents accounted for 66% of the total oil spill accidents from ships, and the number of oil tankers entering and leaving the port accounted for R=23%, so the risk frequencies of average oil spill accidents from oil tankers and non-oil tankers in Quanzhou are 0.33 and 1.74, respectively. The risk frequency of average oil spill accidents from ships in Quanzhou is 2.079, so the average oil spill occurs once in about 2.41 years.
Table 1 Statistics on the classification ratios of average oil spill accidents
Type of Accident Percentage (%)
Collision 60
Touch 8
Grounding 6
Engine failure 2
Sinking 11
Stranding 13

4.1.4 Cause analysis

In accordance with the statistical data, the main causes behind ship accidents may include: insufficient safety awareness and sensitivity of crew members, unfamiliarity with the navigation environment; an insufficient number of crew members, and disqualification of some crew members for their posts; severe weather conditions of cold waves and strong wind in winter, the foggy season, typhoons, etc.; and the vulnerability of sand dredgers and sand carriers to ship collision and grounding. In addition to the uncontrollable environmental factors, the other three are all anthropic factors.

4.2 Oil spill accidents from storage tank

4.2.1 Qualitative analysis

There are 50 minimum cutsets in the oil spill accidents from the storage tank farm. Among them, there is one first-order minimum cutset, i.e., {X8}, and 49 second-order minimum cutsets. There are two minimum path sets, namely {X5, X6, X7, X8, X9} and {X1, X2, X3, X4, X8, X10, X11, X12, X13, X14}. Based on the frequency of occurrence of each bottom event in the minimum cutset, the bottom events are preliminarily sorted as:
$N\left( \text{X}8 \right)>N\left( \text{X}5 \right)=N\left( \text{X}6 \right)=N\left( \text{X}7 \right)=N\left( \text{X}9 \right)>N\left( \text{X}1 \right)$ $=N\left( \text{X}2 \right)=N\left( \text{X}3 \right)=N\left( \text{X}4 \right)=N\left( \text{X}10 \right)=N\left( \text{X}11 \right)$$=N\left( \text{X}12 \right)=N\left( \text{X}13 \right)=N\left( \text{X}14 \right)$
where $N\left( \text{Xi} \right)$ is the number of minimum cut sets containing the base event Xi. Note that the same base event does not occur repeatedly in the same minimum cutset.
There are so many possibilities for an oil spill accident to take place in a storage tank farm, and they are more dangerous. However, the ways to avoid the accidents are fewer, but they have more influencing factors. Specifically, X8 appears most frequently in the minimum cutset, followed by X5, X6, X7, and X9, i.e., equipment and facilities and management measures in emergency actions. As a result, ensuring the effectiveness of the emergency response capability is an important part of risk avoidance.

4.2.2 Quantitative analysis

In this paper, the occurrence frequency of various bottom events is determined by acquisition work (Chen et al., 2016), empirical data from other ports and statistics released by local meteorological bureaus. The results are shown in Table 2, and the calculation results of Fussell-vesely importance and Birnbaum importance are shown in Table 3.
Table 2 Statistics on the occurrence frequency of each bottom event
Bottom event Occurrence frequency
Fire explosion X1 0.0178
Man-made destruction (Terrorist attack) X2 0.0118
Illegal operation X3 0.176
Equipment failure X4 0.021
Detection of alarm equipment failure X5 0.00000012
Communication failure X6 0.0901
Emergency facility failure X7 0.0005104
Unfamiliarity with the equipment X8 0.00341
Disorganization of emergency response X9 0.1
Negligence X10 0.06
Fatigue X11 0.2625
Poor psychological quality X12 0.1192
Earth-quake X13 0.001
Gale (including typhoon) X14 0.018
Table 3 Results of Fussell-vesely Importance and Birnbaum Importance Calculations for Each Bottom Event
Bottom event Fussell-vesely importance Birnbaum importance
Fire explosion X1 0.0251 5.1541
Man-made destruction (Terrorist attack) X2 0.0167 5.1541
Illegal operationX3 0.2485 5.1541
Equipment failure X4 0.0297 5.1541
Detection of alarm equipment failure X5 0 1.4480
Communication failure X6 0.4529 1.4480
Emergency facility failure X7 0.0026 1.4480
Unfamiliarity with the equipment X8 0.0466 0.5325
Disorganization of emergency response X9 0.5027 1.4480
Negligence X10 0.0847 5.1541
Fatigue X11 0.3707 5.1541
Poor psychological quality X12 0.1683 5.1541
Earth-quake X13 0.0013 5.1541
Gale (Including typhoon) X14 0.0254 5.1541

Note: The occurrence frequency of a top event is 0.137, i.e., with an accident occurring once in 7.28 years. The Fussell-vesely importance is sorted as: ${{I}_{FV}}\left( \text{X}9 \right)>{{I}_{FV}}\left( \text{X}8 \right)>{{I}_{FV}}\left( \text{X}7 \right)>{{I}_{FV}}\left( \text{X}6 \right)>{{I}_{FV}}\left( \text{X}5 \right)>{{I}_{FV}}\left( \text{X}4 \right)>{{I}_{FV}}\left( \text{X}3 \right)>$ ${{I}_{FV}}\left( \text{X}2 \right)>{{I}_{FV}}\left( \text{X}14 \right)>{{I}_{FV}}\left( \text{X}13 \right)>{{I}_{FV}}\left( \text{X}12 \right)>{{I}_{FV}}\left( \text{X}11 \right)>{{I}_{FV}}\left( \text{X}10 \right)>{{I}_{FV}}\left( \text{X}1 \right),$while the Birnbaum importance is sorted as:${{I}_{B}}\left( \text{X}9 \right)>{{I}_{B}}\left( \text{X}8 \right)>$${{I}_{B}}\left( \text{X}5 \right)=$ ${{I}_{B}}\left( \text{X}6 \right)={{I}_{B}}\left( \text{X}7 \right)>{{I}_{B}}\left( \text{X}1 \right)={{I}_{B}}\left( \text{X}2 \right)={{I}_{B}}\left( \text{X}3 \right)={{I}_{B}}(\text{X}4)={{I}_{B}}\left( \text{X}10 \right)=$ ${{I}_{B}}\left( \text{X}11 \right)={{I}_{B}}\left( \text{X}12 \right)={{I}_{B}}\left( \text{X}13 \right)={{I}_{B}}\left( \text{X}14 \right)$.

The events that rank in the front are X5‒X9. Among these five, X9 comes first, followed by X8. Therefore, the effectiveness of equipment and facilities and management measures in emergency operations have relatively greater impacts upon the top events. Among them, the two bottom events of disorganization of emergency response and unfamiliarity with equipment and facilities have the most noteworthy impacts. The acquired obvious cause is basically consistent with the actual situation. Currently, the emergency capability of the terminal is generally realized by signing a service agreement with a pollution cleanup company. Therefore, even if the terminal is equipped with emergency equipment, the emergency personnel from the pollution cleanup company are normally entrusted to carry out the cleanup operation and equipment maintenance, and even to conduct daily emergency drills on behalf of the terminal. Basically, there are no full-time emergency responders for oil spill accidents at the terminal. However, the cleanup company normally sends no emergency personnel to stay at the terminal permanently. This arrangement has usually led to disorganization in the initial response to an accident and an inability to effectively control the situation prior to the arrival of emergency personnel from the cleanup company, thus increasing the risk of accidents and damage to resources and the environment.

5 Conclusions

Crude oil and bunker fuel oil are the main pollutants to the sea in offshore oil spill accidents. They are characterized by high density, high viscosity, and insolubility in water. Once a spill accident takes place, the leakage residue is very difficult to remove, causing decades or even hundreds of years of continuous pollution to the marine environment. The direct economic loss may be as high as hundreds of millions of yuan, while the natural resources that are almost impossible to fully recover after the event may cause inestimable indirect economic losses. Therefore, predicting the accident probability, analyzing the causes of risk and putting forward improvement suggestions have important practical guiding significance for reducing the risk and improving the emergency prevention and ability to control offshore oil spill accidents.
Given the complexity of the analogy method and objectivity of the accident frequency analysis conclusions, the posterior frequency calculation was adopted for the frequency analysis of oil spill accidents from ships. The basic data used were the statistical data of cargo throughput, the number of ships entering and leaving the port, and maritime pollution accidents in the Quanzhou area from 2011 to 2020. The results show that during the “14th Five-Year Plan” period, the frequency of operational oil spill accidents is once in 4.92 years, and the frequency of average ship oil spill accidents is once in 2.41 years. The main causes leading to ship accidents may include: insufficient safety awareness and sensitivity of crew members, unfamiliarity with the navigation environment; an insufficient number of crew members, and disqualification of some crew members for their posts; severe weather conditions of cold waves and strong wind in winter, the foggy season, typhoons, etc.; and vulnerability of sand dredgers and sand carriers to ship collision and grounding. In addition to the uncontrollable environmental factors, the other three are all anthropic factors. The oil spill accidents in the storage tank farms have the characteristics of multiple causes and mutual influences, so the fault tree analysis method was used for qualitative and quantitative analysis. The frequency of an oil spill accident in the storage tank farms is once in 7.28 years. There are so many possibilities for oil spill accidents to take place in the storage tank farms, and they are more dangerous. However, the ways to avoid the accidents are fewer, and they have more influencing factors. Among them, disorderly emergency organization and unfamiliar equipment are the most prominent causes. This result is basically consistent with the actual situation.
In order to effectively reduce the risk of the offshore oil spills, three suggestions are put forward here.
(1) In response to the oil spill accidents from ships, it is recommended that relevant management organizations should enhance the inspection of crew members’ certificates and qualifications, as well as the offshore supervision of engineering operation vessels and fishing vessels.
(2) In response to the oil spill accidents in the storage tank farm, it is recommended that the consciousness of responsibility of terminal enterprises should be strengthened. Except for monitoring and warning, the terminal should not be allowed to fully transfer the emergency response responsibility to any pollution cleanup enterprise through an agreement. The terminal should be equipped with at least the basic emergency preparedness equipment and materials in accordance with the prevailing standards and rules, and it should establish its own professional emergency response team, enhance the participation and sense of responsibility of terminal staff in special trainings and drills for oil spill cleanup, increase the sensitivity of terminal staff to accidents, and eliminate inadequate training, man-machine mismatch, ambiguous job duties and responsibilities, poor psychological quality and weak legal consciousness.
(3) It is also recommended that the related competent authorities should organize studies and improve the management system of offshore oil spill cleanup agreements as soon as possible. They should also revise the relevant standards on the evaluation of the terminal’s ability to cope with the emergency of offshore oil spill accidents, and clarify the content inventory and proportion that can be negotiated, as well as the division of responsibilities for the emergency response time and emergency geographic area between the terminal and the cleanup company. Moreover, the relevant competent authorities should evaluate the impact of the terminal’s offshore oil spill cleanup agreement upon the regional comprehensive emergency response capability during the periodic inspections of the terminal’s emergency capability.
[1]
Chen X X, Lu J S, Wu W F, et al. 2016. The Fault Tree Analysis of LNG carrier carge leakage on loading and unloading operation. Journal of Zhejiang Ocean University (Natural Science), 35(6): 509-513. (in Chinese)

[2]
Hu C S. 1989. Reliability engineering-design, test, analysis and management. Beijing, China: China Astronautic Publishing House. (in Chinese)

[3]
Jin H M, Dai L W. 2006. Risk estimate and countermeasure on accidental oil spill from ships in sea area of Ningbo Port. Journal of Zhejiang Transportation College, 7(2): 33-36. (in Chinese)

[4]
Ministry of Transport of the People’s Republic of China. 2015. Statistical bulletin of transportation industry development in 2014. Beijing, China: Ministry of Transport of the People’s Republic of China. (in Chinese)

[5]
Quanzhou Maritime Safety Administration of the People’s Republic of China. 2012. Quanzhou Prefecture Marine Traffic Safety Bulletin (2011). Quanzhou, China: Quanzhou Maritime Safety Administration of the People’s Republic of China. (in Chinese)

[6]
Quanzhou Maritime Safety Administration of the People’s Republic of China. 2013. Quanzhou Prefecture Marine Traffic Safety Bulletin (2012). Quanzhou, China: Quanzhou Maritime Safety Administration of the People’s Republic of China. (in Chinese)

[7]
Quanzhou Maritime Safety Administration of the People’s Republic of China. 2014. Quanzhou Prefecture Marine Traffic Safety Bulletin(2013). Quanzhou, China: Quanzhou Maritime Safety Administration of the People’s Republic of China. (in Chinese)

[8]
Quanzhou Maritime Safety Administration of the People’s Republic of China. 2015. Quanzhou Prefecture Marine Traffic Safety Bulletin(2014). Quanzhou, China: Quanzhou Maritime Safety Administration of the People’s Republic of China. (in Chinese)

[9]
Quanzhou Maritime Safety Administration of the People’s Republic of China. 2017. Quanzhou Prefecture Marine Traffic Safety Bulletin (2016). Quanzhou, China: Quanzhou Maritime Safety Administration of the People’s Republic of China. (in Chinese)

[10]
Quanzhou Maritime Safety Administration of the People’s Republic of China. 2018. Quanzhou Prefecture Marine Traffic Safety Bulletin(2017). Quanzhou, China: Quanzhou Maritime Safety Administration of the People’s Republic of China. (in Chinese)

[11]
Quanzhou Maritime Safety Administration of the People’s Republic of China. 2019. Quanzhou Prefecture Marine Traffic Safety Bulletin(2018). Quanzhou, China: Quanzhou Maritime Safety Administration of the People’s Republic of China. (in Chinese)

[12]
Quanzhou Maritime Safety Administration of the People’s Republic of China. 2020. Quanzhou Prefecture Marine Traffic Safety Bulletin(2019). Quanzhou, China: Quanzhou Maritime Safety Administration of the People’s Republic of China. (in Chinese)

[13]
Quanzhou Maritime Safety Administration of the People’s Republic of China. 2021. http://www.fj.msa.gov.cn/fjmsacms/cms/html/qzhsjwwwz/index/457566053.html. Viewed on 2021-09-09. (in Chinese)

[14]
Sun W W. 2006. Preliminary research on general risk assessment of tanker’s oil spill in the sea area of Dalian Xin’gang. Diss., Dalian, China: Dalian Maritime University. (in Chinese)

[15]
Wang J, Pan W R, Zhang G R, et al. 2009. Analysis and risk assessment of the oil spill in Xiamen Bay. Journal of Oceanography in Taiwan Strait, 28(4): 134-138. (in Chinese)

[16]
Zhang S. 2011. Research on the method of calculating the probability of oil spills at sea. Diss., Dalian, China: Dalian Maritime University. (in Chinese)

Outlines

/