Animal Ecology

Variations in Patch Use by Ruminant and Non-ruminant Herbivores in a Tropical Wildlife Reserve, Ghana

  • Godfred BEMPAH , 1 ,
  • Joseph K. AFRIFA 2 ,
  • Moses A. NARTEY 3 ,
  • LU Changhu , 4, *
Expand
  • 1. College of Forestry, Nanjing Forestry University, Nanjing 210037, China
  • 2. Department of Conservation Biology and Entomology, University of Cape Coast, Cape Coast CC-145-8669, Ghana
  • 3. Department of Animal Science, University of Energy and Natural Resources, Sunyani BS-0061-2164, Ghana
  • 4. College of Biology and the Environment, Nanjing Forestry University, Nanjing 210037, China
* LU Changhu, E-mail:

Godfred BEMPAH, E-mail:

Received date: 2021-10-15

  Accepted date: 2022-01-15

  Online published: 2022-06-27

Supported by

The Priority Academic Program Development of Jiangsu Higher Education Institutions, China(2018-87)

Abstract

Food processing and consumption by herbivores are affected differently by the availability of forage quality and quantity per unit of time. This demonstrates the “Allometric response concept”, and it is considered a significant determinant in habitat use for foraging by grazers. The relevance of this approach has comprehensively been applied to herbivores of different body sizes, but little is known about its demonstration to explain patch use in herbivores with different digestive physiology and body size. We explain the use of patches by grazing herbivores of different digestive physiology and body sizes, Hippopotamus amphibius (hippopotamus, mega non-ruminant) and cattle (ruminant), by integrating foraging relationship herbivores. We analysed the significant relationships between species dropping densities and environmental variables across forty-eight 100 m×100 m plots in Bui National Park, Ghana, during the wet and dry seasons. We found that both species utilised areas closer to the river in the wet season, but the H. amphibius foraged further away from the river during the dry season. Sward height also determined patch use by both species, with the H. amphibius utilising shorter swards than the cattle. Considering the quality of food resources, the study revealed that patch selection of ruminants (cattle) was significantly influenced by nitrogen content. In contrast, acidic detergent fibre content was positively related to non-ruminant species (H. amphibius). The high seasonal effect of sward height and food quality on patch use is primarily due to the species digestive physiology and body size of hippopotamus and cattle at the Bui National Park.

Cite this article

Godfred BEMPAH , Joseph K. AFRIFA , Moses A. NARTEY , LU Changhu . Variations in Patch Use by Ruminant and Non-ruminant Herbivores in a Tropical Wildlife Reserve, Ghana[J]. Journal of Resources and Ecology, 2022 , 13(6) : 1143 -1151 . DOI: 10.5814/j.issn.1674-764x.2022.06.018

1 Introduction

The establishment of protected areas such as wildlife reserves remains a core strategy to safeguard and ensure a higher level of biodiversity protection (Bruner et al., 2001; IUCN/PACO, 2010). However, managing wildlife reserves is faced with challenges, including the influx of cattle grazing (Piana and Marsden, 2014) due to poor law enforcement activities (Jachmann, 2008). As a result, grazing resources available to Hippopotamus amphibius (hippopotamus, non-ruminant) is freely utilised by cattle (ruminant) (Stern et al., 2002). Therefore, explaining how species coexist in the landscape is relevant for achieving the objectives of ecological studies to maintain a healthy ecosystem.
The combined effects of ecophysiological factors (including competition, distance to water, amount and quality of food resources) influence how herbivores are distributed within a specified area (Milchunas and Laurenroth, 1993; Redfern et al., 2003). For example, it is predicted that smaller herbivores prefer higher quality foods than larger species because of their higher metabolic requirements. In contrast, larger species are more concerned with food quantity and place less importance on food quality (Laca et al., 2010; Djagoun et al., 2016). Cattle and hippopotamus are grazing herbivores that feed mainly on grasses (herein “sward”) (Bos et al., 2005).
The amount of sward consumed by herbivores of all sizes increases with sward biomass for some time (Laca et al., 2010) even when sward density and quality are negatively related (Illius and Gordon, 1987). This is contrary to observations in the field, where most grazing herbivores prefer sward patches of low biomass even with the availability of patches of high biomass (Langvatn and Hanley, 1993). This indicates that the observed behaviour of grazing herbivores is different from the contemporary allometric theory of patch use. Therefore, it is assumed that variations in distribution patterns of herbivores could be accounted for by differences in species size, foraging behaviour, and digestive system (Wilmshurst et al., 2000). Hence, species that coexist should occupy different ecological niches (Roughgarden and Feldman, 1975), especially when forage resources are limited by seasonality (Deshmukh, 1984). The allometry theory has comprehensively been applied to herbivores of different body sizes, but little is known about its demonstration of patch selection in herbivores with different digestive physiology (e.g. Cromsigt et al., 2009).
The coexistence of ruminant and non-ruminant has become a major issue of scientific deliberation (Hess, 2010). Some scientists believe that species may utilise varying foraging systems because of their different digestive systems (Hess, 2010). For instance, the digestive system of the ruminant enables the processing of more digestible dry matter than non-ruminant. On the contrary, the higher passage rate of non-ruminant digestive system ensures it can process food with high fibre content (Pearson et al., 2006). Furthermore, the caecum is absent in the hippopotamus (non-ruminant); thus, microbe fermentation breakdowns food in the foregut, making the digestive process very slow compared to ruminants (Furstenburg, 2012).
Even though hippopotamus grazes at night, there have been instances where they are observed to feed at day time (Timbuka, 2012; Mekonen and Hailemariam, 2016) and in the same area where cattle also graze (Kanga et al., 2013). This is possible especially when food resources are limited in the grazing area, and the hippopotamus need to search and graze to the next day. To access water, cattle tend to graze near water resources which are resting sites of hippopotamus. When food resources are available, hippopotamus also tend to graze more near river banks in the daytime to achieve their energy requirements and vector nutrients into aquatic ecosystem (Laws and Clough, 1966; Subalusky et al., 2015). This, therefore, suggests that there could be possible competition for resources between hippopotamus and cattle. Again, an adaptation of hippopotamus feeding at night is a possible attempt to avoid heat exposure from the sun because their skin lacks the ability to sweat and avoid dryness (Zubkowicz, 2005). Therefore, in the daytime, when the air temperature is suitable, and heat from the sun is minimal, hippopotamus will graze (Timbuka, 2012; O'Connor and Campbell, 1986).
This study models a trade-off between a non-ruminant (hippopotamus) and domestic ruminant (cattle) species with different body sizes to detect possible patterns in habitat use at Bui National Park (BNP), Ghana. This wildlife reserve is an important area for mammals, especially with the all-season water availability in the Black Volta River (BVR) found in the reserve. The cattle are restricted to the east side of the river, while the hippopotamus can transverse between the east and west of the landscape. The study species are: 1) hippopotamus (H. amphibius)—a non-ruminant (body weight: 1400-2000 kg, bite width of 30-49 cm; Furstenburg, 2012) and 2) Cattle—a ruminant (body weight: approximately 360-750 kg, bite-size: 22.6 cm; Gambo et al., 2015), both utilise the wetlands of the BVR in the BNP. The Bui National Park is a protected wildlife reserve, but the area has witnessed a high influx of nomadic herdsmen with large cattle grazing. In addition, the construction of a hydroelectric dam in the Bui National Park led to the migration of human and livestock settlements, and cattle have adapted to grazing in the area for the past 14 years. The study hypothesises that: 1) Seasonality will influence the use of the grazing area by both species and proximity of grazing to the river; 2) Hippopotamus (non-ruminant mega fauna species) will respond more positively to grazing resource heterogeneity than the cattle (ruminant species); 3) Cattle (ruminant species) will be more sensitive to food nutrients than hippopotamus (non-ruminant species).

2 Methods

2.1 Study area

The study was done within the wetland in the Bui National Park, where the Black Volta River bisects the park into two landscapes. This wildlife reserve is the third-largest in Ghana with an area of about 1821 km² and is located in both the Bono and Savanna regions of Ghana close to the Cote D'Ivoire border (8o10'-8o45'N, 2o05'-2o27'W, Fig. 1). The study area is very important for conservation activities because of its international transboundary significance. The primary objective of the park is to conserve biodiversity and protect the drainage basin of the BVR. As a result of hydroelectric dam construction on the BVR in reserve, water is available all season at the dammed portion of the park. The river's water level decreased in the dry season and is assumed to be the only water source available for mammals. As a result, the park is renowned for its high biological richness. The vegetation of the area is mostly Guinea Savannah woodland with patches of Moist Semi-Deciduous Forest, harbouring several animal species such as the hippopotamus (H. amphibius), olive baboons (Papio Anubis), patas monkey (Erythrocebus patas), and bushbuck (Tragelaphus scriptus, Dery, 2017). The area experiences a relative humidity of about 75% and yearly rainfall of 1140 mm (Appiah et al., 2017).
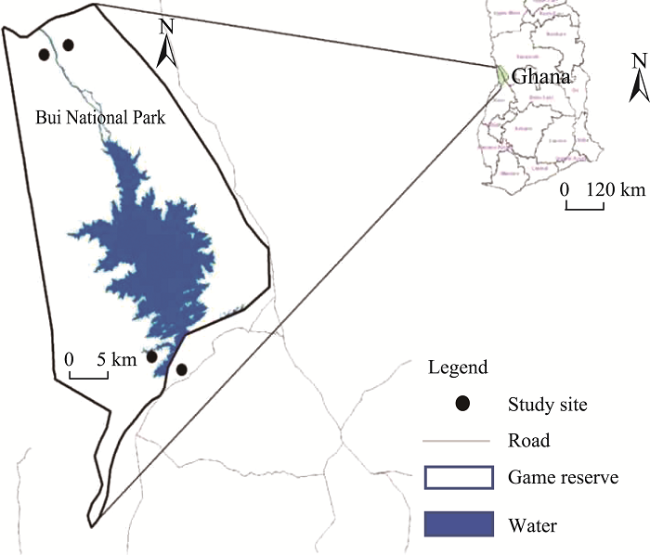
Fig. 1 Map of Bui National Park where the study was conducted

2.2 Data collection

We randomly established 48 plots with 100 m×100 m to collect data on study species droppings and environmental variables every month for six months. We positioned bamboo sticks with ribbons at each edge of the plot to demarcate the surveyed plots for identification which was permanent throughout the study period.

2.2.1 Dropping counts

Sites where cattle and hippopotamus most frequently graze, demarcated as west and east side of the river (Fig. 1), were selected for dropping counts. Animal dropping counts were done monthly during the wet season (August-October) and dry season (January-March). We counted the number of animal droppings in each of the ten 10 m×10 m subplots which were distributed within the 100 m×100 m plots and covered the entire gradient of higher to lower grassland. The amount of grazing by herbivores can be estimated using the animal's dropping density (Piana and Marsden, 2014; Zhang et al., 2016). The texture of droppings of cattle (finer) is observed to be significantly different from hippopotamus, which contains a much higher proportion of culms (Chansa et al., 2011). Through this, a clear difference in dropping per species was established. To avoid double-counting of animal droppings, the dropping was thrown out of the quadrat after each count.

2.2.2 Vegetation samples measurement

We collected vegetation data on sward height, grass biomass, grass groundcover and estimated habitat heterogeneity. Leaf samples were subjected to laboratory analysis to determine amount of nitrogen and acidic detergent fibre content. All these variables were measured concurrently every month for six months.
A total of five sward height measurements were done every month within each of the ten 1 m×1 m quadrat randomly distributed in each of the 10 m×10 m subplots, using a disc sward stick. To prevent pseudo-replication, the mean of the sward height and its standard deviation was calculated (Zhang et al., 2016). The mean uses all the values in the data and so it can be shown to be efficient. Standard deviation gives much indication of the spread of observations about the mean. providing a useful basis for interpreting the data in terms of probability. We estimated habitat heterogeneity by calculating the squared root of the sward height which shows variety in habitat types (Zhang et al., 2016). To estimate biomass, stems and leaves that emerged taken as samples were clipped from three randomly placed 30 m×30 cm quadrats in each of the 100 m×100 m plot. Each clipped sample was weighed (grams) using digital pocket weighing scale (Greater Goods Digital Pocket Scale) and average calculated. Samples were packaged in envelopes and oven dried at 60 ℃ to constant weight and subsequently weighed (dry matter in grams).
Leaf samples were transported to the Soil and crop science laboratory of Kwame Nkrumah University of Science and Technology, Ghana for nutrient analysis of nitrogen and acid detergent fibre content each month. Measurement of herbivores food digestibility could be higher based on Acid detergent fibre content (ADF) (Manseau and Gauthier, 1993). To deal with self-shading effects and ensure plants present are sampled for chemical composition, the 30 cm×30 cm quadrats were rotated each month within the plots.

2.2.3 Measuring plot distance from a water source and cover (%) by ground vegetation

Measurement of vegetation ground cover (percentage of coverage) was done by visual estimation within the same quadrat where sward height was measured (Wilmshurst et al., 2000; Timbuka et al., 2012). The distance of each plot from the river/water was measured using GPS. This was used to give an indication of how close dropping activities are to water sources.

2.3 Statistical analysis

The predictor (environmental) factors (sward height, habitat heterogeneity, distance to water, biomass, groundcover, nitrogen and acidic detergent fibre content) and the response variable (species dropping densities) were initially subjected to the multiple linear regression model to identify any significant link. All the predictor variables were captured as independent variables and then assessed multi-collinearity showed lower collinearity among variables (Table 1); thus, groundcover was removed from the subsequent model. Although ADF and other variables were sometimes correlated, we always included ADF in the multiple regression Despite the collinearity, the regression estimates are highly reliable (Freckleton, 2002; Durant et al., 2004; Gregorich et al., 2021).
Table 1 Pearson correlation coefficients between independent variables
No. Variables HH SH DR GC BM N ADF
1 Habitat heterogeneity (HH) 1 0.54 0.18 0.34 0.43 0.24 0.28
2 Sward height (SH) 0.34 1 0.51 0.44 0.61 0.26 0.29
3 Distance to river (DR) ‒0.15 ‒0.71 1 ‒0.19 0.11 ‒0.27 ‒0.31
4 Groundcover (GC) 0.27 0.95 ‒0.73 1 0.91 0.85 0.95
5 Biomass (BM) 0.26 0.87 ‒0.58 0.89 1 0.76 0.83
6 Nitrogen (N) 0.26 0.71 ‒0.67 0.74 0.56 1 0.83
7 Acidic detergent fibre (ADF) 0.26 0.87 ‒0.74 0.91 0.79 0.66 1
To establish how species respond to the vegetation characteristics, a global model with all explanatory variables was built. The model was dredged and the best model with best AIC was selected. To deal with over-dispersion because of the many zeros in the dropping count data, a zero-inflated negative binomial mixed model (GLMM) was fitted and randomly applied site as the effect source for both wet and dry seasons. Finally, a logistic regression model was fitted with the site as a random factor using both species' presence/absence dung data. The packages MASS, pscl, glmmADMB and lme4 (Venables and Ripley, 2002; Jackman et al., 2007; Bolker et al., 2012; Bates et al., 2015) in statistical program R (R Core Team, 2020) were used to perform statistical analyses. The standard statistical test of significance (α=0.05) was adopted.

3 Results

3.1 Distribution of the species droppings

The number of cattle and hippopotamus droppings was found to differ significantly across the season and the two river sites (F3.572 = 11.48, P < 0.001). The highest mean number of cattle dropping (4.7 ± 0.51, Table 2) was found at the east side in the dry season, while the highest hippopotamus dung number was found at the west side of the river during the dry season, as shown in Table 2. Thus, during the wet season, hippopotamus feeding activities were only concentrated in the west but occasionally utilised the east during the dry season, while cattle were restricted to the east side.
Table 2 Mean number of hippopotamus (hippo) and cattle droppings across sites and seasons
Variables Hippo dung Cattle dung
Mean Std. Error Mean Std. Error
Site West 2.361 0.5092 0.000 0.000
East 0.153 0.066 4.708 0.515
Season Wet 1.000 0.186 1.743 0.238
Dry 1.513 0.205 2.965 0.530

3.2 Functional response

During the wet season, there was a significant negative relationship between sward height and dropping density of hippopotamus but positively related to the dropping density of cattle. A significantly negative relationship between the dropping density of cattle and distance to river was found. (Table 3). The dropping densities of both hippopotamus and cattle significantly decreased with increasing nitrogen content (Table 3). We found a positive relationship between dropping density of hippopotamus and ADF and Biomass but a significant negative relationship between ADF and cattle dropping density. During the dry season, we found a significant negative relationship hippopotamus dropping density and sward height and nitrogen but a significant positive relationship with ADF. There was a significant positive relationship between cattle dropping density and sward height and nitrogen but a significant negative relationship with distance to water. Distance to river positively related with dropping density of hippopotamus.
Table 3 Linear regression model between dropping densities of cattle and hippopotamus and environmental variables
Season Variable Cattle Hippo
β Radj2 P β Radj2 P
Wet season Habitat heterogeneity 0.000 0.299 0.765 ‒0.000 ‒0.341 0.733
Sward height (cm) 0.000 2.125 0.035 ‒0.000 ‒3.726 0.000
Distance to river (m) ‒0.000 ‒7.459 0.000 0.000 0.264 0.792
Nitrogen (%) ‒0.000 ‒1.297 0.196 ‒0.000 ‒3.632 0.000
Biomass (g m-2) 0.000 3.336 0.001 0.000 4.445 0.000
ADF (%) ‒0.000 ‒5.363 0.000 0.000 11.002 0.000
Dry season Habitat heterogeneity ‒0.000 ‒1.485 0.139 0.000 0.449 0.654
Sward height (cm) 0.000 2.324 0.022 ‒0.000 ‒5.287 0.000
Distance to river (m) ‒0.000 ‒2.897 0.004 0.000 ‒0.467 0.641
Nitrogen (%) 0.001 8.620 0.000 ‒0.000 ‒2.987 0.003
Biomass (g m2) ‒0.000 ‒4.183 0.000 ‒0.000 ‒0.983 0.327
ADF (%) ‒0.000 ‒1.945 0.054 0.000 7.315 0.000

3.3 Zero-inflated negative binomial GLMM

The final model (Table 4) showed that sward height was negatively related to dropping densities of both hippopotamus and cattle in the wet season but during the dry season, there was a positive significant relationship between cattle dropping density and sward height. During the dry season distance to river significantly had a positive relationship with the dropping density of hippopotamus but a significant negative relationship during the wet season (Table 4). Biomass and nitrogen were positively related to the dropping density of cattle during the wet season. In the dry season, ADF was positively related to hippopotamus dropping density (Table 4).
Table 4 Final generalised linear mixed model for hippopotamus and cattle dropping densities as a function of measured explanatory variables
Dry season Wet season
Species Variables Value SE z P Value SE z P
Cattle ADF (%) 0.221 0.064 3.457 0.001
Biomass (g m-2) 0.037 0.016 2.253 0.024
Nitrogen (%) 1.198 0.177 6.750 0.000
Sward height (cm) 0.255 0.085 2.983 0.003 ‒0.043 0.009 ‒4.633 0.000
Hippos ADF (%) 0.024 0.006 3.810 0.000
Distance to river (m) 0.002 0.001 ‒2.802 0.005 ‒0.004 0.001 ‒4.848 0.000
Nitrogen (%) 0.280 0.183 1.529 0.126
Sward height (cm) ‒0.107 0.022 ‒4.805 0.000

3.4 Logistic regression model

Similar to the results of the zero-inflated model, the logistic regression model (Table 5) showed a significant negative relationship between hippopotamus dropping density and sward height during the dry season, and a significant position relationship with biomass. During the wet season, the dropping density of hippopotamus increased with increasing ADF. During both wet and dry seasons, we found a significantly positive relationship between the dropping density of cattle and nitrogen, and an increased dropping density of cattle with decreasing distance to river (Table 5).
Table 5 Final mixed logistic regression model for relationships between cattle and hippopotamus dropping densities as a function of measured explanatory variables
Dry season Wet season
Species Variables Estimate SE z P Estimate SE z P
Cattle Distance to river (m) ‒0.017 0.004 ‒3.897 0.000 ‒0.009 0.006 ‒1.719 0.086
Nitrogen (%) 1.285 0.429 2.993 0.003 2.615 1.221 2.141 0.032
Habitat heterogeneity ‒0.021 7.085 ‒0.003 0.998
Hippos ADF 0.221 0.064 3.457 0.000
Biomass (g m-2) 0.235 0.054 4.344 0.000
Sward height (cm) ‒0.569 0.156 ‒3.656 0.000

4 Discussion

This study shows that H. amphibius (hippopotamus) avoid grazing patches used by cattle, though both are found in the area. More hippopotamus droppings were found on the west side than on the east. Seasonality influenced grazing areas as hippopotamus grazed further away from the river shore and cattle grazed closer to the river during the dry season than the wet season. We observed that hippopotamus selected areas with shorter grasses. This is shown in the predicted change in the dependent variable per unit change in the independent variable. Finally, we found that forage nutrient quality influenced site use as hippopotamus grazed more on swards with a high amount of Acidic detergent fibre (ADF) and cattle selected sward with high nitrogen content.
Feeding competition with cattle along the wetland (Reid et al., 2003) could have probably caused hippopotamus to restrict their feeding activities to the west of the landscape. Even though hippopotamus grazes at night, there have been instances where they are observed to feed at day time (Timbuka, 2012; Mekonen and Hailemariam, 2016) and in the same area where cattle also graze (Kanga et al., 2013). This is possible especially when food resources are limited in the grazing area, and the hippopotamus need to search and graze to the next day especially when the atmosphere is cloudy or at low temperature (Mekonen and Hailemariam, 2016). Competition is an important factor in regulating the coexistence of species; besides, non-competitive processes can function to regulate this species coexistence. This is evident in our study results, suggesting that environmental factors may account for selecting patches for foraging by mammalian herbivores with a significant concentration during the dry than the wet season. This implies that grazing herbivores extensively utilise forage and water during the dry season in Bui National Park.
The results of our study suggest a significantly negative relationship between sward height and dropping density of hippopotamus in both the wet and dry seasons. In addition, both the Linear regression and generalised linear mixed models indicated a positive relationship between distance to water and hippopotamus dropping density in the dry season and all models showed a significant negative relationship between distance to river and cattle dropping density in the dry season. In this regard, the results between models revealed seasonal dynamics in the differences between the species and environmental factors.
The models suggest a positive relationship between ADF content and hippopotamus, but not cattle. Furthermore, biomass showed similar relationship with both hippopotamus and cattle dropping densities in the both seasons shown in the linear regression model. However, the mixed logistic regression model showed a significant positive relationship between biomass and hippopotamus dropping density during the dry season, while the generalised linear mixed model showed a significant positive relationship between biomass and cattle dropping density during the wet season Both models suggest nitrogen was positively correlated with cattle droppings but not hippopotamus droppings in both seasons. Neither of the models found a relationship between habitat heterogeneity and hippopotamus or cattle dropping densities in both seasons.
The observed negative relationship between sward height and species dropping densities was more pronounced for hippopotamus. The slopes suggest that hippopotamus utilise shorter grass even though cattle are sensitive to sward height (de Vries and Daleboudt, 1994). This result is consistent with other studies (Timbuka, 2012; Kanga et al., 2013). The hippopotamus use of patches with shorter swards is primarily attributed to its morphology (Timbuka, 2012). The hippopotamus teeth (canine and incisors) are different from other grazers as they are not designed for effective chopping and grinding (Spinage, 2012). Therefore, intake is constrained when the sward is tall (Timbuka, 2012). When feeding, the hippopotamus lowers the head on vegetation and cut and pull off the sward using a sharp tongue and lips (Spinage, 2012). This study observed that areas of shorter sward height had the highest dropping densities of the species, suggesting that sward height was the paramount factor influencing mammalian grazer patch use in the research area.
Distance to water is negatively related to cattle dropping density in both seasons, but negatively related to hippopotamus during the wet season This suggests that cattle select feeding patches close to water in both seasons and hippopotamus select feeding patches closer to the edge of the water in the wet season, which collaborates with previous research findings (O'Connor and Campbell, 1986). Furthermore, the short and high-quality sward near water partially fulfils the foraging theory for hippopotamus (Lewison and Carter, 2004). This contributes to the marginal value theorem (Charnov, 1976). Thus, the hippopotamus maximises energy by concentrating foraging activities closer to water which becomes the most effective feeding site. Moreover, both species feed on short swards with more digestible biomass and therefore provide them more net energy, in line with the forage maturation hypothesis (Fryxell, 1991).
Hippopotamus droppings were farther away from the river during the dry season. At this period, grazing resources become less available, with reduced biomass and low quality (Manteca and Smith, 1994). The hippopotamus, therefore, adopts the foraging decision to move further away from the water edge, which experiences severe pressure to contain all animals during the dry season (O'Connor and Campbell, 1986). Besides, the constraint of the limited sward is evident by hippopotamus browsing on climbers in the dry season. However, it is not known the reason behind the hippopotamus decision to feed on browses; whether it was influenced by less sward availability or nutrition-appeal to the browse at a specific attractive growth stage. Cattle dropping density was more restricted to patches near the water during the dry season. Indicating a more homogeneous distribution of droppings in the east than the west of the landscape is explained by access to water points because water is not available during the dry season except that of the river.
The feeding ecology of grazers is centred mostly on nutrition quality (Parker et al., 2009). Several studies report that nitrogen content influences the utilisation of an area by herbivores (Durant et al., 2004). In this study, both models suggest nitrogen was positively correlated with cattle droppings but not hippopotamus droppings in the wet season. Cattle (ruminant grazers) prefer short swards with high nitrogen, confirming the “Foliage Maturation Hypothesis”. A similar relationship has been reported at the Serengeti and Mole National Parks for other grazing mammals (Fryxell et al., 2004; Dakwa, 2020). However, moist grasslands experience declines in nitrogen mineralisation rate due to trampling by larger mammals and subsequently leads to low content of nutrients in plants (Schrama et al., 2013). This could explain the low nitrogen content in hippopotamus patches, while hippopotamus is far larger than cattle, almost twice the size of cattle.
Acidic Detergent Fibre content, however, was positively related to hippopotamus, but no relationship with cattle was observed. The digestibility of many nutrients reduces with an increase in crude fibre content. This possibly explains the preference of hippopotamus for swards with high ADF. Forages consumed by non-ruminants mostly have low nitrogen but high fibre content (Pearson et al., 2001). In ruminants, digestion of plants with higher content of Fibre is very slow and retained for a longer period compared to plants with high quality (Hess, 2010). However, this digestive process is different in non-ruminants, where passage time increases marginally with plant fibrousness. Non-ruminants, the hippopotamus, ingest relatively plants of higher fibre contents than ruminants (Hess, 2010). Non-ruminants possess a gastrointestinal tract that is less effective than the rumen, but its digestive process through fermentation is greatly appropriate for swards of high biomass (Spinage, 2012). This possibly explains the positive relationship between hippopotamus and sward biomass.
In this study, there was no relationship between habitat heterogeneity and dropping densities of species. Grazing herbivores are receptive to sward heterogeneity (Fryxell et al., 2005). However, all large grazing herbivores utilise different bite sizes and therefore exhibit various feeding responses on different swards heights. This perhaps indicates the constraints of their mandibular morphology and likely to feed unselectively in short mixed swards, as confirmed by de Vries and Daleboudt (1994). Kanga et al. (2013) suggested that hippopotamus maintain spatial sward heterogeneity while livestock such as cattle create homogenous landscapes, thereby driving away other wild grazers. This, therefore, could explain the hippopotamus avoidance of the east side of the landscape, which is intensively grazed by cattle. That notwithstanding, it is difficult to explain the no significant relationship between a hippopotamus and habitat heterogeneity.
The results of this study reveal that non-ruminants and ruminants exhibit high receptivity to the height of sward and the distance to water relative to seasonal variation, thus influencing patch use by different species. The non-ruminant, the hippopotamus, was found closer to the water with short sward areas than the cattle in the wet season but further away in the dry season while cattle were closer to water. A higher population of larger-sized species are mostly found in areas with relatively higher biomass (Durant et al., 2004). This explains why hippopotamus patches have higher ADF content and biomass than cattle. This result also suggests that patches with relatively higher nitrogen were used by cattle, suggesting forage quality is important to ruminants (de Vries and Daleboudt, 1994).
In an area where species coexist, grazers usually utilise the same food items. The wetland of the Black Volta River in Bui National Park serves as one of the few habitats that harbour the remaining hippopotamus population in Ghana. There is a high influx of cattle to graze and use water in the wetland during the dry season. Assumed competition among species had a limited impact on the spatial distribution of both species because they potentially utilise the same food resource, which varies in their spatial distribution. Seasonal variations in environmental resources influence the spatial pattern of food resources and subsequently affect forage resource availability (Senft et al., 1987; Bailey et al., 1996; Clausen, 2000; Wood et al., 2019). Grazers with the varying digestive system could use different feeding strategies to compensate for their foraging requirements (Hess, 2010). It is possible to state that morphological and physiological traits of both species influenced the use of sites to forage.

5 Conclusions

Rains are highly seasonal in the study area, and seasonality highly affects forage quality, quantity, and water availability. It can be concluded from this study that sward height is a very important factor influencing patch selection by hippopotamus in the Bui National Park. Moreover, forage digestibility which highly affects digestion is also strongly influenced by patch selection by ruminants and non-ruminants. Cattle (ruminant) select areas with high nitrogen content, while hippopotamus (non-ruminant) select high fibre rich areas. Areas with short sward height provide both species with the net energy required for their daily activities, which helps deal with the feeding constrained because of their morphology. Therefore, the riparian area in rangelands serves as a critical interface between the aquatic and terrestrial environment as a management area for herbivores to enhance ecosystem functioning, especially for the hippopotamus.

Acknowledgements

We would like to extend our sincere thanks to the management and staff of Bui National Park for providing field assistance during this study.
[1]
Appiah D O, Sarfo M, Famieh B, et al. 2017. Environmental and socioeconomic perturbations of a dam project on catchment communities, Ghana. Global Environmental Health and Safety, 1: 1-9.

[2]
Bailey D W, Gross J E, Laca E A, et al. 1996. Mechanisms that result in large herbivore grazing distribution patterns. Journal of Range Management, 49(5): 386-400.

DOI

[3]
Bates D, Mächler M, Bolker B M, et al. 2015. Fitting linear mixed-effects models Usinglme4. Journal of Statistical Software, 67(1): 1-48.

[4]
Bos D, Drent R H, Rubinigg M, et al. 2005. The relative importance of food biomass and quality for patch and habitat choice in Brent Geese Branta bernicla. Ardea, 93(1): 5-16.

[5]
Bruner A G, Gullison R E, Rice R E, et al. 2001. Effectiveness of parks in protecting tropical biodiversity. Science, 291(5501): 125-128.

PMID

[6]
Chansa W, Senzota R, Chabwela H, et al. 2011. The influence of grass biomass production on hippopotamus population density distribution along the Luangwa River in Zambia. Journal of Ecology and the Natural Environment, 3(5): 186-194.

[7]
Charnov E L. 1976. Optimal foraging, the marginal value theorem. Theoretical Population Biology, 9(2): 129-136.

PMID

[8]
Clausen P. 2000. Modelling water level influence on habitat choice and food availability for Zostera feeding Brent Geese Branta bernicla in non-tidal areas. Wildlife Biology, 6(2): 75-87.

DOI

[9]
Cromsigt J P, van Rensburg S J, Etienne R S, et al. 2009. Monitoring large herbivore diversity at different scales: Comparing direct and indirect methods. Biodiversity and Conservation, 18(5): 1219-1231.

DOI

[10]
Dakwa K B, Cuthill I C, Harris S. 2020. Seasonal variation in the selection and use of habitats by large herbivores at mole National Park, Ghana. West African Journal of Applied Ecology, 28(2): 132-139.

[11]
de Vries M F W, Daleboudt C. 1994. Foraging strategy of cattle in patchy grassland. Oecologia, 100(1): 98-106.

[12]
Dery P K. 2017. Post inundation effects of Bui Hydro Electric Dam on the large mammals in the Bui National Park in the Brong Ahafo Region of Ghana. Diss., Sunyani, Ghana: Kwame Nkrumah University of Science and Technology,

[13]
Deshmukh I K. 1984. A common relationship between precipitation and grassland peak biomass for east and southern Africa. African Journal of Ecology, 22(3): 181-186.

DOI

[14]
Djagoun C A M S, Codron D, Sealy J, et al. 2016. Isotopic niche structure of a mammalian herbivore assemblage from a West African savanna: Body mass and seasonality effect. Mammalian Biology, 81(6): 644-650

DOI

[15]
Durant D, Fritz H, Duncan P. 2004. Feeding patch selection by herbivorous Anatidae: The influence of body size, and of plant quantity and quality. Journal of Avian Biology, 35(2): 144-152.

DOI

[16]
Freckleton R P. 2002. On the misuse of residuals in ecology: Regression of residuals vs. multiple regression. Journal of Animal Ecology, 71(3): 542-545.

DOI

[17]
Fryxell J M, Wilmshurst J F, Sinclair A R. 2004. Predictive models of movement by Serengeti grazers. Ecology, 85(9): 2429-2435.

DOI

[18]
Fryxell J M, Wilmshurst J F, Sinclair A R, et al. 2005. Landscape scale, heterogeneity, and the viability of Serengeti grazers. Ecology Letters, 8(3): 328-335.

DOI

[19]
Fryxell J M. 1991. Forage quality and aggregation by large herbivores. The American Naturalist, 138(2): 478-498.

DOI

[20]
Gambo B G, Yahaya A, Girgiri I, et al. 2015. Morphometric studies of the mandibular and maxillofacial regions of the Kuri cattle and the implications in regional anaesthesia. Folia Morphologica, 74(2): 183-187.

DOI PMID

[21]
Gregorich M, Strohmaier S, Dunkler D, et al. 2021. Regression with highly correlated predictors: Variable omission is not the solution. International Journal of Environmental Research and Public Health, 18(8): 4259. DOI: 10.3390/ijerph18084259.

DOI

[22]
Hess T. 2010. Nutrient metabolism of non-ruminants in rangeland systems. Range and Animal Sciences and Resources Management, 2: 48. http://www.eolss.net/sample-chapters/c10/e5-35-15.pdf.

[23]
Illius A W, Gordon I J. 1987. The allometry of food intake in grazing ruminants. The Journal of Animal Ecology, 56(3): 989-999.

DOI

[24]
IUCN/PACO. 2010. Parks and reserves of Ghana: Management effectiveness assessment of protected areas. Ouagadougou, Burkina Faso: UICN/PACO. https://portals.iucn.org/library/sites/library/files/documents/2010-073.pdf.

[25]
Jachmann H. 2008. Monitoring law-enforcement performance in nine protected areas in Ghana. Biological Conservation, 141(1): 89-99.

DOI

[26]
Jackman S, Fearon J, Jackman M S. 2007. MCMCpack, S. The PSCL package. Soware. http://cran.rproject.org/src/contrib/Descriptions/pscl.html.

[27]
Kanga E M, Ogutu J O, Piepho H P, et al. 2013. Hippopotamus and livestock grazing: Influences on riparian vegetation and facilitation of other herbivores in the Mara Region of Kenya. Landscape and Ecological Engineering, 9(1): 47-58.

DOI

[28]
Laca E A, Sokolow S, Galli J R, et al. 2010. Allometry and spatial scales of foraging in mammalian herbivores. Ecology Letters, 13(3): 311-320.

DOI PMID

[29]
Langvatn R, Hanley T A. 1993. Feeding-patch choice by red deer in relation to foraging efficiency. Oecologia, 95(2): 164-170.

DOI PMID

[30]
Laws R M, Clough G. 1966. Observation of reproduction in the Hippopotamus (Hippopotamus amphibius). Symposium of the Zoological Society of London, 15: 117140.

[31]
Lewison R L, Carter J. 2004. Exploring behavior of an unusual megaherbivore: A spatially explicit foraging model of the hippopotamus. Ecological Modelling, 171(1-2): 127-138.

DOI

[32]
Manseau M, Gauthier G. 1993. Interactions between greater snow geese and their rearing habitat. Ecology, 74(7): 2045-2055.

DOI

[33]
Manteca X, Smith A J. 1994. Effects of poor forage conditions on the behaviour of grazing ruminants. Tropical Animal Health and Production, 26(3): 129-138.

PMID

[34]
Mekonen S, Hailemariam B. 2016. Ecological behaviour of common Hippopotamus (Hippopotamus amphibius, LINNAEUS, 1758) in Boye Wetland, Jimma, Ethiopia. American Journal of Scientific and Industrial Research, 7(2): 41-9.

[35]
Milchunas D G, Lauenroth W K. 1993. Quantitative effects of grazing on vegetation and soils over a global range of environments: Ecological Archives M063-001. Ecological Monographs, 63(4): 327-366.

DOI

[36]
O'Connor T G, Campbell B M. 1986. Hippopotamus habitat relationships on the Lundi River, Gonarezhou National Park, Zimbabwe. African Journal of Ecology, 24(1): 7-26.

DOI

[37]
Parker K L, Barboza P S, Gillingham M P. 2009. Nutrition integrates environmental responses of ungulates. Functional Ecology, 23(1): 57-69.

DOI

[38]
Pearson R A, Archibald R F, Muirhead R H. 2001. The effect of forage quality and level of feeding on digestibility and gastrointestinal transit time of oat straw and alfalfa given to ponies and donkeys. British Journal of Nutrition, 85(5): 599-606.

PMID

[39]
Pearson R A, Archibald R F, Muirhead R H. 2006. A comparison of the effect of forage type and level of feeding on the digestibility and gastrointestinal mean retention time of dry forages given to cattle, sheep, ponies and donkeys. British Journal of Nutrition, 95(1): 88-98.

PMID

[40]
Piana R P, Marsden S J. 2014. Impacts of cattle grazing on forest structure and raptor distribution within a neotropical protected area. Biodiversity and Conservation, 23(3): 559-572.

DOI

[41]
Redfern J V, Grant R, Biggs H, et al. 2003. Surface-water constraints on herbivore foraging in the Kruger National Park, South Africa. Ecology, 84(8): 2092-2107.

DOI

[42]
Reid R S, Rainy M, Ogutu J, et al. 2003. People, wildlife and livestock in the Mara ecosystem: The Mara count 2002. International Livestock Research Institute, Nairobi, Kenya. http://www.maasaimaracount.org/reports/Maracount.pdf.

[43]
Roughgarden J, Feldman M. 1975. Species packing and predation pressure. Ecology, 56(2): 489-492.

DOI

[44]
Schrama M, Heijning P, Bakker J P, et al. 2013. Herbivore trampling as an alternative pathway for explaining differences in nitrogen mineralisation in moist grasslands. Oecologia, 172(1): 231-243.

DOI

[45]
Senft R L, Coughenour M B D, Bailey W, et al. 1987. Large herbivore foraging and ecological hierarchies. BioScience, 37(11): 789-799.

DOI

[46]
Spinage C A. 2012. African ecology: Benchmarks and historical perspectives. Springer. DOI: 10.1007/978-3-642-22872-8.

DOI

[47]
Stern M, Quesada M, Stoner K E. 2002. Changes in composition and structure of a tropical dry forest following intermittent cattle grazing. Revista de Biología Tropical, 50(3-4): 1021-1034.

[48]
Subalusky A L, Dutton C L, Rosi-Marshall E J, et al. 2015. The hippopotamus conveyor belt: Vectors of carbon and nutrients from terrestrial grasslands to aquatic systems in sub-Saharan Africa. Freshwater Biology, 60(3): 512-525.

DOI

[49]
Timbuka C. 2012. The ecology and behaviour of the common hippopotamus, hippopotamus amphibius L. in Katavi National Park, Tanzania: Responses to Varying Water Resources. Diss., Norwich, UK: University of East Anglia.

[50]
Venables W N, Ripley B D. 2002. Modern applied statistics with S. Fourth edition. New York, USA: Springer.

[51]
Wilmshurst J F, Fryxell J M, Bergman C M. 2000. The allometry of patch selection in ruminants. Proceedings of the Royal Society of London. Series B: Biological Sciences, 267(1441): 345-349.

DOI

[52]
Wood K A, Hilton G M, Newth J L, et al. 2019. Seasonal variation in energy gain explains patterns of resource use by avian herbivores in an agricultural landscape: Insights from a mechanistic model. Ecological Modelling, 409: 108762. DOI: 10.1016/j.ecolmodel.2019.108762.

DOI

[53]
Zhang Y, Prins H H, Cao L, et al. 2016. Variation in elevation and sward height facilitate coexistence of goose species through allometric responses in wetlands. Waterbirds, 39(1): 34-44.

DOI

[54]
Zubkowicz R. 2005. Selected problems of organizing exhibition areas for common Hippopotamus (Hippopotamus amphibius) Zoological data, Annals of Warsaw Agriculture University - SGGW. Horticulture, 26: 211-218.

Outlines

/