Ice and Snow Tourism Impact Assessment

Reconsidering the Suitability Assessment Method for Glacier Tourism: A Case Study from Tibet, China

  • YU Hu , 1 ,
  • XU Linlin 1, 2 ,
  • LIU Limin , 3, *
Expand
  • 1. Institute of Geographic Sciences and Natural Resources Research, Key Laboratory Regional Sustainable Development Analysis and Simulation, Chinese Academy of Sciences, Beijing 100101, China
  • 2. College of Resources and Environment, University of Chinese Academy of Sciences, Beijing 100049, China
  • 3. School of Management, China Women’s University, Beijing 100101, China
*LIU Limin, E-mail:

YU Hu, E-mail:

Received date: 2021-10-22

  Accepted date: 2022-01-28

  Online published: 2022-06-07

Abstract

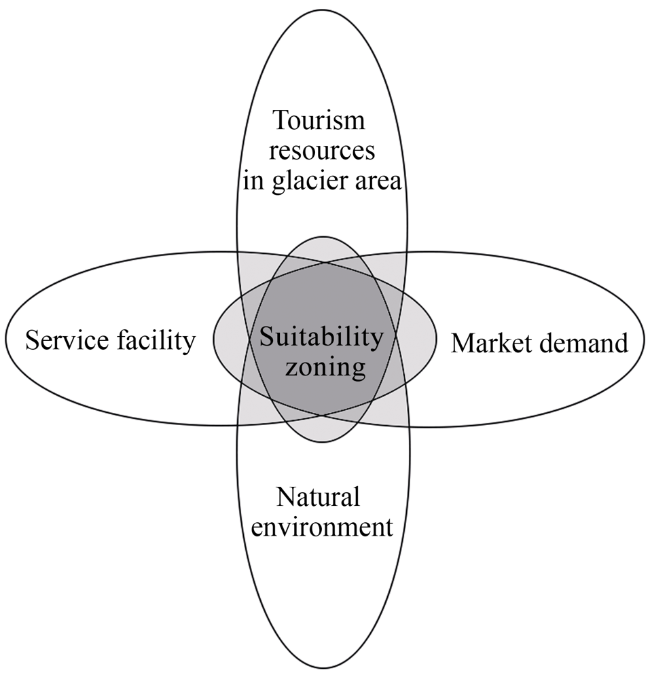
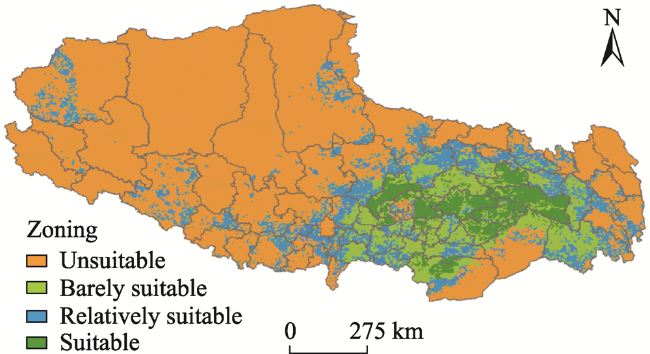
Glacier retreat is becoming more widespread and severe due to global warming, and improper exploitation of glacier resources by tourism activities accelerates the destruction of glacier landscapes. Therefore, establishing a set of quantitative assessment tools is critical for guiding the rational utilization of glacier tourism resources. This study selected regional tourism resources, the natural environment of glaciers, service support, and market demand factors to build a suitability assessment method for glacier tourism (SAMGT), and it used the Delphi and Analytic Hierarchy Process (AHP) to determine the index weights, and combined them with GIS analysis technology. The Tibet autonomous region was proposed in this study as a case to build the SAMGT and provide scientific support for the rational development, scientific management, and sustainable development of glacier tourism resources. With regard to influencing the suitability of glacier tourism resource development, the results indicate that the weights of glacier resource endowment, ecological vulnerability, and tourism resource combination were high whereas that of market demand-related factors was low. The glacier tourism resource development area in Tibet can be divided into suitable, relatively suitable, barely suitable, and unsuitable exploitation zones, accounting for 5.39%, 9.76%, 15.28%, and 69.57% of the total area, respectively. Five representative glaciers were selected to verify the validity or test the rationality of SAMGT and prove that the model is reasonable, innovative, and effective from the perspectives of multiple dimensions and the comprehensiveness of the selected indicators.

Cite this article

YU Hu , XU Linlin , LIU Limin . Reconsidering the Suitability Assessment Method for Glacier Tourism: A Case Study from Tibet, China[J]. Journal of Resources and Ecology, 2022 , 13(4) : 687 -696 . DOI: 10.5814/j.issn.1674-764x.2022.04.014

1 Introduction

Glaciers are persistent bodies of dense ice that are constantly moving under its own weight (Reynolds, 1992), and they are an important natural landscape and tourism attraction in the middle- and low-latitude alpine zones. Glacier tourism development has the dual value of environmental education and socioeconomic benefits, injecting a new impetus into regional sustainable development. However, as global temperatures escalate, glacier retreat has become incontrovertible (Stewart et al., 2016). China has abundant and diverse glacier tourism resources, with 48571 glaciers covering an area of 5.18×10⁴ km2 (Liu et al., 2015), and it has the largest number and scale of glaciers in the middle and low latitudes. However, China’s glacier areas are located at high altitudes, and the natural environment of the plateau is harsh, with strong vulnerability and sensitivity. Due to the lack of consideration for the ecological environment, some tourism projects have developed indiscriminately in the glacier-rich areas, and the building of tourism service facilities resulted in the degradation of the glacier tourism resources, landscape, and ecological environment. Therefore, it is necessary to systematically and comprehensively consider the suitability of glacier tourism development and to examine spatial control measures and development and utilization patterns based on suitability identification.
Several studies have focused on the development and management of glacier tourism (Wang et al., 2012; Capps, 2017), development effects (Espiner and Becken, 2014), impacts of climate change (Cannone et al., 2008), and climate change perception and response measures (Garavaglia et al., 2012). However, few studies have evaluated glacier tourism development conditions, and only Zhou and Zhu (2004) used the framework of “three values, three benefits, and six systems” to evaluate the glacier tourism resources along the Qinghai-Tibet Railway. Various scholars have also evaluated the development potential of glacier tourism in China, but the evaluation indicators they used are relatively inadequate. For example, Wang and Zhao (2011) used quantitative methods to comprehensively evaluate the development potential of glacier tourism in 32 cities in China and demarcated functional zones. However, the natural environmental conditions of glaciers were not considered in the evaluation model, and the restrictive effect of the relatively harsh and fragile ecological environment on tourism activities was ignored. Recently, Wang et al. (2020) improved the evaluation model by adding natural environmental variables, including the environmental conditions of the glacier destination and the risk of glacier hazards. All the studies above are based on the administrative-district level, resulting in assessment results that may not truly reflect the more general suitability of glacier tourism.
This study re-examines the suitability evaluation method for glacier tourism utilization and aims to establish an index system and develop a model for suitability evaluation of glacier tourism resource exploitation, using Tibet as an example to carry out empirical research. The findings of this study are expected to provide theoretical guidance for the sustainable development of glacier tourism resources.

2 Literature review

2.1 Glacier tourism

Since the successful commercial operation of glacier tourism began in Switzerland in the 19th century, different regions and different types of glaciers throughout the world have attracted the attention of researchers. However, there are few studies on the definition of glacier tourism. Due to the different academic backgrounds of researchers, the theoretical interpretation of glacier tourism varies greatly, emphasizing either the glacier resources (Liu, 2006) or the activities and tourist experience (Furunes and Mykletun, 2012), which is mainly due to different perspectives and different meanings. From the perspective of glacier resources, Liu et al. (2006) considered that glacier tourism “requires scarce and fragile resources (such as glaciers, ice sheets), high concentration of activities, scientific connotation, and multi-functional values of entertainment, aesthetics and science”. Furunes and Mykletun (2012) focus on the experience of glacier tourism, arguing that glacier tourism is a combination of natural tourism and adventure tourism, a unique experience gained by tourists walking and climbing in glacier areas, and a process of seeking different degrees of challenges in unfamiliar and potentially dangerous environments. Based on the above characteristics, this paper defines glacier tourism as “a natural tourism form of adventure and significant environmental protection education, with glaciers and the surrounding natural landscape as the main attraction”.

2.2 Glacier tourism resources

Glacier tourism resources represented by modern glaciers and glacier relic resources are the core attractions of glacier tourism (Wu and Shen, 2007). Wang et al. (2012) believed that glacier tourism resources include various modern glaciers, glacier relics, and other factors, such as the aesthetic and cultural characteristics of glaciers. Combined with the defined concept of glacier tourism, this paper argues that glacier tourism resources, comprising the natural ice bodies, can be used to develop tourism activities collectively—i.e., the glacier coalescing to form large-scale landscapes, including ice caves, ice waterfalls, and glacial lake resources such as monomers and monomer concentration areas—to promote regional tourism resource development. Glacier tourism resources not only have tourist value functions, such as sightseeing and experience, but they also have multiple values, such as science, culture, education, tourism, and ecology.

2.3 Glacier tourism suitability assessment

The suitability assessment of tourism resource development is based on the overall assessment of tourism resources and their environment to determine whether a specific region is suitable for carrying out tourism activities and guiding the spatial layout and functional zoning of tourism development (Zhong et al., 2002). The indicators of the mainstream evaluation model can be divided into three categories: 1) tourism resource factor value, including tourism resource type, density, resource development status, and relationship with surrounding tourism areas (Rahayuningsih et al., 2016; Yan et al., 2017); 2) the natural environment of resource development, including the tourism climate index, air quality, ecological vulnerability, and environmental carrying capacity indices established based on the features of the ecological natural environment, such as topography, slope aspect, geological lithology, vegetation coverage, soil environment, and hydrological system (Dhami et al., 2017; Fitchett et al., 2017); and 3) social conditions of resource development, i.e., indicators of social and economic development conditions that play an important role in tourism development, including economic location, economic income, accessibility, and market size (Tsaur and Wang, 2007; Bunruamkaew and Murayam, 2011). The above indicators are also commonly used in research on glacier tourism suitability assessment. For instance, Wang et al. (2020) proposed a spatial assessment system with the key factors of resources and environmental potential, infrastructure and development level, and socio-economic conditions.

3 Methods and materials

3.1 Study area

The Tibet Autonomous Region is located in the southwest of the Qinghai-Tibet Plateau (26°50'‒36°53'N, 78°25'‒ 99°06'E). The administrative region covers a total area of 1.2284×10⁶ km2 and has jurisdiction over five cities, two regions, and 74 counties (districts), with a resident population of 3.176 million. Tibet has the largest glacier area in China. There are 21872 glaciers, covering an area of 23795.41 km2 and accounting for 45.94% of China’s total glacier area. The study area was selected because of the well-established glacier tourism areas in Tibet, such as the Midui Glacier, Laigu Glacier, and Daba Glacier.

3.2 Methods

3.2.1 Evaluation indicator system

The factors influencing glacier tourism resource exploitation can be classified into the following four dimensions: 1) Tourism resources in glacier areas, 2) Natural environment, 3) Service facilities, and 4) Tourism market demand (Fig. 1), drawing on relevant research studies. Furthermore, the indexes that are closely related to the development of glacier tourism resources were selected, and the model was modified according to the feedback of experts. A suitability assessment method for glacier tourism (SAMGT) was proposed and included four targets, 10 criteria, and 25 indicators (Table 1).
Fig. 1 Model map of the factors affecting the glacier tourism resource exploitation
Table 1 Initial index system for glacier tourism resource exploitation suitability
Target Criterion Index Index classification
Tourism resources in glacier region (A1) Glacier resource endowment (B1) Glacier scale (C1, %) 0-1.0 1.0-2.0 2.0-4.0 4.0-12.0 12.0-22.6
Glacier popularity (C2) 1 2 3 4 5
Glacier aesthetic value (C3, %) 84.7-91.5 91.6-96.8 96.9-98.5 98.6-99.5 99.6-100
Grade of resources in glacier area (C4) 1 2 3 4 5
Combination Degree of tourism resources (B2) Density (C5) 1 2 3 4 5
Diversity (C6) 1 2 3 4 5
Glacial natural environment (A2) Ecological vulnerability (B3) Vegetation coverage (C7) <0.254 0.254-0.348 0.348-0.538 0.538-0.823 >0.823
Surface cutting depth (C8, m) >800 500-800 250-500 100-250 <100
Slope (C9, °) 49-70 30-49 18-30 5-18 0-5
Dryness (C10) ≥3.5 2.0-3.5 1.5-2.0 1.0-1.5 ≤1.0
Tourism safety (B4) Geological hazard (C11) Extremely high High Middle Low Non-occurring
Altitude (C12, m) >6000 5000-6000 4000-5000 3000-4000 <3000
Climate suitability (B5) Temperature-humidity index (C13) 11-12 12-13 13-14 14-16 16-18
Wind-chill index (C14) <-550 -550- -500 -500- -400 -400- -300 -300- -230
Service facilities (A3) Traffic conditions (B6) The distance from the main road (C15, km) >40 30-40 20-30 10-20 <10
Road density (C16, km/km2) 0.002-0.015 0.015-0.037 0.037-0.053 0.053-0.089 0.089-0.62
Distance from the airport/railway station (C17, km) >170 110-170 60-110 30-60 <30
Urban support (B7) The distance from the county seat (C18, km) >200 120-200 50-120 20-50 <20
The distance from a residential area with reception capacity (C19, km) >30 20-30 10-20 5-10 0-5
Supporting facilities and services (B8) Infrastructure (C20) 1 2 3 4 5
Tourism organization (C21) 1 2 3 4 5
Room and board service (C22) 1 2 3 4 5
Tourism market demand (A4) The scale of existing tourist sources (B9) Annual reception of tourists in the area where the glacier is located (C23, one million tourists) 0-66 67-200 201-348 349-519 520-1600
Potential tourist source scale (B10) The size of the urban population with
access to navigation and railways
(C24, one million people)
0-452 453-4447 4448-6735 6736-11048 11049-12047
Tourist desirability (C25) 0-397 398-675 676-810 811-1598 1599-3017
The indicators were classified based on relevant standards and norms, however, in cases without any international, national, local, or industry standards to refer to, the standards defined in the authoritative literature should be adopted. When these two types of standards were lacking, priority should be given to the method for evaluating the natural breakpoint classification of regional data in ArcGIS. Some indicators of the above methods are not applicable. A subjective experience judgment for each index was made through the expert consultation method, and the numerical range of the corresponding grade for each evaluation index was defined.

3.2.2 Index weights

In this study, the Delphi and AHP methods were used to calculate the weight vector. First, using the 1-9 scale method, 14 judgment matrices were constructed for each level of suitability evaluation of the glacier resources. Twenty experts from ecology, human geography, environmental science, tourism management, and other fields were invited to assign values to the judgment matrix. The next step involved capturing the assignment results into Yaahp to calculate the relative weight of each level of indicator. Finally, the combined weight of each indicator relative to the overall goal was calculated. It was necessary to check the consistency when establishing the judgment matrix (Table 2). The results showed that the consistency ratio (C.R.) of each level judgment matrix was less than 0.1, indicating that the consistency was reasonable.
Table 2 A-B judgment matrix and ranking list
Influence index of exploitation suitability Tourism resources in the glacier region Glacial natural environment Service facility Tourism market demand Wi
Tourism resources in glacier region 1 3 4 4 0.4992
Glacial natural environment 0.3333 1 4 4 0.2972
Service facilities 0.25 0.25 1 2 0.1198
Tourism market demand 0.25 0.25 0.5 1 0.0839

Note: λmax=4.2173; C.R.=0.0814.

3.2.3 Spatial analysis method

By applying the spatial analysis module of ArcGIS 10.4 and taking 3 km×3 km as the evaluation unit, each data layer was divided into five evaluation grades according to the evaluation criteria (Table 1), and the single-factor evaluation results were obtained. Furthermore, a spatial superposition analysis was carried out for suitability zoning. The single-factor vector data were converted into raster data, and all single-factor indexes were reclassified. Then, a weighted superposition analysis was carried out to obtain the results of suitability spatial zoning using the grid calculator in ArcGIS.

3.3 Data sources

The glacier data were collected from the Scientific Data Center of Cold and Arid Regions, and the relevant data of tourism resources were extracted from the official data released by the People’s Government Network of the Tibet Autonomous Region, the Department of Housing and Urban-Rural Development of the Tibet Autonomous Region, the Tibet Forestry Information Network, and the Ministry of Culture and Tourism. The vegetation and geological data were mainly derived from the Resources and Environment Science Center of the Chinese Academy of Sciences. The tourist volume data were extracted from the official websites of the People’s Government of the Tibet Autonomous Region, the Bureau of Statistics, and the Tourism Development Commission.

4 Results

4.1 Weight allocations of the evaluation items

The index weights of SAMGT can be obtained by combining the Delphi and AHP methods (Table 3). In the target layer, tourism resources in the glacier area occupied the largest proportion (0.4992) of all the items, followed by the glacier natural environment. In contrast, the weights of service facilities supported and the tourism market demand factor were relatively low. When it was refined to the criterion layer, the weight of the glacier resource endowment was the largest, reaching 0.3744, followed by ecological vulnerability, a combination of tourism resources, traffic conditions, and tourism safety. The core element of glacier tourism was the resource endowment, but the ecological fragility had a great impact on the development intensity.
Table 3 Index weights of SAMGT
Criteria Index Weight Criteria Index Weight
B1: Glacier resource endowment (0.3744) C1 0.1422 B6: Traffic conditions (0.0798) C15 0.0478
C2 0.1094 C16 0.0160
C3 0.0797 C17 0.0160
C4 0.0431 B7: Urban support (0.0200) C18 0.0133
B2: Combination degree of tourism resources (0.1248) C5 0.0936 C19 0.0067
C6 0.0312 B8: Supporting facilities and services (0.0200) C20 0.0114
B3: Ecological vulnerability (0.1882) C7 0.0827 C21 0.0029
C8 0.0521 C22 0.0057
C9 0.0349 B9: Existing tourist source scale (0.0559) C23 0.0559
C10 0.0185 B10: Potential tourist source scale (0.0280) C24 0.0210
B4: Tourism safety (0.0774) C11 0.0619 C25
0.0070
C12 0.0155
B5: Climate suitability (0.0315) C13 0.0210
C14 0.0105
The spatial combination effect caused by the density and abundance of the other tourism resources also needs to be considered. Traffic conditions and tourism safety were the key supporting factors in the evaluation system, and also occupied an important position.

4.2 Single factor analysis

4.2.1 Tourism resources in glacier areas

In terms of glacier scale, the relatively large glaciers in Tibet are concentrated in southeastern Tibet (Fig. 2a). The cleanliness of glaciers in Tibet was generally high regarding the aesthetic value of glaciers. Approximately 50% of the glaciers in county-level administrative regions were 100% clean, while those in some counties in southern Tibet were less than 85% clean (Fig. 2c). High-grade resources were mainly distributed in central and eastern Tibet, forming high-grade tourism resource distribution areas with Lhasa and Nyingchi as the core (Fig. 2d). The distribution density of tourism resources radiated outward with the urban area of Lhasa as the center (Fig. 2e). The tourism resources in Lhasa and Nyingchi varied, and Jomda County in Qamdo also had a high level (Fig. 2f).
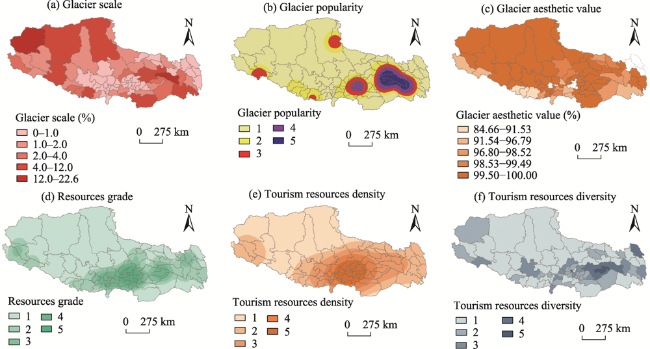
Fig. 2 Evaluation results of tourism resources in the glacier region

4.2.2 Glacier natural environment

The glacier natural environment was evaluated from the three dimensions of ecological vulnerability, tourism ecological security, and climate suitability, and several suitable areas in southeastern and northeastern Tibet were identified (Fig. 3). The results of the ecological vulnerability assessment showed that the overall slope of the Tibet Autonomous Region was relatively gentle, and the relative elevation increased gradually from northwest to southeast (Fig. 3c). The vegetation coverage was low overall and showed a gradual increase from west to east (Fig. 3a). The results of the tourism ecological security evaluation showed that the areas with the highest density of geological disasters were distributed in some districts and counties of Lhasa, Shannan, and Rikaze (Fig. 3e). The area at less than 3000 m above sea level was mainly in southeastern Tibet and would not cause obvious altitude reactions (Fig. 3f). The results of the climate suitability evaluation showed that the areas of human perception of climate comfort were mainly distributed in Motuo County, Mainling County, Bomi County, and Basu County, with a temperature-humidity index of 16 to 18 (Fig. 3g) and a wind-cold index of -299 to -230 (Fig. 3h).
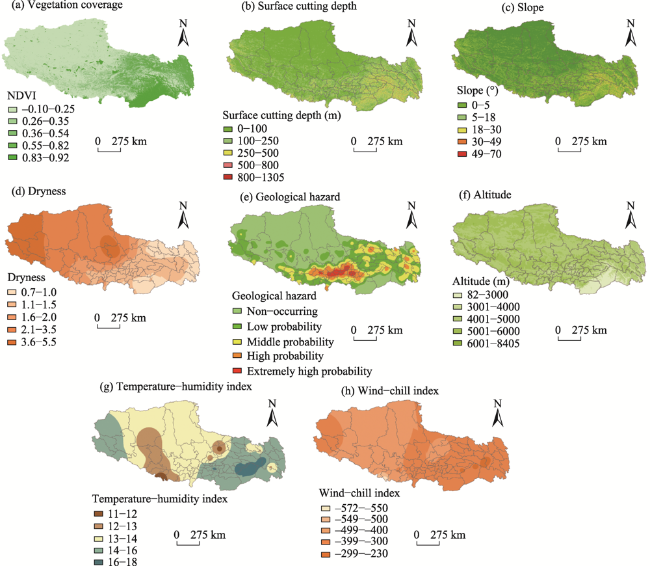
Fig. 3 Evaluation results of the glacier natural environment

4.2.3 Service facilities

In terms of traffic conditions, the distance of 10-20 km from the main road accounted for 12.52% of the total area of the study area (Fig. 4a). The traffic in eastern and central Tibet was relatively convenient, the road density was relatively high (Fig. 4b), and the interregional connectivity was relatively intense (Fig. 4c). The results of the urban support evaluation showed that the supporting conditions for social and economic development in eastern and southern Tibet were outstanding, and it was easy to take advantage of the positive spillover effect of the county seat (Fig. 4d). With regard to the supporting facilities and services, the spatial distributions of infrastructure (Fig. 4f), tourism service organizations (Fig. 4g), and room and board services (Fig. 4h) presented irregular circle distributions with Lhasa as the center, and the circular boundaries had the characteristic of shifting eastward. The overall layout of the service facilities was dense in the east and sparse in the west.
Fig. 4 Evaluation results of the glacier service facilities

4.2.4 Tourism market demand

To obtain comprehensive and accurate data, the municipal administrative region was used as the evaluation unit in the tourism market demand analysis, combined with the existing tourist source scale and potential tourist source scale (Fig. 5). The overall market demand scale of Lhasa City was the highest, followed by Nyingchi and Rikaze, and the lowest was in Ngari Prefecture. Among them, Lhasa, Nyingchi, and Rikaze ranked among the top three in the number of tourists received. The number of tourists in Lhasa was much higher than in Nyingchi and Rikaze, and the lowest number of tourists was in Ngari Prefecture. In terms of the scale of potential tourist sources, the total population of Lhasa's external navigable and railway cities was 120.47 million. Concurrently, the glacier tourist area was highly attractive and had the most exuberant tourism market demand.
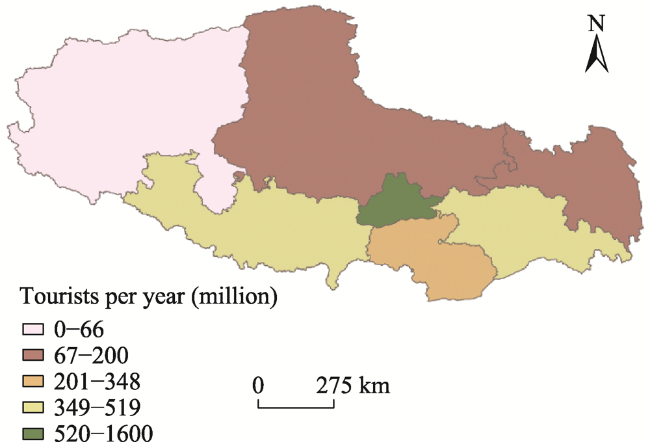
Fig. 5 Evaluation of the scale of tourism market demand

4.3 Comprehensive evaluation of exploitation suitability

According to the suitability evaluation model of glacier tourism development, all the index layers were superimposed and analyzed, and the results could be divided into four grades: suitable, relatively suitable, barely suitable, and unsuitable exploitation zones. Finally, the suitability zoning map of tourism exploitation of glacier resources in the Tibet Autonomous Region was obtained (Fig. 6).
Fig. 6 Zoning of SAMGT in Tibet

4.3.1 Suitable exploitation zone

The total area of this zone (the dark green color in Fig. 6) is 66200 km2, accounting for 5.39% of the total area of the study area, and it is mainly distributed in eastern Tibet, including Nyingchi, Bomi, Mainling, Gongbo’gyamda, and other sites. The glacier resource endowment in the region was good, the glaciers were relatively large, and it had glacier tourist attractions such as Midui Glacier and Daba Glacier. The distribution of tourism resources around the glaciers was dense, the types were rich and diverse, and the combination of resources was excellent. The climate was warm and humid with high vegetation coverage. Simultaneously, the altitude of this area was low, with most places at approximately 3000 m above sea level, and the accessibility of tourism traffic was high. The development of tourism in the region was relatively mature, and the conditions of infrastructure and tourism facilities such as tourism transportation, food, and accommodation were also relatively perfect.

4.3.2 Relatively suitable exploitation zone

The total area of this zone (the blue color in Fig. 6) is 119900 km2, accounting for 9.76% of the total area of the study area, and it is mainly distributed in central and southern Tibet, in the administrative divisions of Zayu County, Comai County, Qusum County, Basu County, and other places. The scale of glaciers in the area was relatively large, including relatively well-known glacier resources such as Laigu Glacier and 40 other glaciers, and high-grade tourism resources such as the Yarlung Zangbu Grand Canyon National Nature Reserve. In this area, the glacier distribution density and popularity were slightly lower, the level of infrastructure construction was low, the accommodation and tourism service facilities were fewer, high-grade highway traffic was lacking, and the road density was limited.

4.3.3 Barely suitable exploitation zone

The total area of this zone (the light green color in Fig. 6) is 187700 km2, accounting for 15.28% of the total area of the study area, and it is mainly distributed in northern and southern Tibet. The administrative divisions included Zuogong County, Banbar County, Lhorong County, Biru County, Gyangze County, and other places. The endowment conditions of glacier resources in this region were average, the distribution density of glaciers was not high, and there were only a few glaciers known in the market, such as Carola Glacier. However, other types of tourism resources were rich and high-grade, and the traffic network was relatively perfect. The development of glacier tourism in this area was greatly restricted by nature, and the ecological environment was fragile. The suitable travel period was short in a year, and tourism exploitation was difficult.

4.3.4 Unsuitable exploitation zone

The total area of this zone (the orange color in Fig. 6) is 854600 km2, accounting for 69.57% of the total area of the study area, and it is widely distributed in western Tibet, as well as the northeast and southeast. Most of the area was at greater than 4500 m above sea level, the phenomenon of hypoxia on the plateau was obvious, the climate was cold and dry, and the comfort level of the human body was low throughout the year. The level of economic and social development lagged behind, so the number of towns and effective settlements was limited. In most areas, transportation was inconvenient and had poor accessibility. Glaciers were mostly distributed in ecological function-protected areas, which should be strictly protected and tourism activities are prohibited.

4.4 Confirmatory analysis

To test the rationality of the suitability evaluation results, this study selected Midui Glacier, Lagu Glacier, Carola Glacier, Rongbu Glacier, and Naimona’nyi Glacier, each of which has been developed and is well-known in the Tibet Autonomous Region. The results of each glacier suitability evaluation grade were compared according to the geographical location of the glacier (Table 4). The Rongbu Glacier and Naimona'nyi Glacier, located in an unsuitable area, both had a fragile ecological environment and high sensitivity, so they have not carried out tourism exploitation thus far. Midui Glacier, located in a suitable area, has developed into an AAAA-class scenic spot, with an average of 100000 tourists every year, and its glacier tourism operates robustly. Laigu Glacier and Carola Glacier are located in relatively suitable and barely suitable areas, respectively, and they also have carried out low-level development and sightseeing tourism. This comparative analysis and verification shows that the model could comprehensively evaluate the factors that have affected the suitability of glacier tourism development, and the zoning results are consistent with the actual tourism development, which verifies the rationality of the evaluation model.
Table 4 Comparison of the results of SAMGT
Assessment types Midui Glacier Laigu Glacier Carola Glacier Rongbu Glacier Naimona’nyi Glacier
Grade of tourism resource quality 4 3 2 2 2
Suitability of natural environment Relatively suitable Relatively suitable Barely suitable Unsuitable Unsuitable
Grade of service facilities perfection 3 3 4 1 2
Grade of tourism market demand scale 3 2 3 3 1
Grade of development suitability Suitable Relatively suitable Barely suitable Unsuitable Unsuitable
Development status High-level developed Low-level developed Low-level developed Undeveloped Undeveloped

5 Conclusions and discussion

This study used the plateau altitude, geological disasters, and other elements of the glacier tourism resource development and evaluation system, taking into account the special geographical environment of the glacier tourism area, to identify the factors which impact SAMGT. These factors are the quality of tourism resources, natural environment conditions, service facilities, and tourism market potential, which have improved the glacier tourism suitability evaluation framework elements to some extent. Furthermore, additional studies can be conducted from a multidimensional perspective to improve the existing evaluation system.
In this study, the Delphi and AHP methods, based on factor determining identification, were used to select the parameters involved in the evaluation of glacier tourism resource development, including regional tourism resources, the natural environment of glaciers, service support, and market demand factors. Among them, glacier resource endowment, ecological vulnerability, tourism resource combination, and transportation conditions accounted for a relatively high proportion. These results were different from those of Wang and Zhao (2011), which were derived using a potential evaluation model consisting of: 1) location traffic potential, 2) resources and environment, 3) infrastructure condition, and 4) socioeconomic status. The key indicators of development potential are traffic condition, followed by the potential of resources and environment. In contrast, SAMGT puts more emphasis on the value of resources and the natural environment, because of the harsh environment and the strong attraction of glacier tourism resources.
The second component is the implementation of a case study. The suitability of glacier tourism resource development in the Tibet Autonomous Region was divided into four spatial regions based on SAMGT. The results show that the suitable exploitation zones are mainly distributed in eastern Tibet, accounting for 5.39% of the total area. Relatively suitable exploitation zones are mainly distributed in central and southern Tibet, accounting for 9.76%, and the barely suitable exploitation zones are mainly distributed in northern and southern Tibet, accounting for 15.28%. Unsuitable exploitation zones are widely distributed in the west, northeast, and southeast, accounting for 69.57%. Through empirical testing, this evaluation system can provide a theoretical basis and support tool for glacier tourism planning and development.
This study has some limitations. When using the Delphi and AHP methods, the subjectivity of experts is unavoidable and the evaluation results have certain limitations when using the natural fracture method to grade indicators without reference standards. In addition, this study constructed an evaluation model that is suitable for a large spatial scale, however, a different spatial scope can be selected for further research. Based on SAMGT, it is possible to analyze the applicability of the evaluation model, considering the flexibility of the evaluation indexes and the applicable scope, and then identify a small space within the scope of the glacier tourism resource development evaluation model.
[1]
Bunruamkaew K, Murayam Y. 2011. Site suitability evaluation for ecotourism using GIS & AHP: A case study of Surat Thani Province, Thailand. Procedia-Social and Behavioral Sciences, 21: 269-278.

DOI

[2]
Cannone N, Diolaiuti G, Guglielmin M, et al. 2008. Accelerating climate change impacts on alpine glacier forefield ecosystems in the European Alps. Ecological Applications, 18(3): 637-648.

DOI

[3]
Capps D M. 2017. The role of glaciers and glacier research in the development of US National Parks. Earth Sciences History, 36(2): 337-358.

[4]
Dhami I, Deng J Y, Strager M, et al. 2017. Suitability-sensitivity analysis of nature-based tourism using geographic information systems and analytic hierarchy process. Journal of Ecotourism, 16(1): 41-68.

DOI

[5]
Espiner S, Becken S. 2014. Tourist towns on the edge: Conceptualizing vulnerability and resilience in a protected area tourism system. Journal of Sustainable Tourism, 22(4): 646-665.

DOI

[6]
Fitchett J M, Robinson D, Hoogendoorn G. 2017. Climate suitability for tourism in South Africa. Journal of Sustainable Tourism, 25(6): 851-867.

DOI

[7]
Furunes T, Mykletun R J. 2012. Frozen adventure at risk? A 7-year follow-up study of Norwegian glacier tourism. Scandinavian Journal of Hospitality and Tourism, 12(4): 324-348.

DOI

[8]
Garavaglia V, Diolaiuti G, Smiraglia C, et al. 2012. Evaluating tourist perception of environmental changes as a contribution to managing natural resources in glacierized areas: A case study of the Forni Glacier (Stelvio National Park, Italian Alps). Environmental Management, 50(6): 1125-1138.

DOI PMID

[9]
Liu S Y, Yao X J, Guo W Q, et al. 2015. The contemporary glaciers in China based on the Second Chinese Glacier. Acta Geographica Sinica, 70(1): 3-16. (in Chinese)

[10]
Liu X L, Yang Z P, Xie T. 2006. Development and conservation of glacier tourist resources-A case study of Bogda Glacier Park. Chinese Geographical Science, 16(4): 365-370.

DOI

[11]
Rahayuningsih T, Muntasib E K S H, Prasetyo L B. 2016. Nature based tourism resources assessment using geographic information system (GIS): Case study in Bogor. Procedia Environmental Sciences, 33: 365-375.

DOI

[12]
Reynolds J M. 1992. Geohazards. Liverpool, UK: Springer, Dordrecht.

[13]
Stewart E J, Wilson J, Espiner S, et al. 2016. Implications of climate change for glacier tourism. Tourism Geographies, 18(4): 377-398.

DOI

[14]
Tsaur S H, Wang C H. 2007. The evaluation of sustainable tourism development by Analytic Hierarchy Process and Fuzzy set theory: An empirical study on the Green Island in Taiwan. Asia Pacific Journal of Tourism Research, 12(2): 127-145.

DOI

[15]
Wang S J, Xie J, Zhou L Y. 2020. China’s glacier tourism: Potential evaluation and spatial planning. Journal of Destination Marketing & Management, 18: 100506. DOI: 10.1016/j.jdmm.2020.100506.

DOI

[16]
Wang S J, Qin D H, Ren J W. 2012. Spatial development and distribution of glacier tourism in China. Scientia Geographica Sinica, 32(4): 464-470. (in Chinese)

[17]
Wang S J, Zhao J D. 2011. Potential evaluation and spatial development strategies of glacier tourism in China. Geographical Research, 30(8): 1528-1542. (in Chinese)

[18]
Wu G H, Shen Y P. 2007. Glaciers tourism resources in China and their development. Journal of Glaciology and Geocryology, 29(4): 664-667. (in Chinese)

[19]
Yan L B, Gao B W, Zhang M. 2017. A mathematical model for tourism potential assessment. Tourism Management, 63: 355-365.

DOI

[20]
Zhong L S, Xiao D N, Zhao S D. 2002. Ecotourism suitability evaluation: The case of Wusuli River National Forest Park. Journal of Natural Resources, 17(1): 71-77. (in Chinese)

[21]
Zhou J Y, Zhu C Y. 2004. The evaluation and exploitation of glacier tourism resources along the Railway of Qingzang. Science & Technology Progress and Policy, 21(7): 44-46. (in Chinese)

Outlines

/