Ice and Snow Tourism Experience and Its Influencing Factors

Evaluation and Promotion Model of Tourist Satisfaction in Ice and Snow Tourism Destinations

  • CHEN Xiangyu , 1, 2 ,
  • XU Shiyi 1, 2 ,
  • TANG Chengcai , 1, 2, * ,
  • FAN Zhijia 3 ,
  • XIAO Xiaoyue 1, 2
Expand
  • 1. School of Tourism Sciences, Beijing International Studies University, Beijing 100024, China
  • 2. Research Center of Beijing Tourism Development, Beijing 100024, China
  • 3. College of Urban and Environmental Sciences, Peking University, Beijing 100871, China
*TANG Chengcai, E-mail:

CHEN Xiangyu, E-mail:

Received date: 2021-10-09

  Accepted date: 2022-01-08

  Online published: 2022-06-07

Supported by

The National Natural Science Foundation of China(42071199)

The Art Major Project of the National Social Science Foundation of China(20ZD02)

The Research Center of Beijing Tourism Development Project of Beijing International Studies University(LYFZ19A003)

The Project of Top-notch Young Higher Level Teaching Team Building Support Plan in Beijing Municipal Universities(CIT & TCD201704067)

Abstract

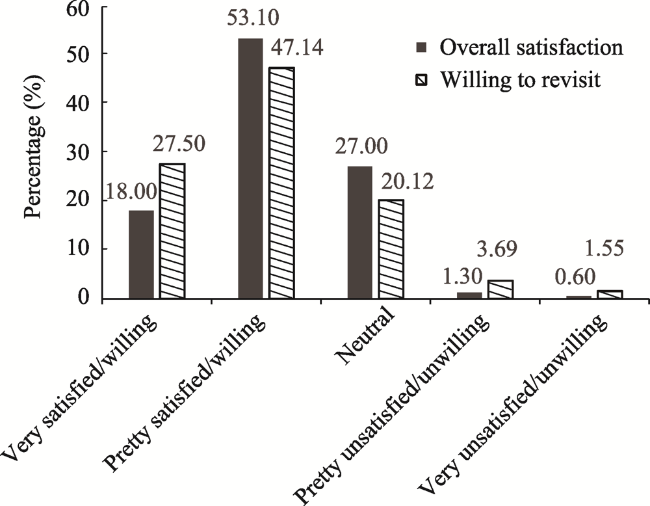
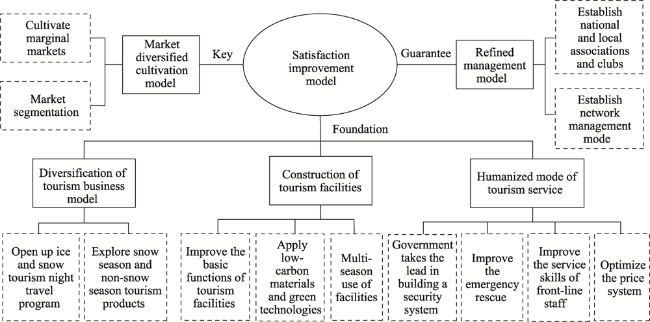
The successful bid for the Beijing Winter Olympics has brought historic opportunities for the development of ice and snow tourism in China. An index system for the evaluation of tourist satisfaction in ice and snow tourism destinations was constructed from the target layer-factor layer-index layer approach in this paper. Taking tourists with ice and snow tourism experience as the research object, and integrating a questionnaire survey and the Importance-Performance Analysis (IPA) method, a total of 840 valid questionnaires were collected to assess the satisfaction of tourists in snow and ice tourism destinations, and the promotion model of tourist satisfaction in ice and snow tourism destinations was put forward. This process led to three main results. (1) Ice and snow tourists in China are characterized as young and better-educated, with college students aged 19 to 25 as the main consumer group. More than 70% of ice and snow tourists are pretty satisfied with the current development of ice and snow destinations in China, and are willing to participate again. (2) Other than “ice and snow souvenirs”, tourists’ perceptions of importance are all higher than the level of perceived satisfaction, and the importance values of the 13 indicators including “Scenic spot security” and “Diversity of ice and snow entertainment and sports” are especially high, showing that tourists have high expectations and demands of the destinations. However, the perceived satisfaction level of tourists for all indexes is generally low, mostly at the general satisfaction level, indicating that ice and snow tourism destinations have only partially met the demands of ice and snow tourists, and there is still much room for improvement. (3) After IPA analysis, five suggestions for improving the satisfaction of tourists in ice and snow tourism destinations were put forward, including diversification of the tourism business model, construction of tourism facilities, a market diversified cultivation model, a humanized mode of tourism service and a refined management model. The results of this study will help to enrich the theory of ice and snow tourist satisfaction and promote the high-quality development of China's ice and snow tourism in the post-Winter Olympics era.

Cite this article

CHEN Xiangyu , XU Shiyi , TANG Chengcai , FAN Zhijia , XIAO Xiaoyue . Evaluation and Promotion Model of Tourist Satisfaction in Ice and Snow Tourism Destinations[J]. Journal of Resources and Ecology, 2022 , 13(4) : 635 -645 . DOI: 10.5814/j.issn.1674-764x.2022.04.009

1 Introduction

The Chinese government made the promise of “motivating 300 million people to take part in ice and snow sports” after Beijing’s successful bid for the 24th Winter Olympics in 2015. In recent years, the Central Committee and the State Council of China attached great importance to the development of ice and snow sports and ice and snow tourism. Later, in 2021, the Ministry of Culture and Tourism, National Development and Reform Commission and General Administration of Sports of China jointly issued “Action Plan for Ice and Snow Tourism Development (2021-2023)”. A report on the “Development of Ice and Snow Tourism in China (2020)” released by the China Tourism Academy shows that there were more than 224 million tourists in the 2018-2019 snow season, with a profit of approximately 386 billion Yuan, representing increases by 13.7% and 17.1%, respectively, compared with 2017-2018. The rapid development of ice and snow tourism has also revealed the problems of imperfect tourism infrastructure (Dong et al., 2021), ecological environment destruction (Li et al., 2021), short stays of tourists, and low economic benefits, among others. The current research mainly focuses on the mutual impact between ice and snow tourism and climate change (Gonseth, 2013; Dar et al. 2014; Steiger et al., 2020), the development direction of the ice and snow industry (Liu et al., 2021), the integral mode of the ice and snow industry (Chen et al., 2020; Li et al., 2020), competitiveness evaluation of ice and snow tourism (Zhao et al., 2021) and the ice and snow economy (Moreno-Gené et al., 2020; Ji and Xiong, 2021). Some research has been done on the satisfaction level of ski tourists, with the main study areas focusing on Chongli (Lu et al., 2018), Urumchi (Deng et al., 2021) and Liaoning (Zhou, 2020). Some researchers have also chosen 10 northern ski resorts as the sample areas for research (Long, 2020). There are relatively few studies on tourist satisfaction in ice and snow tourism destinations, and the main research fields are “ice and snow tourism in Harbin” (Lou and Chen, 2018; Zhu et al., 2018) and “northeastern ice and snow tourism resources” (Xu, 2020). In 1965, Cardozo first proposed the concept of customer satisfaction, and satisfaction is the difference between the customers’ expectations before consumption and their actual perception. When there are differences, dissatisfaction will arise (Shao et al., 2020), which refers to a term in psychology. Customer satisfaction is generally evaluated from the perspectives of the quality of products (Clementa et al., 2006), service (Alikara and Raffacle, 2011; Chen, 2016; Cristobal et al., 2007), price (Zhou, 2015), and so on. Likewise, tourist satisfaction in ice and snow is also a kind of customer satisfaction, and the methods used most often in its studies are combinations of questionnaires, factor analysis, fuzzy comprehensive evaluation, Importance- Performance Analysis (IPA), logistic analysis, and paired sample T-tests (Lou and Chen, 2018; Zhu et al., 2018; Deng et al., 2021). IPA regards customer satisfaction as a function of product expectation and product performance, and derives the customer satisfaction through the comparison of importance and performance. As this method can objectively evaluate the importance and expressiveness of the factors that affect tourist satisfaction, some scholars have already applied it to tourist satisfaction measurement research (Cai et al., 2011; Zhu et al., 2018).
To promote the high-quality development of ice and snow tourism in the post-Winter Olympics era, and in response to the relative lack of current research on tourist satisfaction in ice and snow destinations, this study constructs an index system of tourist satisfaction evaluation. Taking tourists with ice and snow tourism experience nationwide as the research object, questionnaires and IPA were combined to evaluate tourist satisfaction regarding ice and snow tourism and a satisfaction promotion model was created based on the results. The results will help to enrich the theories of ice and snow tourism, as well as promoting the high-quality development of ice and snow tourism in the post-Beijing Winter Olympics era in China.

2 Research methods and data sources

2.1 Construction of the evaluation index system of tourists’ satisfaction in ice and snow tourism destinations

The factors influencing ice and snow tourist satisfaction are very complex. Referring to existing research (Zhu et al., 2018) and the Delphi method, a tourist satisfaction evaluation index system for ice and snow tourism was initially constructed from four aspects: “tourism resources”, “tourism service”, “tourism facilities” and “tourism cost”. This system includes four factor layers and 27 index layers (Table 1).
Table 1 Evaluation index system of tourist satisfaction for ice and snow tourism destinations
Targeted layer Factor layer Index layer References
Evaluation index system of tourist satisfaction for ice and snow tourist
destinations
(A)
Tourism resources
(B1)
Scarcity of ice and snow landscape (C1), Diversity of ice and snow landscape (C2), Ice and snow festivals (C3), Diversity of ice and snow culture (C4), Attraction of ice and snow culture (C5) Shi et al., 2015;
Xiao et al., 2021;
World Tourism Organization, 1979
Tourism service (B2) Staff service attitude (C6), Scenic spot security (C7), Diversity of ice and snow entertainment and sports (C8), Ice and snow entertainment and sports experience (C9), Efficiency of rescue service (C10), Ice and snow souvenirs (C11), Accommodation comfort (C12), Catering satisfaction (C13), Professional guide interpretation (C14) Wu, 2007
Tourism facilities
(B3)
Sanitary conditions (C15), Rationality of toilet distribution (C16), Rationality of dustbin distribution (C17), Rationality of rest area distribution (C18), Accommodation facilities (C19), Catering facilities (C20), Transportation convenience in scenic spots (C21), Mobile phone signal quality in scenic spots (C22) Mandic et al., 2018;
Mohammad Nawval et al., 2021
Tourism cost
(B4)
Accommodation cost (C23), Ticket cost (C24), Catering cost (C25), Entertainment and sports cost (C26), Transportation cost (C27) Çelik and Rasoolimanesh, 2021

2.2 Questionnaire design and data analysis

The questionnaire is divided into three parts. In the first part, questions were designed based on the index system shown in Table 1, on the principles of objectivity, integrity, scientific validity and operability. The second part is about tourists' overall impression of ice and snow tourism and their willingness to revisit, aiming at understanding tourists’ overall satisfaction and willingness for revisitation. The Likert 5 scale was used to assess the contents in these two parts. On a scale of one to five, feelings increase from weak to strong, and the participants need to provide a rating for each question item. The third part is about tourists’ basic attributes, including participants’ gender, age, education, career, income and permanent residency. The survey was distributed online, through the platform of Wenjuanxing. From December 2020 to January 2021, 840 copies were returned in total, and all of them were valid. SPSS 25.0 software was used to test the reliability and validity of the data, the results are shown in Table 2. The results of the reliability test showed that the alpha value of the total scale reached 0.974 and the alpha value of each subscale was greater than 0.7, which indicated that the reliability of the scale was high. According to the results, the KMO value of the total scale was 0.960, while the KMO value of each subscale ranged from 0.854 to 0.930, and the Bartlett sphericity test value P<0.001, reaching the significance level and indicating that the data obtained were suitable for the factor analysis.
Table 2 Analysis of reliability and validity of the total scale and subscales
Basic aspect Alpha reliability KMO Approximate chi-square Bartlett’s sphericity test degrees of freedom P
Total scale 0.974 0.960 20008.613 378 <0.001
Tourism cost 0.885 0.887 2134.390 10 <0.001
Tourism facilities 0.937 0.930 5248.176 28 <0.001
Tourism service 0.904 0.878 5604.426 36 <0.001
Tourism resources 0.951 0.854 3332.821 10 <0.001

2.3 IPA method

The IPA index was constructed to scientifically reflect the difference between importance and satisfaction. By measuring the IPA index, we can quantify the difference between ice and snow tourists' expectation and performance scientifically. The calculation formula is:
$I P A I=\frac{100 \times(I-P)}{I}$
where IPAI in the function represents Importance Performance Analysis Index, while I represents Importance and P represents Performance. The lower the IPAI, the higher the degree of satisfaction. Referring to an existing study (Cai et al., 2011), in order to identify the degree of influence on the satisfaction level caused by different factors, IPAI is divided into five levels, namely: ≤5.00, 5.01‒10.00, 10.01‒20.00, 20.01‒30.00 and ≥30.01, indicating: very satisfied, pretty satisfied, neutral, pretty dissatisfied and very dissatisfied, respectively.

3 Results and analysis

3.1 Attribute analysis

The analysis of the survey sample in Table 3 shows four main points. 1) From the perspective of age and gender, tourists’ ages are mainly from 19 to 45, accounting for 77.02% of the total, in which the percentage of young adults aged 19‒25 reaches 49.05%, and female tourists participate in ice and snow tourism more than males. 2) More than half (51.43%) of tourist have a monthly income lower than 3000 yuan, 40.83% of which are students. 3) Participants mostly have a college or undergraduate education, making up 64.64%; and most of them are senior intellectuals, having strong cognitive ability for new things. For a career, most of them are full-time students and staff in institutions, accounting for 46.31% and 22.02%, respectively. 4) The tourist market includes more easterners and less westerners, more northerners and less southerners. Heilongjiang (32.62%) and Beijing (19.17%) stand out among the northern cities, while the centers of the source market in southern cities are Hunan (9.64%) and Guangdong (3.45%).
Table 3 Statistical results of basic attributes of the sample tourists
Variables Categories Amount Frequency (%) Varieties Categories Amount Frequency (%)
Gender Male 296 35.24 Career Full-time student 389 46.31
Female 544 64.76 Ordinary staff 109 12.98
Age Under 18 14 1.67 Freelancer 29 3.45
19‒25 412 49.05 Serviceman 1 0.12
26‒35 112 13.33 Self-employed 18 2.14
36‒45 123 14.64 Professional technical personnel (like doctor, lawyer, journalist and teacher) 185 22.02
46-60 159 18.93 Public servant 58 6.90
Above 60 20 2.38 Farmer 0 0
Education High school and below 44 5.24 Unemployed 3 0.36
Junior college and undergraduate 543 64.64 Others (like retired) 48 5.71
Postgraduate and above 253 30.12 Monthly
income
(103 yuan)
0‒0.9 343 40.83
Source market Beijing 161 19.17 1.0‒3.0 89 10.60
Heilongjiang 274 32.62 3.1‒5.0 77 9.17
Hunan 81 9.64 5.1‒10.0 182 21.67
Jilin 41 4.88 10.1‒20.0 83 9.88
Guangdong 29 3.45 20.1‒30.0 20 2.38
Zhejiang 24 2.86 31.0‒50.0 12 1.43
Others 230 27.38 50.1‒100.0 19 2.26
Above 100.0 15 1.79
The results show that people with ice and snow tourism experience exhibit the characteristics of being young and knowledgeable, and they have strong acceptability, are thoughtful, creative and enthusiastic toward new things. Students aged 19‒25 are the main consumer group of ice and snow tourism, which will drive the vigorous development of ice and snow tourism in China in the future.

3.2 Analysis of overall satisfaction and revisitation willingness

According to Fig. 1, more than 70% of tourists’ express overall positive satisfaction with ice and snow tourism destinations, as either “very satisfied” (18%) or “pretty satisfied” (53.1%), while 1.30% and 0.6% tourists are “pretty dissatisfied” and “very dissatisfied”, respectively. About 75% of tourists show willingness to participate a second time, while 20.12% of tourists have no preference on revisiting, and only 5.24% of tourists are “pretty unwilling” or “very unwilling”. We can infer from these results that tourist satisfaction for the current development of ice and snow tourism destination is generally high, and most of them are willing to participate in ice and snow activities again.
Fig. 1 The overall satisfaction and willingness to revisit among the sampled tourists
Figure 2 shows the tourist satisfaction levels for three main aspects: tourism resources, tourism service and tourism facilities. More than 70% of tourists are “very satisfied” or “pretty satisfied” with ice and snow tourism resources, showing that tourists have a high degree of recognition of the resources. This is closely related to the climatic and cultural advantages in ice and snow tourism resources (Xu, 2021), and northeast China features a high latitude and has a long snow period, so it is rich in natural ice and snow resources. In addition, combing natural ice and snow resources with minority culture is more attractive to tourists. Compared to ice and snow resources, tourism facilities and tourism service have bigger potential for improvement.
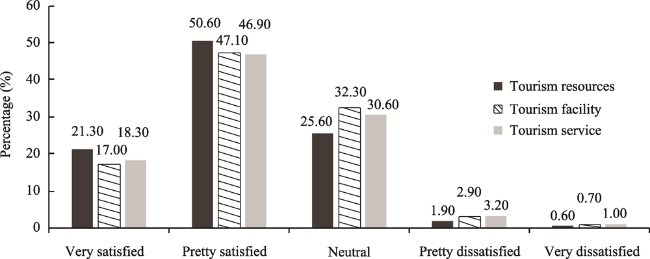
Fig. 2 The satisfaction with the various elements of ice-snow tourist destinations among the sampled tourists

3.3 IPA analysis for individual indexes

3.3.1 Importance

As shown in Table 4, the mean values of tourists’ perceptions of the importance of 27 indicators range from 3.14 to 4.62, and the standard deviations are between 0.905 and 1.170. Among them, the 13 indicators in “Tourism Service (B2)” and “Tourism Facilities (B3)” are all greater than 4.0, and the standard deviations are all less than 1.0, indicating higher requirements for these secondary indicators, so these are the aspects that the destinations should pay the most attention to. At the same time, the mean values of the perceived importance for the four secondary indicators (“Ticket cost (C24)”, “Catering cost (C25)”, “Entertainment and sports cost (C26)”, and “Transportation cost (C27)”) belonging to “Tourism Resources (B1)” are lower than 4.0, while the standard deviations are all below 1.0, indicating that most tourists have a unified perception of these four indicators and they are also highly valued. Ice and snow resources are the foundation and basic guarantee for the development of ice and snow tourism. Thus, it is important for destinations to create various ice and snow landscapes, organize a range of ice and snow festivals and improve ice and snow cultural attractions. All indexes belonging to “Tourism Cost (B4)” are lower than 4.0, and the standard deviations are higher than 1.0, showing that the participants do not have an agreement on the importance of these indicators and have a higher demand for personalized service. This is the same for “Scarcity of ice and snow landscape (C1)”, “Ice and snow souvenirs (C11)”, “Professional guide interpretation (C14)”, “Rationality of dustbin distribution (C17)”, and “Rationality of rest area distribution (C18)”, for which tourists seem to have different demands.
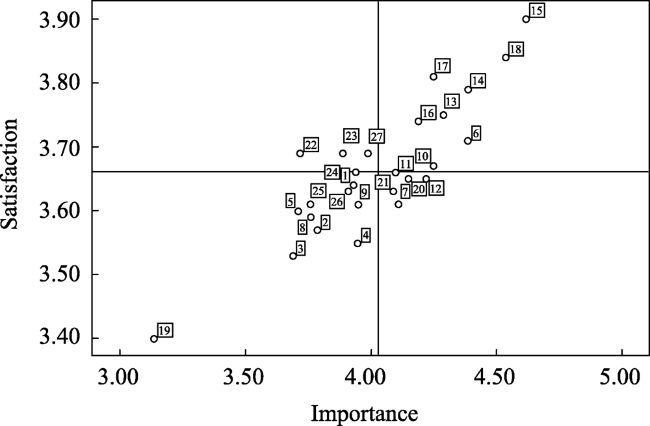
Table 4 The evaluation results of importance, satisfaction and IPA indexes for impact indicators
Factor Index Importance Satisfaction IP IPA Index Satisfaction level
Mean Standard Deviation Mean Standard Deviation
Tourism resources
(B1)
Scarcity of ice and snow landscape (C1) 3.89 1.020 3.69 0.961 0.20 5.14 Pretty satisfied
Diversity of ice and snow landscape (C2) 3.94 0.953 3.66 0.946 0.28 7.11 Pretty satisfied
Ice and snow festivals (C3) 3.76 0.999 3.61 0.948 0.15 3.99 Very satisfied
Diversity of ice and snow culture (C4) 3.91 0.971 3.63 0.952 0.28 7.16 Pretty satisfied
Attraction of ice and snow culture (C5) 3.99 0.984 3.69 0.971 0.3 7.52 Pretty satisfied
Tourism service
(B2)
Staff service attitude (C6) 4.39 0.913 3.79 0.951 0.6 13.67 Neutral
Scenic spot security (C7) 4.62 0.866 3.9 0.937 0.72 15.58 Neutral
Diversity of ice and snow entertainment and sports (C8) 4.19 0.945 3.74 0.943 0.45 10.74 Neutral
Ice and snow entertainment and sports experience (C9) 4.25 0.928 3.81 0.899 0.44 10.35 Neutral
Efficiency of rescue services (C10) 4.54 0.905 3.84 0.959 0.70 15.42 Neutral
Ice and snow souvenirs (C11) 3.14 1.170 3.4 1.051 ‒0.26 ‒8.28 Very satisfied
Accommodation comfort (C12) 4.15 0.933 3.65 0.933 0.5 12.05 Neutral
Catering satisfaction (C13) 4.09 0.958 3.63 0.937 0.46 11.25 Neutral
Professional guide interpretation (C14) 3.72 1.106 3.59 0.965 0.13 3.49 Very satisfied
Tourism facilities
(B3)
Sanitary conditions (C15) 4.39 0.971 3.71 0.966 0.68 15.49 Neutral
Rationality of toilet distribution (C16) 4.11 0.993 3.61 0.984 0.5 12.27 Neutral
Rationality of dustbin distribution (C17) 3.76 1.103 3.59 0.963 0.17 4.52 Very satisfied
Rationality of rest areas distribution (C18) 3.95 1.047 3.61 0.944 0.34 8.61 Pretty satisfied
Accommodation facilities (C19) 4.25 0.956 3.67 0.935 0.58 13.65 Neutral
Catering facilities (C20) 4.10 0.963 3.66 0.925 0.44 10.73 Neutral
Transportation convenience in scenic spots (C21) 4.22 0.937 3.65 0.957 0.57 13.51 Neutral
Mobile phone signal quality in scenic spots (C22) 4.29 0.971 3.75 0.963 0.54 12.59 Neutral
Tourism cost
(B4)
Accommodation cost (C23) 3.93 1.041 3.64 0.969 0.29 7.38 Pretty satisfied
Ticket cost (C24) 3.79 1.079 3.57 1.009 0.22 5.80 Pretty satisfied
Catering cost (C25) 3.69 1.044 3.53 1.001 0.16 4.34 Very satisfied
Entertainment and sports cost (C26) 3.95 1.027 3.55 0.998 0.40 10.13 Neutral
Transportation cost (C27) 3.71 1.119 3.60 0.976 0.11 2.96 Very satisfied

3.3.2 Satisfaction

As can be seen from Table 4, the level of tourist satisfaction over separate indicators is relatively low, with the average values between 3.40 and 3.90, and the tourists are mostly satisfied at the “Neutral” level, indicating that the development of ice and snow tourism destinations have only somewhat met the needs of the tourists and there is still much room for improvement. Relatively speaking, the average satisfaction levels of tourists with the five indicators in “Tourism Service (B2)” and “Service Facilities (B3)” are 3.75 (equivalent to 75 points) and above, only accounting for 18.5% of the total indicators, including “Scenic spot security (C7)” (3.90), “Efficiency of rescue services (C10)” (3.84), “Ice and snow entertainment and sports experience (C9)” (3.81), “Staff service attitude (C6)” (3.79) and “Mobile phone signal quality in scenic spots (C22)” (3.75), which are distributed in “Tourism Service (B2)” and “Tourism Facilities (B3)”. The satisfaction levels of “Tourism Cost (B4)” and “Tourism Resources (B1)” do not achieve 3.75, indicating that the development of ice and snow tourism in China needs to be further improved in terms of resource development and utilization, personalized development, tourism cost control and market construction.

3.3.3 IPA

After analyzing the differences between the importance and satisfaction for the indexes, it can be seen that except for “ice and snow souvenirs”, the remaining indexes are all positive, showing that tourists' overall satisfaction does not exceed their expectations. Through an analysis of the Importance-Performance Analysis Index, it is found that the satisfaction level of the index layer can be divided into three levels. The first level contains the indexes for which the tourists are very satisfied, including “Ice and snow festivals (C3)”, “Ice and snow souvenirs (C11)”, “Professional guide interpretation (C14)”, “Rationality of dustbin distribution (C17)”, “Catering cost (C25)” and “Transportation cost (C27)”. Secondly, there are the pretty satisfied indexes, including “Scarcity of ice and snow landscape (C1)”, “Diversity of ice and snow landscape (C2)”, “Diversity of ice and snow culture (C4)”, “Attraction of ice and snow culture (C5)”, “Rationality of rest area distribution (C18)”, “Accommodation cost (C23)” and “Ticket cost (C24)”. The third level, “Neutral”, includes “Staff service attitude (C6)”, “Scenic spot security (C7)”, “Diversity of ice and snow entertainment and sports (C8)”, “Ice and snow entertainment and sports experience (C9)”, “Efficiency of rescue service (C10)”, “Accommodation comfort (C12)”, “Catering satisfaction (C13)”, “Sanitary conditions (C15)”, “Rationality of toilet distribution (C16)”, “Accommodation facilities (C19)”, “Catering facilities (C20)”, “Transportation convenience in scenic spot (C21)”, “Mobile phone signal quality in scenic spots” (C22) and “Entertainment and sports cost (C26)”. As there are no “pretty dissatisfied” or “very dissatisfied” indexes, we can conclude that the construction of ice and snow tourism destinations has reached the passing level, but the “very satisfied” and “pretty satisfied” indicators represent only 48.1%, or less than half. The indexes which rank as “Neutral” also indicate the improvement directions of ice and snow tourism destinations in the future.

3.4 IPA analysis matrix of ice and snow tourism destinations based on tourists’ perception

Figure 3 shows the IPA analysis matrix of significance and satisfaction of ice and snow tourism destinations as perceived by tourists. It is divided into four quadrants with the mean value points of each measure of importance and satisfaction (equal to 4.0267 and 3.6619, respectively) as the cut-off points. The results of the importance and satisfaction of the above 27 measurement indicators are mapped in this matrix diagram. The first quadrant is the “advantage area”, the second is the “maintenance area”, the third is the “opportunity area”, and the fourth is the “improvement area”.
Fig. 3 The matrix of importance-performance analysis of tourist satisfaction for ice-snow tourism

Note: 1. Accommodation cost (C23), 2. Ticket cost (C24), 3. Catering cost (C25), 4. Entertainment and sports cost (C26), 5. Transportation cost(C27), 6. Sanitary conditions(C15), 7. Rationality of toilet distribution (C16), 8. Rationality of dustbin distribution(C17), 9. Rationality of rest area distribution (C18), 10. Accommodation facilities (C19), 11. Catering facilities (C20), 12. Transportation convenience in scenic spots (C21), 13. Mobile phone signal quality in scenic spots (C22), 14. Staff service attitude (C6), 15. Scenic spot security (C7), 16. Diversity of ice and snow entertainment and sports (C8), 17. Ice and snow entertainment and sports experience (C9), 18. Efficiency of rescue services (C10), 19. Ice and snow souvenirs (C11), 20. Accommodation comfort (C12), 21. Catering satisfaction (C13), 22. Professional guide interpretation (C14), 23. Scarcity of ice and snow landscape (C1), 24. Diversity of ice and snow landscape (C2), 25. Ice and snow festivals (C3), 26. Diversity of ice and snow culture (C4), 27. Attraction of ice and snow culture (C5).

3.4.1 The first quadrant: Advantage area

There are nine indexes in the first quadrant, which are “Sanitary conditions (C15)”, “Accommodation facilities (C19)”, “Catering facilities (C20)”, “Mobile phone signal quality in scenic spots (C22)”, “Staff service attitude (C6)”, “Scenic spot security (C7)”, “Diversity of ice and snow entertainment and sports (C8)”, “Ice and snow entertainment and sports experience (C9)” and “Efficiency of rescue services (C10)”. This distribution shows that tourists attach more importance to these nine indicators and rank them with higher degrees of satisfaction. These nine indexes belong to the factors of “Tourism Facilities (B3)” (“Sanitary conditions (C15)”, “Accommodation facilities (C19)”, “Catering facilities (C20)”, and “Mobile phone signal quality in scenic spots (C22)”) and “Tourism service (B2)” (“Staff service attitude (C6)”, “Scenic spot security (C7)”, “Diversity of ice and snow entertainment and sports (C8)”, “Ice and snow entertainment and sports experience (C9)”, and “Efficiency of rescue services (C10)”).
The tourists’ ratings of these factors show that current ice and snow tourists pay more attention to the tourism facilities and service quality of ice and snow tourism destinations, and some of the indexes have reached the level of satisfaction. Therefore, perfecting tourism facilities is one of the important actions to increase the return rate of ice and snow tourists. It can be seen that these two types of indicators are the easiest for driving tourist satisfaction and the most strongly perceived indicators of tourists, so paying attention to and improving these two types of indicators can quickly improve the satisfaction of tourists in ice and snow tourism.

3.4.2 The second quadrant: Maintenance area

There are four indexes in the second quadrant: “Professional guide interpretation (C14)”, “Scarcity of ice and snow landscape (C1)”, “Diversity of ice and snow landscape (C2)” and “Attraction of ice and snow culture (C5)”, which belong to the factors of “Tourism Service (B2)” (“Professional guide interpretation (C14)”) and “Tourism Resources (B1)” (“Scarcity of ice and snow landscape (C1)”, “Diversity of ice and snow landscape (C2)”, and “Attraction of ice and snow culture (C5)”).
This indicates that although these four indicators are not highly valued, so tourists still give a high degree of satisfaction perception under the current development condition. The destinations have met or exceeded the expectation of tourists in the guide, ice and snow landscape and the ice and snow culture aspects. Therefore, if the ice and snow tourism destinations continue to dig deeper into the ice and snow tourism resources on the premise of maintaining the existing advantages, they can bring unexpected surprises to ice and snow tourists and further improve their satisfaction.

3.4.3 The third quadrant: Opportunity area

There are 10 indexes in the third quadrant, which are: “Accommodation cost (C23)”, “Ticket cost (C24)”, “Catering cost (C25)”, “Entertainment and sports cost (C26)”, “Transportation cost (C27)”, “Rationality of dustbin distribution (C17)”, “Rationality of rest area distribution (C18)”, “Ice and snow souvenirs (C11)”, “Ice and snow festivals (C3)” and “Diversity of ice and snow culture (C4)”. Both the importance and satisfaction levels are below the mean levels for these indexes, showing that tourists have relatively low perception of their importance and satisfaction. These 10 indexes cover all four factors in the factor layer, with five of them belonging to “Tourism Cost (B4)” (“Accommodation cost (C23)”, “Ticket cost (C24)”, “Catering cost (C25)”, “Entertainment and sports cost (C26)”, and “Transportation cost (C27)”), two belonging to “Tourism Facilities (B3)” “(Rationality of dustbin distribution (C17)”, and “Rationality of rest areas distribution (C18)”), two belonging to “Tourism Sources (B1)” (“Ice and snow festivals (C3)”, and “Diversity of ice and snow culture (C4)”), and only one belonging to “Tourism Service (B2)” (“Ice and snow souvenirs (C11)”).
This shows that there is development potential for ice and snow tourism destinations in all four of these aspects. Comparatively speaking, “Tourism cost (B4)” has the greatest development potential and will affect consumers' travel decisions to a greater extent, so it should be the focus of the future improvements of ice and snow tourism destinations and also be more operable.

3.4.4 The fourth quadrant: Improvement area

Tourists attach great importance to the indexes in the fourth quadrant, but their satisfaction is at less than the average level. Therefore, managers should pay more attention to the indexes in the fourth quadrant in order to improve and perfect them according to the corresponding problems. The four indexes in this area are: “Rationality of toilet distribution (C16)”, “Transportation convenience in scenic spots (C21)”, “Accommodation comfort (C12)” and “Catering satisfaction (C13)”. They belong to the factors of “Tourism Facilities (B3)” (“Rationality of toilet distribution (C16)”, and “Transportation convenience in scenic spots (C21)”) and “Tourism Service (B2)” (“Accommodation comfort (C12)”, and “Catering satisfaction (C13)”).
This shows that up to now, although most of the infrastructure and tourism services have been recognized favorably by tourists, basic tourism facilities such as toilets and transportation, and basic tourism services such as accommodation and catering, are still the most important aspects of ice and snow tourism. It can be seen that ensuring the basic functions of ice and snow tourists is the premise of optimizing the infrastructure and tourism services in ice and snow tourism destinations.

4 The model for improving tourist satisfaction with ice and snow tourism destinations

Based on the results of tourist satisfaction with ice and snow tourism destinations, this paper combines the current development challenges faced by ice and snow tourism destinations to construct a tourist satisfaction improvement model for ice and snow tourism destinations, with the core business format of facility-service-market-management. This model is based on the diversification of the tourism business model, construction of tourism facilities, diversification of tourism services and a humanization model. The mode of market diversified cultivation is the key to the development of ice and snow tourism destinations. As can be seen in Fig. 4, the refined management mode is the gatekeeper of the overall development of the ice and snow tourism destinations and ensures their standard and efficient operation.
Fig. 4 Satisfaction improvement model for tourists in ice and snow tourism destinations
(1) Diversification of the tourism business model. Although the statistical results show that ice and snow tourists are relatively satisfied with the overall situation of the current ice and snow tourism resources, from the perspective of practice, the effective utilization rate of ice and snow culture, landscape and other resources is low. Thus, one key is to merge different travel forms to increase attraction and improve satisfaction. On one hand, continue to dig deeper into the tourism resources, extend the ice-snow tourism industry chain, actively construct “ice and snow + homestay”, “ice and snow + sports”, “ice and snow + hot spring”, to form ice and snow season tourism commerce, as well as “ice and snow+ online performing arts”, “ice and snow + cultural and creative products”, “ice and snow + education base”, “ice and snow + 5G + VR experience”, “ice and snow + culture” for supplementary options in the non-snow season. On the other hand, open up ice and snow tourism night travel programs. Attention should be paid to adapting to the local conditions, to differentiated and characteristic development roads, to exploring the combination modes of ice and snow tourism with local characteristics, and to improving the sense of gain, satisfaction and happiness of ice and snow tourists.
(2) Construction of tourism facilities. For ice and snow tourism scenic spots, sound tourism facilities are the guarantee for tourists to carry out relevant activities, and it is also one of the important factors for increasing the return rate of tourists (Shi, 2020). With the development of China's tourism industry, in addition to the functions of infrastructure, it has also put forward higher requirements for infrastructure optimization and utilization. Tourism infrastructure is the basis for the high-quality development of ice and snow tourism destinations. First, continue to improve the basic functions of tourism facilities and do good basic work in sanitation, accommodation, food and transportation. For example, optimize the ice and snow tourism and transportation service system, and improve the convenience of self-driving and shipping of skiing equipment. Second, in response to carbon peaking and carbon neutrality goals, improve the quality of ice and snow tourism facilities, and apply green and low-carbon materials and technologies in all stages of ice and snow tourism facility construction. Last, pay attention to the multi-season efficiency of tourism facilities, such as ski resorts, SPAs, hot springs, star hotels and other mature supporting facilities, so as to achieve balanced development throughout the year.
(3) A market diversified cultivation model. As a new form of tourism, the ice and snow tourism market has not yet developed to maturity. The Beijing Winter Olympic Games, in particular, will certainly bring a strong impetus to China’s ice and snow tourism. First of all, the southern market and other marginal markets should be actively cultivated. Efforts should be made to strengthen the publicity of ice and snow tourism, in order to improve the awareness of potential markets on ice and snow tourism, to actively build ice and snow tourism routes, and to encourage tourists from southern China to ski. Then, continue to subdivide the ice and snow tourism market and cultivate a broad ice and snow tourism consumer market for all ages and levels of consumption.
(4) A humanized mode of tourism service. Tourism service is the basis for the satisfaction of ice and snow tourists. China's ice and snow tourism service system is not yet mature because of the late start of the ice and snow tourism. Firstly, a government-led service system is needed, to ensure the quality of ice and snow tourism service and to perceive the individual needs of ice and snow tourists. There should also be proper participation of enterprises and the “appellation-supervisor-feedback” system should be improved. Second, improve the emergency rescue level of ice and snow tourism areas to ensure the lives and safety of tourists. Third, strengthen the training of ice and snow tourism professionals by introducing high-quality tourism talents from external and participating universities in order to cultivate compound tourism talents to improve the service skills of front-line staff. Fourth, optimize the price system of ice and snow tourism destinations, and adopt various forms of pricing, such as joint tickets between hotels and ski resorts, and joint tickets between ski resorts, so as to enhance the stickiness with tourists.
(5) A refined management model. In order to achieve the healthy and steady development of ice and snow tourism areas, overall coordination and system management is the guarantee. First, establish national and local ice and snow sports and tourism associations and clubs that are dedicated to the promotion and popularization of ice and snow sports. Second, in view of the problems that exist in the current operation and management of ice and snow tourism, a network management model should be established, which can be applied to scenic spot safety management.

5 Conclusions and discussion

5.1 Conclusions

The successful bid for the Beijing Winter Olympic Games has brought a historic opportunity to the development of ice and snow tourism in China. However, there are many problems in resource development, product design and tourism service, which seriously restrict the sustainable development of ice and snow tourism in China. The satisfaction of ice and snow tourists is related to the high-quality development of ice and snow tourism. This paper sets up a tourist satisfaction evaluation index system for ice and snow tourism destinations from the three aspects of target layer-factor layer-index layer. Taking tourists with ice and snow tourism experience as the research object, 840 valid responses were collected by a questionnaire survey, the Importance-Performance Analysis method was used to evaluate the satisfaction of tourists with ice and snow tourism destinations, and the mode for improving the satisfaction of tourists with ice and snow tourism destinations was proposed. This analysis led to three main conclusions.
(1) Ice and snow tourists in China are characterized as young and knowledgeable, with college students aged 19 to 25 as the main consumer group. More than 70% of ice and snow tourists are pretty satisfied with the current development of ice and snow destinations in China, and are willing to participate again.
(2) Other than “Ice and snow souvenirs (C11)”, tourists’ perceptions of importance are all higher than the level of perceived satisfaction, and the importance values of the 13 indicators including “Scenic spot security (C7)” and “Diversity of ice and snow entertainment and sports (C8)” are especially high, showing the tourists’ high expectations and demands for the destinations. However, the perceived satisfaction level of tourists for all indexes is generally low, being mostly at the general satisfaction level, indicating that ice and snow tourism destinations have only partially met the demand for ice and snow tourists, and there is still much room for improvement.
(3) After IPA analysis, five suggestions for improving the satisfaction of tourists in ice and snow tourism destinations are put forward, including diversification of the tourism business model, construction of tourism facilities, a market diversified cultivation model, a humanized mode of tourism service and a refined management model.

5.2 Discussion

Since the successful bid for the Beijing Winter Olympic Games, China’s ice and snow tourism has entered a stage of rapid development. The satisfaction of ice and snow tourists is an important basis for testing the current developmental quality of ice and snow tourism, and also an important issue for the sustainable development of ice and snow tourism in the future. Thus far, the satisfaction of ice and snow tourists in China has mainly been studied according to regions and scenic spots, and there is little research on the overall condition of ice and snow tourism in China. As a result, the systematic development of relevant theories, the integrity of the index system and the practicability of guiding theories are relatively weak. Due to the wide scope of ice and snow tourism, further research should be carried out on all of the different ice and snow tourism activities, such as skiing tourism, ice and snow sightseeing and glacier tourism, etc. Combining qualitative and quantitative methods can guide an in-depth exploration of the different regions and different types of ice and snow tourism destinations. This will facilitate the establishment of a complete research system for ice and snow tourism, forming related ice and snow tourism theories, and promoting the sustainable and healthy development of ice and snow tourism in the Post Beijing Olympics era in China.
[1]
Alikara B, Raffacle Z. 2011. Competitive factors of the agro-food E-commerce. Journal of Food Products Marketing, 17(2-3): 241-260.

DOI

[2]
Cai C Y, Luo P C, Tang C C, et al. 2011. An evaluation of tourists’ satisfaction degree of folk house world heritages based on IPA analysis: A case study of Yongding Hakka Earth Building in Fujian Province, China. Resources Science, 33(7): 1374-1381. (in Chinese)

[3]
Çelik S, Rasoolimanesh S M. 2021. Residents’ attitudes towards tourism, cost-benefit attitudes, and support for tourism: A pre-development perspective. Tourism Planning & Development, 2021: 1-19. DOI: 10.1080/21568316.2021.1873836.

DOI

[4]
Chen F J. 2016. An empirical study on consumer satisfaction factors of fresh e-commerce. Journal of Commercial Economics, (8): 49-51. (in Chinese)

[5]
Chen W, Zhou P, Bae K. 2020. Research on development strategy of China Ice-Snow sports tourism industry based on SWOT-AHP Model-Case study on Zhangjiakou. International Journal of Contents, 16(2): 92-101.

[6]
Clementa, Farris. 2006. An examination of the determinants of customer loyalty in mobile commerce contexts. Information & Management, 43(3): 271-282.

DOI

[7]
Cristobal E, Flavian C, Guinaliu M. 2007. Perceived e-service quality measurement validation and effects on consumer satisfaction and website loyalty. Managing Service Quality: An International Journal, 79(3): 317-340.

[8]
Dar R A, Rashid I, Romshoo S A, et al. 2014. Sustainability of winter tourism in a changing climate over Kashmir Himalaya. Environmental Monitoring and Assessment, 186(4): 2549-2562.

DOI

[9]
Deng L, Liu X L, Gao Z C, et al. 2021. Research on tourist satisfaction of Urumqi Ski Resorts based on IPA method. Journal of Wuhan Commercial Service College, 35(1): 25-31. (in Chinese)

[10]
Dong S, Li Yu, Li Jingwen, et al. 2021. Research on the comprehensiveness ice-snow development mode in China. Journal of Chinese Ecotourism, 11(6): 829-845. (in Chinese)

[11]
Gonseth C. 2013. Impact of snow variability on the Swiss winter tourism sector: Implications in an era of climate change. Climatic Change, 119(2): 307-320.

DOI

[12]
Ji L, Xiong X. 2021. Analysis on the development of snow & ice economy in Jilin Province from the perspective of soft environment. China Business & Trade, (11): 166-168. (in Chinese)

[13]
Li F, Zhang K, Du B F, et al. 2021. Scope, issues, and paths of ecological development of ice and snow tourism. Journal of Chinese Ecotourism, 11(6): 897-907. (in Chinese)

[14]
Li M M, An Y G, Huo P F, et al. 2020. Research on the integrated development of ice and snow industry and health industry-Take Genhe City and Tieli City as examples. Journal of Physics: Conference Series, 1673(1): 012070. DOI: 10.1088/1742-6596/1673/1/012070.

DOI

[15]
Liu L M, Zhou H Y, Cao L D. 2021. Research on the development direction of ice and snow tourism industry in Heilongjiang Province under the influence of COVID-19. China Economist, (4): 163-164, 167. (in Chinese)

[16]
Long Y. 2020. Evaluation of environmental attribute value of ski amusement park based on tourist satisfaction. Diss., Dalian, China: Dalian University of Technology. (in Chinese)

[17]
Lou J N, Chen X H. 2018. Tourist satisfaction and influencing factors in Harbin Ice and Snow World. Journal of Harbin Normal University (Natural Science), 34(6): 81-86. (in Chinese)

[18]
Lu L, Liu C L, Liu L. 2018. Ski tourist perceived value and satisfaction in relation to behavioral intentions: A case study of Yunding Ski Resort in Chongli. Journal of Arid Land Resources and Environment, 32(5): 202-208. (in Chinese)

[19]
Mandic A, Mrnjavac Z, Kordic L. 2018. Tourism infrastructure, recreational facilities and tourism development. Tourism and Hospitality Management, 24(1): 41-62.

DOI

[20]
Martilla J A, James J C. 1977. Importance-performance analysis. Journal of Marketing, 41(1): 77-79.

DOI

[21]
Mohammad N Y, Akhmad S, Lalu E H M. 2021. The influence of perceptions of tourism, awareness of tourism and tourism facilities on the intentions of traveling on “Gunung Tengak”. International Journal of Multicultural and Multireligious Understanding, 8(1): 227-237.

DOI

[22]
Moreno-Gené J, Daries N, Cristóbal-Fransi E, et al. 2020. Snow tourism and economic sustainability: The financial situation of ski resorts in Spain. Applied Economics, 52(52): 5726-5744.

DOI

[23]
Shao Y K, Li D, Yu Y N, et al. 2020. Destination image perception satisfaction and behavioral intention: A case study of international tourists in Xinjiang. Market Weekly, 33(9): 84-87. (in Chinese)

[24]
Shi J N. 2020. An analysis of gravity pattern of ice and snow tourism destinations under the background of region-wide tourism. Social Scientist, (6): 73-79. (in Chinese)

[25]
Shi L Y, Zhao H B, Li Y L, et al. 2015. Evaluation of Shangri-La County’s tourism resources and ecotourism carrying capacity. International Journal of Sustainable Development & World Ecology, 22(2): 103-109.

[26]
Steiger R, Posch E, Tappeiner G, et al. 2020. The impact of climate change on demand of ski tourism-A simulation study based on stated preferences. Ecological Economics, 170: 106589. DOI: 10.1016/j.ecolecon.2019.106589.

DOI

[27]
World Tourism Organization. 1979. Evaluating tourism resources. Madrid, Spain. https://www.e-unwto.org/doi/book/10.18111/9789284407576.

[28]
Wu C H-J. 2007. The impact of customer-to-customer interaction and customer homogeneity on customer satisfaction in tourism service-The service encounter prospective. Tourism Management, 28(6): 1518-1528.

DOI

[29]
Xiao J H, Wang M, Gao X. 2021. Valuing tourists’ willingness to pay for conserving the non-use values of marine tourism resources: A comparison of three archipelagic tourism destinations in China. Journal of Sustainable Tourism, 29(4): 678-710.

DOI

[30]
Xu Y D. 2020. Research on improving tourist satisfaction of ice and snow tourism resources in North-east China based on IPA analysis. China Market Marketing, (6): 23-24. (in Chinese)

[31]
Xu Y S. 2021. Development strategy of snow and ice economy in Jilin City based on SWOT analysis. China Collective Economy, (19): 30-31. (in Chinese)

[32]
Zhao Y, Zhu Q, Bai J. 2021. Fuzzy neural network-based evaluation algorithm for ice and snow tourism competitiveness. Complexity, 9980528. DOI: 10.1155/2021/9980528.

DOI

[33]
Zhou F J. 2015. Research on consumers’ purchasing behavior of organic agricultural products based on 4P marketing Theory. Journal of Commercial Economics, (29): 47-49. (in Chinese)

[34]
Zhou Y. 2020. Study on tourist satisfaction of snow and ice tourism in Liaoning Province. China Market Marketing, (28): 21-23, 194. (in Chinese)

[35]
Zhu X K, Yang X L, Xue Y S, et al. 2018. The tourist satisfaction perception and promotion strategy of ice-snow tourism in Harbin. Journal of Arid Land Resources and Environment, 32(4): 189-195. (in Chinese)

Outlines

/