
Journal of Resources and Ecology >
Does Ski Tourism Improve the Regional Economy? The Case Study of Chongli, China
|
WANG Zhe, E-mail: zhewangbsu@gmail.com |
Received date: 2021-10-15
Accepted date: 2022-01-20
Online published: 2022-06-07
Supported by
The Key Project of National Social Science Foundation of China(21ATY001)
Chongli is one of the venues for the Beijing 2022 Winter Olympics. Since 2009, the government of Chongli has emphasized the development of a tourism strategy, which gradually contributed to alleviating regional poverty. With data collected from 2009 to 2019, ski tourism and the regional economy in Chongli were analyzed using the Coupling Coordination Degree (CCD) Model. This analysis indicated, first, there were three stages in the relationship between ski tourism and the regional economy in Chongli, including weak coordination (2009-2011), starting coordination (2012-2015), and strong coordination (2016-2019). Second, sport tourism, such as ski tourism, is likely to contribute to the regional economy and alleviate poverty. Third, the case of Chongli illustrates that policy and sports events are significant for helping a place to develop sports tourism, in addition to making full use of local resources. Finally, the development of skiing tourism has had a positive impact on citizens’ and farmers’ incomes, though it may have impacted citizens more. This research suggests that regional resources are essential for the development of sport tourism and the promotion of regional economies. Developing regions should seize the bonus period of sports events and policies. More attention should be paid to the differences between urban citizens and farmers in order to establish a better redistribution system. Considering the climatic factors, more studies need to analyze the sustainability of ski tourism in developing regions.
WANG Zhe , JIANG Yiyi , LI Xinjian , WANG Ning , ZHANG Yue . Does Ski Tourism Improve the Regional Economy? The Case Study of Chongli, China[J]. Journal of Resources and Ecology, 2022 , 13(4) : 603 -612 . DOI: 10.5814/j.issn.1674-764x.2022.04.006
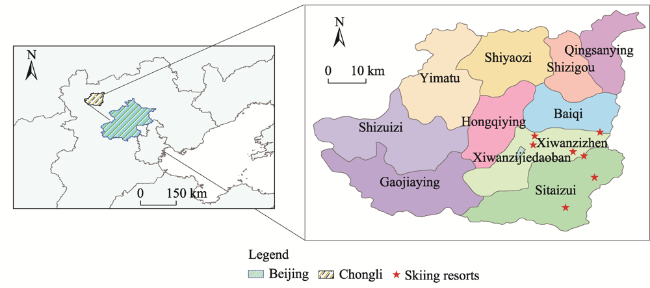
Fig. 1 Location of Chongli |
Table 1 The data for the index of the ski tourism system |
| Year | STR (million yuan) | STN (thousand people) | ASTE (yuan) |
|---|---|---|---|
| 2009 | 287 | 48.6 | 591 |
| 2010 | 408 | 68 | 600 |
| 2011 | 513 | 81.5 | 630 |
| 2012 | 670 | 101.6 | 660 |
| 2013 | 981 | 142.24 | 690 |
| 2014 | 1170 | 167 | 701 |
| 2015 | 1540 | 218.5 | 705 |
| 2016 | 1890 | 267.6 | 706 |
| 2017 | 1630 | 233 | 699 |
| 2018 | 2030 | 284.2 | 714 |
| 2019 | 1840 | 252 | 730 |
Note: STR: ski tourism revenue; STN: ski tourist number; ASTE: average ski tourist expenditures. |
Table 2 The data for the index of the regional economy system |
| Year | TGDP (million yuan) | GDP (million yuan) | IF (yuan) | IUR (yuan) | CG (million yuan) | IFA (million yuan) | LFR (million yuan) |
|---|---|---|---|---|---|---|---|
| 2009 | 480.70 | 1696 | 3106 | 11177 | 455 | 2302 | 228 |
| 2010 | 559.40 | 2329 | 3714 | 12573 | 523 | 3081 | 321 |
| 2011 | 651.52 | 3009 | 4481 | 14291 | 627 | 3548 | 501 |
| 2012 | 759.52 | 3371 | 5145 | 16192 | 710 | 4740 | 618 |
| 2013 | 813.25 | 3837 | 5979 | 18536 | 780 | 5728 | 638 |
| 2014 | 793.97 | 3840 | 6840 | 21750 | 880 | 7380 | 590 |
| 2015 | 873.35 | 3434 | 7695 | 24098 | 1004 | 7327 | 608 |
| 2016 | 1045.56 | 3385 | 8657 | 26500 | 1090 | 4720 | 648 |
| 2017 | 118.60 | 3773 | 9679 | 29371 | 1204 | 5695 | 835 |
| 2018 | 134.80 | 3434 | 10860 | 32337 | 1303 | 7096 | 1015 |
| 2019 | 185.60 | 3268 | 12120 | 35636 | 1400 | 9317 | 1083 |
Note: Source: Bureau of Statistics in Chongli, data collected from websites. TGDP: local tertiary industry gross domestic product; GDP: local GDP; IF: per capita net income for farmers; IUR: per capita disposable income for urban residents; CG: total retail sale of consumer goods; IFA: total investment in fixed assets; LFR: local financial revenue. |
Table 3 The weights of indexes |
| System | Index | Weight (%) |
|---|---|---|
| Regional economy (U1) | TGDP | 18.25 |
| GDP | 13.27 | |
| IF | 11.97 | |
| IUR | 15.33 | |
| CG | 17.53 | |
| Social IFA | 16.32 | |
| LFR | 7.52 | |
| Ski tourism U2 | STR | 37.19 |
| STN | 36.06 | |
| ASTE | 26.75 |
Table 4 The results of the CCD model |
| Year | C | T | D |
|---|---|---|---|
| 2009 | 1 | 0.01 | 0.1 |
| 2010 | 0.995 | 0.095 | 0.307 |
| 2011 | 0.997 | 0.203 | 0.45 |
| 2012 | 1 | 0.316 | 0.562 |
| 2013 | 0.995 | 0.444 | 0.664 |
| 2014 | 0.995 | 0.535 | 0.73 |
| 2015 | 0.984 | 0.627 | 0.786 |
| 2016 | 0.97 | 0.704 | 0.826 |
| 2017 | 0.998 | 0.735 | 0.856 |
| 2018 | 0.995 | 0.885 | 0.938 |
| 2019 | 1 | 0.966 | 0.983 |
Note: C represents the coupling degree, T represents the coordination degree; D represents the total effect of the level of the regional economy and ski tourism. |
Table 5 Classification scheme of CCD |
| Range of D | Coordination level |
|---|---|
| (0.0, 0.1) | 1. Extremely unbalanced status |
| [0.1, 0.2) | 2. Seriously unbalanced status |
| [0.2, 0.3) | 3. Moderately unbalanced status |
| [0.3, 0.4) | 4. Slightly unbalanced status |
| [0.4, 0.5) | 5. Barely unbalanced status |
| [0.5, 0.6) | 6. Barely balanced status |
| [0.6, 0.7) | 7. Slightly balanced status |
| [0.7, 0.8) | 8. Moderately balanced status |
| [0.8, 0.9) | 9. Favorably balanced status |
| [0.9, 1.0) | 10. Superiorly balanced status |
Note: D illustrates the total effect of the level of the two systems. |
Table 6 The relationships between the systems in Chongli from 2009-2019 |
| Year | D value | Coordination level |
|---|---|---|
| 2009 | 0.100 | 2. Seriously unbalanced status |
| 2010 | 0.307 | 4. Slightly unbalanced status |
| 2011 | 0.450 | 5. Barely unbalanced status |
| 2012 | 0.562 | 6. Barely balanced status |
| 2013 | 0.664 | 7. Slightly balanced status |
| 2014 | 0.730 | 8. Moderately balanced status |
| 2015 | 0.786 | 8. Moderately balanced status |
| 2016 | 0.826 | 9. Favorably balanced status |
| 2017 | 0.856 | 9. Favorably balanced status |
| 2018 | 0.938 | 10. Superiorly balanced status |
| 2019 | 0.983 | 10. Superiorly balanced status |
Note: D illustrates the total effect of the level of the two systems. |
Table 7 The effect of STR |
| Dependent variables | Standard Beta | t | Sig. |
|---|---|---|---|
| Income of urban residents (IUR) | 1229.139 | 9.786 | .000*** |
| Income of farmers (IF) | 438.972 | 9.151 | .000*** |
Notes: *** means Sig. value < 0.001 |
| [1] |
|
| [2] |
|
| [3] |
|
| [4] |
|
| [5] |
|
| [6] |
|
| [7] |
|
| [8] |
|
| [9] |
|
| [10] |
|
| [11] |
|
| [12] |
|
| [13] |
|
| [14] |
|
| [15] |
|
| [16] |
|
| [17] |
|
| [18] |
|
| [19] |
|
| [20] |
|
| [21] |
Statista. 2021. Travel and tourism: Share of global GDP 2000-2019. https://www.statista.com/statistics/1099933/travel-and-tourism-share-of-gdp/. Viewed on 2021-06-20.
|
| [22] |
|
| [23] |
|
| [24] |
Technavio. 2021. Sports tourism market by product, type, category, and geography-forecast and analysis 2021-2025. https://www.technavio.com/report/sports-tourism-market-industry-analysis. Viewed on 2021-06-20.
|
| [25] |
|
| [26] |
|
| [27] |
|
| [28] |
|
| [29] |
|
| [30] |
|
| [31] |
|
/
| 〈 |
|
〉 |