Development and Management of Ice and Snow Tourism in China

The Spatio-temporal Evolution of Ski Resorts in the Beijing- Tianjin-Hebei Region: Characteristics and Influencing Factors

  • WU Liyun , 1, 2, * ,
  • XU Jiayang 1, 2 ,
  • YAN Zhixin 1, 2 ,
  • GAO Shan 1, 3 ,
  • LIN Wanzhao 1, 2 ,
  • XIA Bing 4
Expand
  • 1. China Academy of Culture & Tourism, Beijing International Studies University, Beijing 100024, China
  • 2. School of Tourism Sciences, Beijing International Studies University, Beijing 100024, China
  • 3. School of Economics, Beijing International Studies University, Beijing 100024, China
  • 4. Institute of Geographic Sciences and Natural Resources Research, Chinese Academy of Sciences, Beijing 100101, China
*WU Liyun, E-mail:

Received date: 2021-10-15

  Accepted date: 2022-01-15

  Online published: 2022-06-07

Supported by

The National Natural Science Foundation of China(42071199)

Abstract

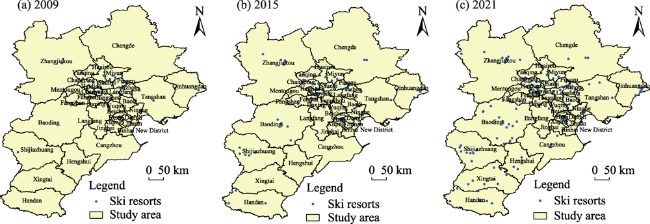
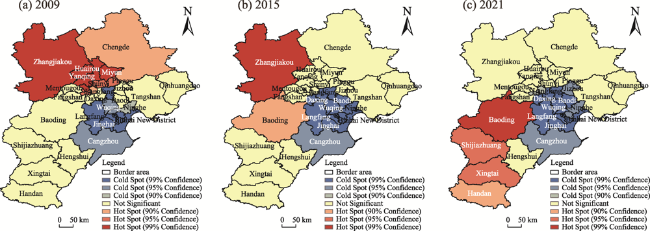
Ski resorts are one of the bases for the development of ice-snow sports and tourism, and they are also a hot topic of social concern. Taking 117 ski resorts in Beijing, Tianjin and Hebei as the research object, geospatial analysis methods such as kernel density and spatial autocorrelation were used to explore the spatial and temporal distribution patterns of the ski resorts. The geographic detector was used to deeply explore the underlying factors influencing the spatial and temporal distribution of ski resorts in terms of policy factors, natural factors and economic and social factors. This study found that the spatial and temporal distribution of ski resorts in the Beijing-Tianjin-Hebei Region showed a significant Olympic event-driven characteristic. From 2009 to 2021, the spatial pattern of Beijing-Tianjin-Hebei ski resorts has changed from “single-core development”, to a “single-core with multi-point” layout, and then to a “multi-core” layout. The spatial pattern has changed from agglomeration to diffusion. Cold and hot spots of the spatial and temporal characteristics in Beijing-Tianjin-Hebei ski resort have shifted from north to south, from the initial suburbs of Beijing to the southern cities of Baoding, Shijiazhuang, Xingtai and other cities in Hebei Province. The spatial and temporal distribution of Beijing-Tianjin-Hebei ski resorts has been influenced by many factors, from “GDP per capita” to “population density” to “policy quantity”, showing a shift from “Economic-driven” to “population-driven” to “policy-driven” processes.

Cite this article

WU Liyun , XU Jiayang , YAN Zhixin , GAO Shan , LIN Wanzhao , XIA Bing . The Spatio-temporal Evolution of Ski Resorts in the Beijing- Tianjin-Hebei Region: Characteristics and Influencing Factors[J]. Journal of Resources and Ecology, 2022 , 13(4) : 592 -602 . DOI: 10.5814/j.issn.1674-764x.2022.04.005

1 Introduction

Ski resorts are one of the foundations for developing ice-snow tourism, and they are also important for achieving the goal of “300 million people enjoy ice-snow tourism”. Beijing, Tianjin and Hebei are intensive areas of ice and snow tourism consumption. The successful bid for the Beijing Winter Olympic Games has brought new opportunities for the development of ice and snow tourism in Beijing, Tianjin and Hebei. In 2021, the Ministry of Culture and Tourism of China issued the “Ice Snow Tourism Development Plan (2021-2023)”, putting forward the development idea that takes Beijing, Tianjin and Hebei as the driving force, the northeast, north and northwest to generate synergy, and development of the southern region from multiple perspectives. Beijing, Tianjin and Hebei will become the important engine of ice-snow tourism development in the new period. In the upcoming Winter Olympics, international ice-snow sports events will be concentrated in Beijing, Tianjin and Hebei, which will bring a new boost to the development of ice-snow tourism in this area (Wu et al., 2019). Therefore, the scientific study of the spatial and temporal distribution characteristics of the existing ski resorts in Beijing, Tianjin and Hebei, and the factors that have influenced them, are of extremely far-reaching practical significance in guiding the rational spatial layout of ice-snow tourism facilities in these three regions and their synergistic development.
As an important carrier of ski tourism and sports, the construction and development of ski resorts have attracted widespread attention (Zhang et al., 2020a). In 2019, the total number of ski resorts in China reached 770 (Wu, 2020). Research on ski resorts and ski tourism has been conducted in three dimensions: industry, demand, and space. From the industrial dimension, relying on natural resources, governmental guidance and social investment, building ski industry chains and forming spatially clustered ski towns and ski leisure resorts are new paths for ski resort upgrading and development (Kan and Wang, 2016; Zhang et al., 2018; Wang, 2019; Yang et al., 2019). Recent hot topics of research attention include: image building of ski resorts (Liu et al., 2020; Reckard and Stokowski, 2021), branding activities (Liu and Dong, 2019; Liu et al., 2020), four-season development (Steiger et al., 2020; Zach et al., 2021), operations management (Ballotta et al., 2020; Steiger and Scott, 2020), industry competitiveness evaluation and enhancement (Xu and Lin, 2018), and development in the context of climate change (Morin et al., 2021; Willibald et al., 2021). From the demand dimension, the study of ski resorts has mostly focused on the psychological characteristics of ski tourists (Weng and Li, 2020), ski tourism perception (Ma et al., 2019; Seidl et al., 2021), behavioral intention (Bai and Lin, 2021) and so on, to explore how to improve the satisfaction of ski tourists. From the spatial dimension, some researchers have studied the spatial pattern of “small clusters and large dispersion” and “patchy and dotted” ski resorts in China (Wang et al., 2019), and explored the different factors influencing their distribution, such as climate resources, topography, visitor conditions, accessibility, economy, policies, sports events, and technological innovation (Sun et al., 2019; Yang, 2019; Liu et al., 2021). These studies provide research support for the rational layout of ski resorts in China. However, as the leading and most promising region for ski tourism in China, the research on ski tourism in Beijing, Tianjin and Hebei is relatively limited. The existing studies mainly focus on the synergistic development of ski events, snow and ice industries and public services in the three regions (Li and Li, 2020; Chen et al., 2021; Lin et al., 2021). However, there is a general lack of studies on the core ski areas of Beijing-Tianjin-Hebei ski industry.
Therefore, this paper uses kernel density analysis, spatial autocorrelation and geographical detectors to study the spatial and temporal evolution of ski resorts in the Beijing-Tianjin-Hebei Region and their driving factors. More specifically, the goal is to discover the dominant driving factors of the spatial and temporal evolution of ski resorts, while scientifically exploring the influences of economic, demographic and policy factors on the development of ski resorts in the Beijing-Tianjin-Hebei Region. The results of this study will offer practical guidance for optimizing the spatial layout of ski resorts, and promoting the integrated development and scientific and sustainable development of ice and snow tourism in the Beijing-Tianjin-Hebei Region. Furthermore, this study will have enlightening significance for promoting the development of ice and snow tourism with policies in various regions.

2 Data sources and research methods

2.1 Research region

The Beijing-Tianjin-Hebei Region, which includes Beijing, Tianjin and Hebei, contains 43 cities with a total regional area of 2.17×10⁵ km2. This region will be the host of the 2022 Winter Olympic Games, and its policy driven development effect can be used as a reference for other regions in promoting the development of their regional ice and snow industry in the future. At the same time, this region is a driving area for the development of China’s ice-snow sports in the strategy of “south, west and east forward expansion”, which was proposed in the “Plan for the Development of Ice Snow Tourism (2021-2023)”. Among them, Beijing and Zhangjiakou are the competition sites for the snow events of the 2022 Winter Olympics, so they are of outstanding significance in the development of ice-snow sports and tourism in China.

2.2 Data sources

In this paper, 515 ski resorts in the Beijing, Tianjin and Hebei region were crawled by Python technology, and 117 ski resorts were obtained after manual screening to eliminate invalid information, duplicate information, and indoor ski resorts with a ski simulator as the presentation format. The snowfall data were obtained from the National Centers for Environmental Information (NCEI) and the National Oceanic and Atmospheric Administration (NOAA). The DEM elevation data were obtained from the Resource and Environmental Science and Data Center of the Institute of Geographic Sciences and Resources of the Chinese Academy of Sciences, while the waterway data and traffic road data were obtained from OpenStreetMap, and the per capita GDP and population density data were obtained from the statistical yearbooks of each city for the corresponding years.

2.3 Research methods

2.3.1 Average Nearest Neighbor (ANN)

ANN was used to measure the spatial dispersion characteristics of a ski resort. It is calculated as the ratio of the observed average distance of elements to the desired average distance of elements (Long et al., 2019) as follows:
$R=\frac{\bar{D}}{R_{E}}$
$R_{E}=\frac{1}{2 \sqrt{n / A}}$
where R is the average nearest neighbor value, RE is the theoretical nearest distance, $\bar{D}$is the average distance between ski points and the nearest neighbor points, n is the number of ski resorts, and A is the area of the region. If 0<R<1, the spatial points show agglomerative distribution; if R = 1, the spatial points are randomly distributed; and if R>1, the spatial points tend to be evenly distributed.

2.3.2 Kernel density

The kernel density was used to calculate the density of elements in their surrounding neighborhoods, which reflects the relative concentration of the spatial distribution of ski areas (Mei and Jiang, 2021) and is calculated as follows:
$f(x)=\frac{\sum_{i=1}^{n} K\left(\frac{x-x_{i}}{h}\right)}{n h}$
where f (x) is the kernel density function, h is the width greater than zero, n is the number of ski areas within the bandwidth, K (*) is the spatial weight formula, and (x-xi) is the Euclidean metric between estimated point x and sample point xi.

2.3.3 Spatial autocorrelation

Spatial autocorrelation analysis measures the degrees of association and dependence of the same phenomenon or attribute within a neighboring region from the perspective of a spatial measurement. Several indices can be used to examine spatial autocorrelation. One is the global spatial autocorrelation index, which is used to measure the spatial correlation situation of the whole area, i.e., whether there is a spatial agglomeration characteristic (Zhang et al., 2020b) and it is calculated as follows:
$ I=\frac{n \sum_{i=1}^{n} \sum_{j=1}^{n} W_{i j}\left(x_{i}-\bar{x}\right)\left(x_{j}-\bar{x}\right)}{\sum_{i=1}^{n} \sum_{j=1}^{n} W_{i j} \sum_{i=1}^{n}\left(x_{i}-\bar{x}\right)^{2}}$
where I indicates the global autocorrelation coefficient, xi and xj indicate the number of ski resorts in the i-th and j-th administrative units, $\bar{x}$is the mean value, Wij is the spatial weight matrix, and n is the number of municipalities in the study area. When I is significantly positive, the distribution of ski areas in the study area is clustered; when I is negative, the spatial distribution of the ski areas is discrete.
Another index for measuring spatial autocorrelation is the Getis-Ord* index, which classifies low and high value aggregation areas into cold and hot spots based on the distance weight matrix (Xu et al., 2018).
$G_{i}^{*}=\frac{\sum_{j=1}^{n} W_{i j}(d) X_{j}}{\sum_{j=1}^{n} X_{j}} \quad(j \neq i)$
where Xj is the attribute value of the ski resort in the j-th city; n is the total number of ski resorts in the study area; and Wij(d) is the spatial adjacency weight matrix within distance d. After normalization of Gi*, the significant positive values are the hot spot areas and the significant negative values are the cold spot areas.

2.3.4 Geodetector

Geodetector is a statistical method for detecting spatial dissimilarity and revealing the driving factors. It includes Factor detection, Interaction detection, Risk detection and Ecological detection, which are expressed by q-statistic, t-statistic and F-statistic, respectively (Wang and Xu, 2017). This study focuses on factor detector analysis and interaction detector analysis, where the geographic detector values of the influencing factors are expressed as:
$q=1-\frac{\sum_{h=1}^{L} N_{h} \sigma_{h}^{2}}{N \sigma^{2}}$
where L is the classification or division of dependent variables or factors; Nh and N are the number of ski areas in the division h and the whole area, respectively; σh2andσ2are the variances of the values of the dependent variables for layer h and the whole region, respectively; and the value range of q is [0,1].

3 Characteristics and evolution of the spatial and temporal distribution of ski resorts in the Beijing-Tianjin-Hebei Region

The successful hosting of the 2008 Summer Olympics in Beijing enhanced the infrastructure settings for sports in the Beijing-Tianjin-Hebei Region, and the successful declaration of the 2015 Winter Olympics in Beijing further stimulated the development of ice and snow tourism in these three regions. This research selected the three years of 2009, 2015 and 2021, with a six-year interval, to systematically study the spatial and temporal distribution characteristics of ski resorts in the Beijing-Tianjin-Hebei Region.

3.1 Temporal evolution

From the time dimension, the distribution of ski resorts in the Beijing-Tianjin-Hebei Region has experienced an evolutionary period from being characterized by scattering to clustering, and from single point agglomeration to multi-point agglomeration, which also shows its Olympic event-driven characteristics. The earliest ski resort in the Beijing-Tianjin-Hebei Region opened in 1997. Since then, ski resorts have maintained rapid growth due to the promotion of the continuous Summer and Winter Olympic Events. The development can be divided into three stages.
The first is the pre-Summer Olympics period (1997- 2009), which is the period during which Beijing took a leading role in ski resort development in these three regions. Influenced by the successful declaration of the 2001 Summer Olympics, Beijing’s sports projects, including ski resorts, grew rapidly. During this period, the total number of ski resorts in the Beijing-Tianjin-Hebei Region was relatively small, at only 22, and 68% of them were distributed in the suburbs of Beijing. The Average Nearest Neighbor Index of R=0.94<1, P=0.59, indicates a slight clustering tendency in the spatial dimension. Although 54% of the ski resorts in Beijing emerged during this period, there was no obvious clustering. Among them, 15 ski resorts were located in 9 districts.
Fig. 1 Ski resort distributions of the Beijing-Tianjin-Hebei Region in 2009, 2015 and 2021
The second stage is the post-Summer Olympics period (2010-2015), a period in which Hebei took the lead among these three regions in the ski resort industry. In 2006, the Beijing Municipal Development and Reform Commission issued “Emergency Notice on the Suspension of New Ski Resorts”. Since then, Beijing’s ski resorts entered a new period of slow growth. Relying on the positive natural conditions and the market demand close to Beijing and Tianjin, ski resorts in Zhangjiakou, Baoding, Shijiazhuang and other cities grew rapidly. Therefore, Hebei became the region with the most ski resorts in the combined Beijing, Tianjin and Hebei area. In 2015, the average nearest neighbor index of Beijing-Tianjin-Hebei ski resorts, R=0.58<1 and P<0.001, shows a distinct spatial agglomeration.
The third stage is the winter Olympic period (2016- 2021), in which Hebei also led the development of ski resorts. In 2015, Beijing and Zhangjiakou successfully held the Winter Olympic Games together. Due to this favorable influence, ski resorts in Hebei grew rapidly and showed an obvious agglomeration tendency. In 2021, the average nearest neighbor index of Beijing-Tianjin-Hebei ski resorts was R=0.64<1, P<0.001. The clustering characteristics are significant, and the clustering was maintained and further deepened (Table 1).
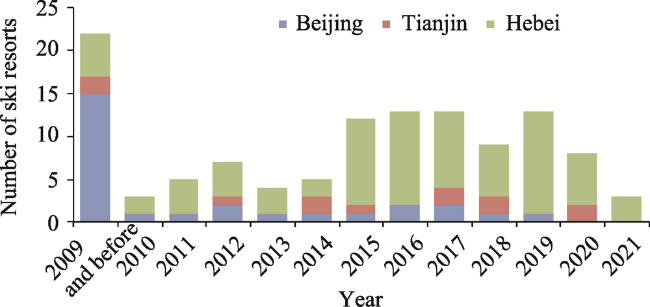
Fig. 2 Temporal change number of ski resorts in the Beijing-Tianjin-Hebei Region
Table 1 Average Nearest Neighbor index of years 2009, 2015 and 2021 in the Beijing-Tianjin-Hebei Region
Year ANN R Z-Score P
2009 0.94 -0.54 0.59
2015 0.58 -6.05 0.000
2021 0.64 -7.41 0.000

3.2 Spatial evolution

3.2.1 Kernel density analysis

The results of the kernel density analysis of the Beijing- Tianjin-Hebei ski resorts, with the help of ArcGIS10.2 software, show that the distribution of Beijing-Tianjin-Hebei ski resorts expands outward with Beijing as the initial kernel, which forms a “multi-core cluster” pattern with Beijing, Zhangjiakou and Baoding as the centers (Fig. 3). In 2009, the overall development of Beijing-Tianjin-Hebei ski resorts was slow, showing a distribution pattern of a “single-core” cluster. In addition, the number of ski resorts was concentrated in the suburbs of Beijing, which became the “engine” of the initial development stage of Beijing-Tianjin- Hebei ski industry. Tianjin ski resorts show almost no development, and only Zhangjiakou, Shijiazhuang and Tangshan in Hebei Province have a few ski resorts. In 2015, due to the growth in demand for skiing and the effect of the successful application for the Winter Olympics, the number of ski resorts in Beijing, Tianjin and Hebei rose significantly. Therefore, the spatial distribution spread from the core of Beijing to Hebei and Tianjin, showing a “single core multi-point” pattern. Zhangjiakou and Baoding are two fast-growing cities in Hebei Province, where the ski industry is developing rapidly. In 2021, as the further support for the Winter Olympic Games has continued, the layout shows a “multi-core piece” pattern. Strict control over the construction of ski resorts in Beijing has resulted in a goal of quality. Since the growth of new ski resorts is limited, this has caused the single-core effect of Beijing ski resorts to continue to decay. Influenced by the Winter Olympics, ski resorts in Hebei are rapidly improving both in quantity and quality, and new growth engines such as Zhangjiakou and Baoding have emerged. As a whole, the ski resorts in the Beijing, Tianjin and Hebei region are expanding, and in addition to the multiple kernels, several contiguous areas have also developed, such as Beijing, Baoding, Zhangjiakou, Hengshui, Xingtai, Handan, etc. Tianjin, which has no venues directly related to the Winter Olympics, is in a relatively marginal position in the Beijing-Tianjin-Hebei Region, and the ski resorts in Tianjin are in a relatively under-developed state in terms of both quantity and quality.
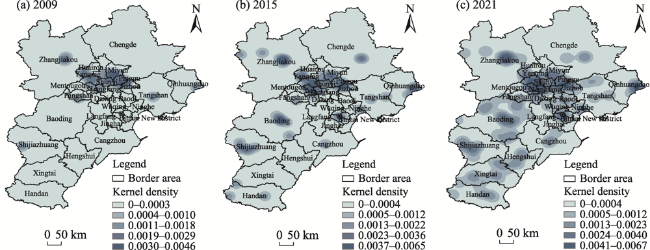
Fig. 3 Spatial evolution of ski resorts in the Beijing-Tianjin-Hebei Region (2009-2021)

3.2.2 Getis-Ord Gi* analysis of ski resorts in the Beijing- Tianjin-Hebei Region

To explore the clustering pattern of ski resorts in the Beijing-Tianjin-Hebei Region, this study used ArcGIS 10.2 to calculate the global Moran index of Beijing-Tianjin-Hebei ski resorts. Then, the Getis-Ord Gi* index values were determined, and divided into seven levels according to the natural fracture method to generate a spatial Getis-Ord Gi* distribution map of Beijing-Tianjin-Hebei ski resorts (Fig. 4). From 2009-2021, the global Moran indexes of Beijing-Tianjin-Hebei ski resorts were positive, with P < 0.01 and Z > 2.58 (Table 2), indicating that there is a significant positive spatial correlation among the ski areas and a clustering phenomenon in the spatial distribution. From the evolutionary trend, the global Moran index shows a decreasing trend from 2009 to 2021, indicating that the spatial agglomeration of ski resorts in Beijing, Tianjin and Hebei has become weaker, and there has been a growing spatial diffusion.
Fig. 4 Evolutionary process shown by the Getis-Ord Gi* analysis of the Beijing-Tianjin-Hebei Region during 2009-2021
Table 2 Global Moran’s I value in the Beijing-Tianjin-Hebei Region in 2009, 2015 and 2021
Year Moran’s I P Z-score
2009 0.31 <0.001 4.87
2015 0.25 <0.001 3.98
2021 0.24 <0.001 4.11
The spatial distribution of the Getis-Ord Gi* for Beijing-Tianjin-Hebei ski resorts shows a fluctuation, with characteristics of shifting from north to south in the spatial and temporal dimension. The track was from Beijing and Zhangjiakou to Baoding. In 2009, the hot spot fields in Beijing-Tianjin-Hebei ski resorts included the northern suburbs of Beijing, such as Yanqing, Huairou, Miyun, Changping, and Zhangjiakou, indicating that these regions had developed well and formed high value clusters spatially. In 2015, Zhangjiakou was the only hot spot city in Beijing, Tianjin and Hebei. As affected by the policy of restricting the development of ski resorts in 2006, the growth rate of Beijing’s ski resorts slowed down greatly, and Beijing residents' ski demand began to overflow to Hebei. In addition, the successful bid for the Winter Olympics further stimulated the construction of ski resorts in Zhangjiakou, therefore Zhangjiakou became the hot spot for the development of ski resorts in the Beijing-Tianjin-Hebei Region in this period. In 2021, Baoding has become the hot spot area of Beijing-Tianjin-Hebei ski resorts, with Shijiazhuang and Xingtai becoming the sub-hot areas. After the success of the Winter Olympics bid, Zhangjiakou, as one of the Winter Olympics venues, has been paying more attention to the construction of high-quality ski resorts, and the growth in the number of ski resorts has slowed down. The cities of Baoding, Shijiazhuang, Xingtai and Handan in Hebei Province began to develop ice and snow tourism under the influence of the Winter Olympics effect, and the ski resorts in these cities grew rapidly after 2015. Baoding is spatially adjacent to Zhangjiakou, so it can easily take up the overflow of the Winter Olympics effect from Zhangjiakou. Baoding has introduced a few supportive policies to promote the development of the ice and snow industry and has successfully become the national training and research base for alpine ski jumping. Under the influence of the Winter Olympics, Baoding's endogenous demand for ice and snow tourism is also growing rapidly, providing an important thrust for the growth of ski resorts. With a population density nearly four times that of Zhangjiakou, Baoding has a cluster of more than a dozen universities and a rapidly growing demand for youth-led skiing. Driven by both external and internal dynamics, Baoding became the new hotspot area for skiing in the Beijing-Tianjin-Hebei Region in 2021. In the analysis of Beijing-Tianjin-Hebei ski resorts from 2009-2021, Tianjin has always been a low concentration value area, and there has been no solution for many years. Two reasons for this are, on the one hand, Tianjin is a competition area for the Winter Olympic Games, and on the other hand, Tianjin lacks advantages in natural resources such as mountains and snowfall compared with Hebei and Beijing. These factors have made the construction and development of ski resorts in Tianjin generally slow, and it has become a cold spot area. The eastern cities of Hebei Province, Qinhuangdao and Tangshan, have always been in the cold spot area due to their long spatial distance from the core competition area of the Winter Olympic Games.

4 Analysis of the factors influencing the spatial and temporal distribution of ski resorts in the Beijing-Tianjin-Hebei Region

The spatial and temporal distribution of ski resorts in Beijing, Tianjin and Hebei is the result of multiple factors. In this paper, seven indicators are selected to represent the three different aspects of natural geography factors, economic and social factors, and policy factors (Table 3). The factors of natural geography mainly consider the natural geographical conditions on which the construction of ski resorts is based, and is represented by three indicators: altitude, snowfall and river density. The economic and social factor mainly considers the influence of economic and social development on the construction of ski resorts, and is represented by three indicators: population density, per capita GDP and road network density. The policy factor mainly considers the influence of national and local policies and is represented by one index of ice and snow related policies. The factors affecting the spatial and temporal distribution of ski resorts in Beijing, Tianjin and Hebei were then analyzed by factor detection and interaction detection with the help of Geodetector, to reveal the mechanisms influencing the spatial and temporal distribution of ski resorts in Beijing, Tianjin and Hebei.
Table 3 Influence factors of the spatial and temporal distribution in the Beijing-Tianjin-Hebei Region
Dimension Index Unit Data source
Natural geography factor Altitude m Resource and Environment Science and Data Center of China
Snowfall mm National Oceanic and Atmospheric Administration-National Centers for Environmental Information
Density of river network km km-2 OpenStreetMap
Economic and social factor Population density person km-2 Statistical Yearbooks of the cities
GDP per capita yuan person-1 Statistical Yearbooks of the cities
Density of road network m km-2 OpenStreetMap
Policy factor Number of policies number Official government websites of the cities

4.1 Factor detection results

The individual factors were analyzed using Geodetector, and the results are shown in Table 4. The analysis indicates that all of the influencing factors in the years 2009, 2015, and 2021 are significantly correlated within the 99% confidence interval. Regarding the magnitudes of the explanatory power of the factors in each year, the explanatory powers of the altitude and policy quantity have the greatest variations, while the explanatory powers of snowfall and river network density are relatively stable. The explanatory power of the road network density is relatively weak.
Table 4 Results of factor analysis in the Beijing-Tianjin-Hebei Region in 2009, 2015, 2021.
Year Indicator Natural factor Social factor Political factor
Altitude Snowfall volume River network density Population density GDP
per capita
Road network density Number of policies
2009 P value 0.000 0.000 0.000 0.000 0.000 0.000 0.000
q statistic 0.169 0.092 0.042 0.163 0.134 0.015 0.021
2015 P value 0.000 0.000 0.000 0.000 0.000 0.000 0.000
q statistic 0.275 0.343 0.201 0.305 0.189 0.187 0.474
2021 P value 0.000 0.000 0.000 0.000 0.000 0.000 0.000
q statistic 0.009 0.329 0.248 0.14 0.167 0.139 0.563
In 2009, the ranking of the explanatory power of each impact factor was: altitude > population density > GDP per capita > snowfall > river network density > policy quantity > road network density. In 2015, the ranking was: policy quantity > snowfall > population density > altitude > river network density > GDP per capita > road network density. In 2021, the ranking was: policy quantity > snowfall > river network density > GDP per capita > population density > road network density > altitude. The explanatory power of each factor changed over time for several reasons.
(1) The explanatory power ranking of the number of policies has increased significantly, indicating that policies have a great influence on the spatial and temporal distribution of ski resorts in Beijing, Tianjin and Hebei. In 2015, after China’s successful bid to host the Winter Olympics, the “Ice Snow Sports Development Plan (2016-2025)”, “National Ice Snow Venue Facilities Construction Plan (2016- 2022)”, “Ice Snow Tourism Development Plan (2021-2023)” and other political documents were published one after another to ensure the supply of ski resorts. These policies also clearly defined the leading position of Beijing, Tianjin and Hebei in the development of the national ski industry. At the local level, Beijing, Tianjin and Hebei have also issued a large number of relevant documents to promote the development of the ice-snow industry, which objectively promoted the construction and development of their ski resorts.
(2) The significant decrease in the explanatory power ranking of altitude indicates that the reliance of ski resorts in Beijing, Tianjin and Hebei on geographical factors has decreased. With the widespread application of artificial snow-making technology and the growth in the demand for recreational skiing and snow activities in urban areas, a large number of indoor and urban ski resorts have emerged. This significantly reduced the impact of an altitude drop in the mountains on the construction of ski resorts and eliminated the limitation of natural conditions on the distribution of ski resorts.
(3) Snowfall and river network density are always important factors influencing the spatial and temporal patterns of ski resorts, and consistently rank high in the explanatory powers of the factors in all years. The level of snowfall is closely related to the cost of snow-making in ski resorts. Ski resorts rely on artificial snow-making to maintain regular operation, and the distribution of river networks provides natural water sources for ski resorts.
(4) Population density, GDP per capita and road network density all have a certain influence on the spatial and temporal distribution of ski resorts. The level of social and economic development is an important driving force in the formation of the spatial pattern of ski resorts in China (Sun et al., 2019). In the early development of skiing, it was mostly popular among the middle-class community, so the layout in economically developed areas and densely populated areas provided ski resorts with more stability and high-frequency consumption. With the development of the economy and society, the spatial mobility of skiers has become stronger, and the dependence on local residents has been weakening, so the relative influences of population density and GDP per capita on the distribution of ski resorts have been decreasing. Road accessibility is one of the traffic environment indicators for the location of ski resorts (Ming et al., 2009), and a highly accessible road network can provide skiers with more convenient access and assist in expanding the radiation range of consumers. With the formation of the “one-hour traffic” in Beijing, Tianjin and Hebei, the basic traffic system is becoming more and more complete, and the transportation of people inside and outside the region is more convenient, so the influence of roads on the construction of ski resorts is becoming weaker.

4.2 Interaction detection results

On the basis of factor detection analysis, considering that the distribution of ski areas is the result of multiple factors, further analysis was conducted by interaction detectors. The results are shown in Tables 5, 6 and 7. After the interactions of all seven factors were considered, the phenomenon of enhanced explanatory power of two factors was observed. The explanatory power of any two independent variables after interaction was stronger than that of the original factors individually, which fully indicates that the spatial distribution of ski areas is the result of multiple factors.
Among the results after the interactions among factors in each year, the factor that played the most dominant role in 2009 was GDP per capita. The interaction between GDP per capita and population density was the most obvious (0.681), followed by GDP per capita and altitude (0.503), GDP per capita and snowfall (0.375), and then GDP per capita and number of policies (0.276). Overall, the interactions between other factors were weaker than the interactions between GDP per capita and the above factors, indicating that GDP per capita was the most influential factor in the spatial distribution of ski resorts in Beijing, Tianjin and Hebei in 2009. Therefore, during this period, the distribution of ski resorts was mainly driven by economic development, and local ski demand based on the level of economic development was the core driver for the growth in the number of local ski resorts.
Table 5 Results of interaction detection for the ski resorts in the Beijing-Tianjin-Hebei Region in 2009
q value GDP per capita Population density Snowfall Road network density River network density Altitude Policies
GDP per capita 0.134
Population density 0.681 0.163
Snowfall 0.375 0.298 0.092
Road network density 0.255 0.206 0.274 0.015
River network density 0.197 0.262 0.243 0.080 0.042
Altitude 0.503 0.221 0.205 0.227 0.249 0.169
Policies 0.276 0.219 0.2693 0.119 0.154 0.280 0.021
In 2015, population density was the dominant factor, followed by the number of policies. Population density had the strongest interaction with policy quantity (0.862), followed by population density and road network density (0.672), population density and river network density (0.649), and population density and GDP per capita (0.431). Overall, the interaction values between population density and these three factors were higher than their interaction values with the other factors. The interaction values between the number of policies and snowfall (0.765) and the number of policies and altitude (0.588) are much higher than their interactions with other factors. These results show that population density was the most influential factor in the spatial distribution of ski resorts in Beijing, Tianjin and Hebei in 2015, and policy quantity was the secondary factor; so the distribution of ski resorts in this period was more influenced by population and policy factors. The Beijing, Tianjin and Hebei ski markets are mainly regional demand-supported markets, so with the release of ski demand, the size of the population base around the region has become an important driving force in promoting the construction of ski resorts in a particular period.
Table 6 Results of interaction detection of ski resorts in the Beijing-Tianjin-Hebei Region in 2015
q value GDP per capita Population density Snowfall Road network density River network density Altitude Policies
GDP per capita 0.189
Population density 0.431 0.305
Snowfall 0.787 0.862 0.474
Road network density 0.591 0.672 0.548 0.187
River network density 0.691 0.649 0.765 0.458 0.343
Altitude 0.557 0.640 0.535 0.255 0.439 0.201
Policies 0.355 0.432 0.588 0.376 0.457 0.344 0.275
In 2021, the dominant influencing factor is the number of policies. The strongest interaction is between policy quantity and population density (0.935), followed by policy quantity and river network density (0.836), policy quantity and GDP per capita (0.653), policy quantity and altitude (0.600), and then policy quantity and road network density (0.596). The interactions between the above factors and other factors are all weaker than their interactions with policy quantity. This fully indicates that the number of policies is the most influential factor affecting the distribution of ski resorts in Beijing, Tianjin and Hebei in 2021. After the successful bid for the Winter Olympics, Beijing, Tianjin and Hebei Province have introduced a series of policies to promote the development of the ice and snow industry, which became the most direct impetus in promoting the construction of ski resorts, especially in Hebei Province and Tianjin City. The construction of ski resorts has entered a high frequency period since 2015.
Table 7 Results of interaction detection of ski resorts in the Beijing-Tianjin-Hebei Region in 2021
q value GDP per capita Population density Snowfall Road network density River network density Altitude Policies
GDP per capita 0.140
Population density 0.935 0.563
Snowfall 0.183 0.596 0.139
Road network density 0.789 0.706 0.448 0.329
River network density 0.318 0.836 0.273 0.715 0.248
Altitude 0.519 0.653 0.402 0.556 0.476 0.167
Policies 0.295 0.600 0.170 0.381 0.286 0.205 0.010
Based on the results of factor interaction detection, from 2009 to 2021, the factors influencing ski resort distribution in Beijing, Tianjin and Hebei have experienced a shift from “economic-driven”, and “population-driven” to “policy- driven”. The policy dividend brought by the successful bid for the Winter Olympics has become the core driver of the rapid development of ski resorts in Beijing, Tianjin and Hebei in recent years.

5 Conclusions and suggestions

This research takes Beijing, Tianjin and Hebei’s ski resorts as the object, and explores the spatial and temporal evolution of the distribution of ski resorts in Beijing, Tianjin and Hebei by using nearest neighbor index, kernel density, spatial autocorrelation and other analysis methods. Moreover, using geographic detectors to further explore the factors influencing the spatial and temporal distribution of ski resorts led to three main conclusions.
(1) Beijing-Tianjin-Hebei ski resort development showed a significant Olympic event-driven characteristic in which the leading position shifted from Beijing to Hebei. The distribution of Beijing, Tianjin and Hebei ski resorts shows a distinctive spatial and temporal distribution pattern. In shifting from the “single-core development” in 2009, to the “single-core with multi-point” in 2015, to the “multi-core” layout in 2021, Beijing, Tianjin and Hebei ski resorts are experiencing a period of transformation from agglomeration to diffusion.
(2) Affected by policy, population and other factors, the Beijing-Tianjin-Hebei ski resort cold and hot spot areas showed a spatial and temporal transfer characteristics of “north to south”, from Yanqing, Huairou, Miyun and Changping in Beijing, to Baoding, Shijiazhuang, Xingtai and other cities in southern Hebei Province.
(3) The main driving factors of the spatial and temporal distribution of ski resorts in Beijing, Tianjin and Hebei have ranged from “GDP per capita”, to “population density”, to “policy quantity”, showing an evolutionary process from “economic-driven” to “population-driven” to “policy-driven”.
In summary, the development of Beijing-Tianjin-Hebei ski resorts is not only the result of the economic and social development of the Beijing-Tianjin-Hebei Region and the demand of residents for leisure sports, but also the result of the development driven by the Winter Olympics. However, after the Winter Olympic Games are over, the event dividend will gradually disappear. Figuring out how to maintain sustainable development thereafter is the most urgent issue at present. The restrictions on the construction of ski resorts in Beijing have mainly kept the development of ski resorts stuck in the stock enhancement stage. In the future, the spatial development of Beijing, Tianjin and Hebei ski resorts will show a “east to south” trend, and the planning department needs to take the leading position in the corresponding planning. At the same time, it is important to seize the development opportunity brought by the Winter Olympic Games to promote the development of ski resorts to resort-oriented destinations and professional ski resorts in both directions. It is also important to constantly improve the consumer experience and ski professional support, in order to take the leading role in the domestic and international ski industry.
[1]
Bai Y C, Lin X P. 2021. Consumption behavior intention of mass skiing in China under the background of Winter Olympic Games: Taking Chongli as an example. Journal of Shenyang Sport University, 40(2): 77-85. (in Chinese)

[2]
Ballotta L, Fusai G, Kyriakou I, et al. 2020. Risk management of climate impact for tourism operators: An empirical analysis on ski resorts. Tourism Management, 77: 104011. DOI: 10.1016/j.tourman.2019.104011.

DOI

[3]
Chen M H, Wang Q W, Zhang S M, et al. 2021. Research on coordinated development of Beijing-Tianjin-Hebei ice and snow events under the background of the Winter Olympic Games. Journal of Xi'an Physical Education University, 38(4): 441-448. (in Chinese)

[4]
Kan J C, Wang F. 2016. Driving factors and innovation paths of skiing industry upgrading under the strategy of Winter Olympic Games in China. China Sport Science, 36(6): 11-20. (in Chinese)

[5]
Li X F, Li J M. 2020. Integration development of ice and snow industry in Beijing, Tianjin and Hebei. Sports Culture Guide, 2020(11): 20-25, 31. (in Chinese)

[6]
Lin Z G, Li S S, Wu L M. 2021. A strategic study on public service of ice-snow tourism synergetic development in the Beijing-Tianjin-Hebei Region, facilitated by the Beijing 2022 Olympic Winter Games. China Sport Science and Technology, 57(9): 20-28. (in Chinese)

[7]
Liu C H, Liu Y H, Zhao L, et al. 2020. Research on the path of the cultivation and optimization of Chinese college skiing competition brands. Journal of Harbin Sport University, 38(5): 41-46. (in Chinese)

[8]
Liu C Y, Huang J X, Wang L, et al. 2021. Spatial pattern and accessibility of Russian ski resorts. Resources Science, 43(1): 197-208. (in Chinese)

[9]
Liu W. 2020. Research on integrated marketing communication strategy of ski industry based on new media platform. China Management Informationization, 23(13): 126-127. (in Chinese)

[10]
Liu X, Dong X. 2019. The status quo and countermeasures of the market operation of college students’ alpine skiing events. China Winter Sports, 41(2): 18-23. (in Chinese)

[11]
Long F, Liu J M, Zhu H, et al. 2019. Spatial distribution of homestay and its influencing factors in the Yangtze River Delta of China. Geographical Research, 38(4): 950-960. (in Chinese)

[12]
Ma P Y, Zhang R L, Che W, et al. 2019. Study on consumers’ skiing brand personality perception and loyalty. Journal of Capital University of Physical Education and Sports, 31(2): 127-133. (in Chinese)

[13]
Mei L, Jiang H Q. 2021. The spatial differentiation process, factors and trends of B&B in Beijing based on Airbnb Data. Economic Geography, 41(3): 213-222. (in Chinese)

[14]
Ming J, Meng M, Chen X L, et al. 2009. Research on the reasonable arrangement of snow resorts in China. China Winter Sports, 31(4): 88-93. (in Chinese)

[15]
Morin S, Samacoïts R, François H, et al. 2021. Pan-European meteorological and snow indicators of climate change impact on ski tourism. Climate Services, 22: 100215. DOI: 10.1016/j.cliser.2021.100215.

DOI

[16]
Reckard M, Stokowski P A. 2021. Website discourses and tourism place meanings: Comparing ski areas and adjacent rural communities. Journal of Destination Marketing & Management, 21: 100637. DOI: 10.1016/j.jdmm.2021.100637.

DOI

[17]
Seidl M, Schlemmer P, Niedermeier M, et al. 2021. Do low-priced ski pass owners perceive a higher quality of life? A case study of the Leisure Card Tirol. Journal of Science and Medicine in Sport, 24(10): 1073-1076.

DOI

[18]
Steiger R, Posch E, Tappeiner G, et al. 2020. The impact of climate change on demand of ski tourism-A simulation study based on stated preferences. Ecological Economics, 170: 106589. DOI: 10.1016/j.ecolecon.2019.106589.

DOI

[19]
Steiger R, Scott D. 2020. Ski tourism in a warmer world: Increased adaptation and regional economic impacts in Austria. Tourism Management, 77: 104032. DOI: 10.1016/j.tourman.2019.104032.

DOI

[20]
Sun S M, Liu B, Guo Z, et al. 2019. Evolution of spatial distribution characteristics and influencing factors of skiing resorts in China since reform and opening up. Journal of Shenyang Sport University, 38(6): 8-15. (in Chinese)

[21]
Wang F. 2019. Judgment on the internal demand for upgrading of China’s ski industry in 2022 Winter Olympic Games. Journal of Shandong Sport University, 35(2): 1-6. (in Chinese)

[22]
Wang J F, Xu C D. 2017. Geodetector: Principle and prospective. Acta Geographica Sinica, 72(1): 116-134. (in Chinese)

[23]
Wang S J, Xu X W, Jie J. 2019. Spatial pattern, formation mechanism and structure optimization of China’s ski resorts. Economic Geography, 39(9): 222-231. (in Chinese)

[24]
Weng Y, Li L. 2020. Immersive interaction model: Qualitative study of the flow experience mechanism of ski consumption. Journal of Chengdu Sport University, 46(2): 78-84. (in Chinese)

[25]
Willibald F, Kotlarski S, Ebner P P, et al. 2021. Vulnerability of ski tourism towards internal climate variability and climate change in the Swiss Alps. Science of the Total Environment, 784: 147054. DOI: 10.1016/j.scitotenv.2021.147054.

DOI

[26]
Wu B. 2020. White paper on China’s ice snow industry (2019 Annual Report). https://www.sohu.com/a/376520666_5 03564. Viewed on 2021-09-20. (in Chinese)

[27]
Wu L M, Ren B G, He L X, et al. 2019. Development effect and cooperative promotion strategy of Beijing-Tianjin-Hebei ice and snow tourism promoted by Beijing Winter Olympic Games. Journal of Beijing Sport University, 42(1): 50-59. (in Chinese)

[28]
Xu B, Xiao X, Li J Z, et al. 2018. POI-based analysis on retail’s spatial hot blocks at a city level: A case study of Shenyang, China. Economic Geography, 38(5): 36-43. (in Chinese)

[29]
Xu H B, Lin X P. 2018. Research on development potential of ski resort service industry in China. Journal of Shenyang Sport University, 37(1): 7-13, 22. (in Chinese)

[30]
Yang Q F. 2019. Spatial pattern characteristics and optimization of tourism ski resorts in three provinces of Northeast China. Diss., Harbin, China: Harbin Normal University. (in Chinese)

[31]
Yang Y, Luo B Q, Feng G Y, et al. 2019. Exploration and enlightenment on international experience during the construction of skiing towns. Sports Culture Guide, 3: 82-86, 92. (in Chinese)

[32]
Zach F J, Schnitzer M, Falk M. 2021. Product diversification and isomorphism: The case of ski resorts and “me-too” innovation. Annals of Tourism Research, 90: 103267. DOI: 10.1016/j.annals.2021.103267.

DOI

[33]
Zhang R L, Zhou W J, Wang W. 2020a. Cognition, evolution and references for experiences of other countries: Research on sustainable development of ski resorts in China. Journal of Capital University of Physical Education and Sports, 32(3): 221-227. (in Chinese)

[34]
Zhang S R, Wang Y J, Ju H R, et al. 2020b. The regional differences of land border tourism development in China and influencing factors. Geographical Research, 39(2): 414-429. (in Chinese)

[35]
Zhang Y, Yuan L, Meng H. 2018. Research on social mode of ski industrial agglomeration regional in China: A regional sociology perspective. Journal of Xi’an Physical Education University, 35(6): 671-676. (in Chinese)

Outlines

/