
Journal of Resources and Ecology >
Removal Arsenic(V) Efficiency and Characteristics Using Modified Basic Oxygen Furnace Slag in Aqueous Solution
|
YANG Liyun, E-mail: Yangliyun@ustb.edu.cn |
Received date: 2021-08-06
Accepted date: 2021-12-10
Online published: 2022-04-18
Supported by
The Central Iron & Steel Research Institute(18161550A)
Basic oxygen furnace (BOF) slag, the solid waste produced in the steelmaking process, is reused in industry, agriculture and environmental treatment. However, as an adsorbent for wastewater, the removal effect of BOF slag on anionic pollutants needs to be improved. In this study, acid and alkali were used to modify BOF slag, and the removal efficiency and mechanism of arsenic(V) with modified BOF slag in solution were studied. The effects of the As(V) initial concentration, solution pH and reaction time on the removal efficiency were determined by batch experiments, and the removal mechanism of As(V) using modified BOF slag was studied by an adsorption kinetic model and isothermal adsorption model and the Fourier transform infrared spectroscopy (FTIR) and X-ray photoelectron spectroscopy (XPS) spectral analysis. The results showed that the slag modified by 15% sulfuric acid had the best removal effect on As(V), while the removal effect of As(V) by alkali-modified slag was not ideal. The removal rate of As(V) by acid-modified slag increased with the increase in the initial concentration, decreased slowly with the increase in pH and reached equilibrium in 180 min. The adsorption kinetic model and isothermal adsorption model of As(V) by acid-modified BOF slag showed that the chemical adsorption was the limiting step. The FTIR and XPS analysis results showed that the silicate and ferrite in the acid-modified slag could remove As(V) in the solution by ion exchange to form an arsenate precipitate. Therefore, modified BOF slag can be used as a potential adsorbent for large scale arsenic polluted waterbody to realize the ecological utilization of industrial solid waste.
Key words: modified BOF slag; As(V); removal efficiency; removal mechanism
YANG Liyun , GAO Mengdan , LV Yan , LI Shaojie , YANG Libing , LI Shuwu . Removal Arsenic(V) Efficiency and Characteristics Using Modified Basic Oxygen Furnace Slag in Aqueous Solution[J]. Journal of Resources and Ecology, 2022 , 13(3) : 537 -546 . DOI: 10.5814/j.issn.1674-764x.2022.03.018
Table 1 Main chemical composition of raw BOF slag (Unit: %) |
| Main chemical composition | CaO | Fe2O3 | SiO2 | MgO | MnO | Al2O3 | TiO2 | Other |
|---|---|---|---|---|---|---|---|---|
| Raw BOF slag | 40.81 | 27.59 | 18.56 | 4.53 | 2.73 | 2.81 | 0.68 | 2.30 |
Table 2 As(V) content after adsorption using alkali-modified slag |
| Mass ratio of raw slag : water : Al(OH)3 | Modified temperature (℃) | As(V) (mg L-1) | Removal rate (%) | Adsorption capacity (mg kg-1) |
|---|---|---|---|---|
| 3 : 2 : 0.3 | 700 | 0.41±0.02 | 80 | 15.90 |
| 800 | 0.48±0.02 | 76 | 15.20 | |
| 900 | 0.50±0.01 | 75 | 15.00 | |
| 3 : 2 : 0.5 | 700 | 0.46±0.04 | 77 | 15.40 |
| 800 | 0.49±0.05 | 76 | 15.20 | |
| 900 | 0.56±0.03 | 72 | 14.40 | |
| 3 : 2 : 0.7 | 700 | 0.45±0.02 | 78 | 15.60 |
| 800 | 0.53±0.04 | 74 | 14.80 | |
| 900 | 0.56±0.04 | 72 | 14.40 | |
| 3 : 2 : 0.9 | 700 | 0.44±0.02 | 78 | 15.60 |
| 800 | 0.50±0.03 | 75 | 15.00 | |
| 900 | 0.49±0.02 | 76 | 15.20 | |
| Raw slag | 0.51±0.05 | 75 | 14.90 |
Table 3 Removal rate of As(V) by acid modified slag |
| Modified type | Modified concentration (%) | Concentration of solution after adsorption (mg L-1) | Removal rate (%) | Adsorption capacity (mg kg-1) |
|---|---|---|---|---|
| HCl | 7.35 | 0.36±0.04 | 82 | 16.40 |
| 11.03 | 0.38±0.02 | 81 | 16.20 | |
| 14.70 | 0.87±0.08 | 57 | 11.40 | |
| 18.38 | 1.54±0.09 | 24 | 4.80 | |
| 22.05 | 1.62±0.12 | 19 | 3.80 | |
| H2SO4 | 10.00 | 0.28±0.03 | 86 | 17.20 |
| 15.00 | 0.21±0.02 | 90 | 18.00 | |
| 20.00 | 0.30±0.05 | 85 | 17.00 | |
| 25.00 | 0.37±0.05 | 82 | 16.40 | |
| 30.00 | 0.45±0.05 | 78 | 15.60 | |
| Raw slag | 0.51±0.05 | 75 | 14.90 |
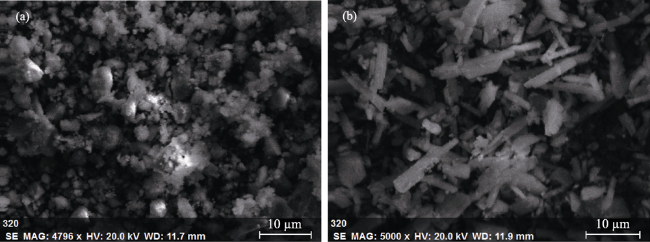
Fig. 1 SEM of raw BOF slag (a) and BOF slag modified by H2SO4 (b) |
Table 4 Main chemical composition of BOF slag modified by H2SO4 (Unit: %) |
| Sample | CaO | Fe2O3 | SiO2 | MgO | MnO | Al2O3 | TiO2 | Other |
|---|---|---|---|---|---|---|---|---|
| Modified BOF slag | 32.19 | 30.24 | 21.47 | 4.09 | 3.25 | 2.95 | 0.71 | 5.10 |
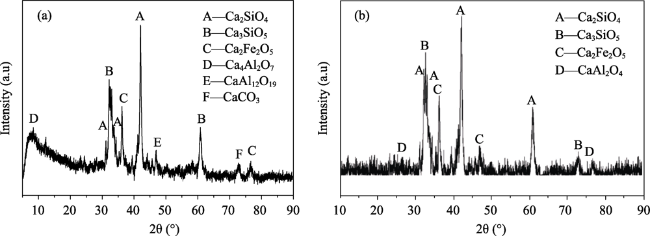
Fig. 2 XRD of the raw BOF slag (a) and BOF slag modified by H2SO4 (b) |
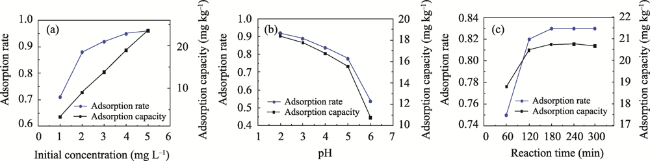
Fig. 3 Batch treatment experiments under different conditions. (a) As(V) adsorption rate and adsorption capacity at different initial concentrations; (b) As(V) adsorption rate and adsorption capacity at different pH; (c) As(V) adsorption rate and adsorption capacity at different reaction time. |
Table 5 Adsorption capacity of different modified materials for As(V) |
| Adsorbent raw material | Maximum adsorption capacity (mg kg-1) | References |
|---|---|---|
| Red mud (activated by hydrochloric acid) | 8.86 | Altundoğan et al., 2002 |
| Blast furnace slag | 1.40 | Kanel et al., 2017 |
| Magnetic Fe3O4 | 0.40 | Akin et al., 2012 |
| River sand | 0.44 | Chen et al., 2021 |
| Nano Fe2O3 Modified Diatomite | 12.38 | Yu et al., 2020 |
| Cucurbit peel modified by FeCl3 | 1.86 | Wang et al., 2017 |
| Iron loaded with waste cork particles | 4.90 | Ariana et al., 2018 |
| Acid modified slag | 21.51 | This study |
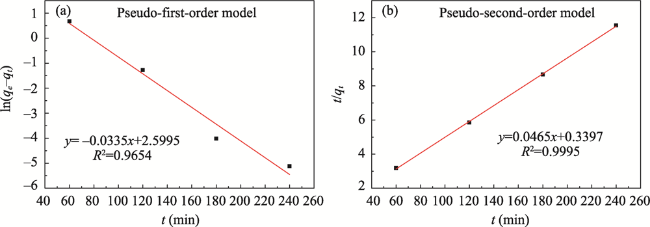
Fig. 4 The pseudo-first-order model (a) and (b) the pseudo-second-order model |
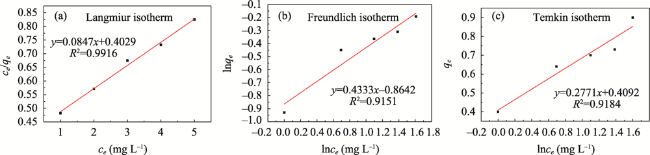
Fig. 5 The model of (a) Langmuir isotherm, (b) Freundlich isotherm and (c) Temkin isotherm. |
Table 6 The parameters of adsorption kinetics |
| Quasi first-order model | Quasi second-order model | ||||
|---|---|---|---|---|---|
| qe (mg kg-1) | K | R2 | qe (mg kg-1) | K | R2 |
| 13.460 | 0.034 | 0.965 | 21.510 | 0.006 | 0.999 |
Table 7 The parameters for adsorption kinetics |
| Langmuir | Freundlich | Temkin | ||||||
|---|---|---|---|---|---|---|---|---|
| qe | K | R2 | 1/n | K | R2 | b | K | R2 |
| 11.810 | 0.210 | 0.992 | 0.420 | 0.430 | 0.915 | 8.94 | 4.393 | 0.918 |
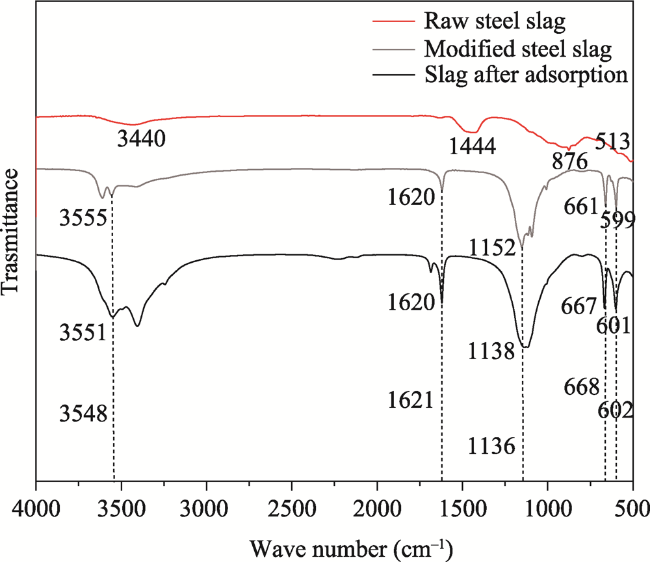
Fig. 6 FTIR spectrum of raw BOF slag, modified BOF slag and modified BOF slag after adsorption. |
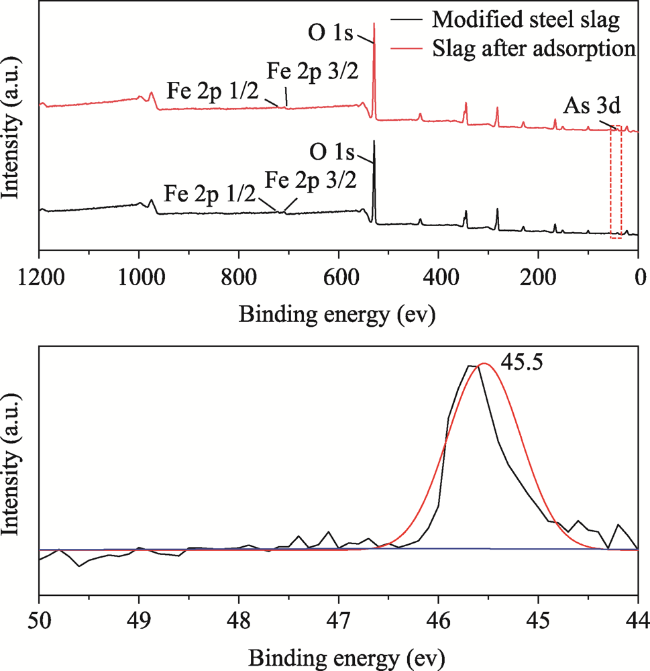
Fig. 7 XPS spectrum (a) the full scanning XPS spectrum of the modified slag before and after adsorption and (b) the As 3d spectrum after adsorption |
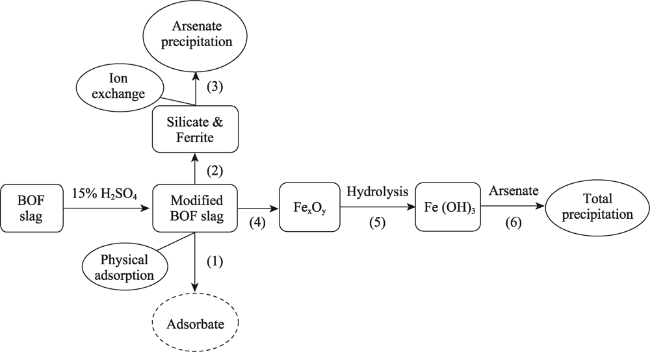
Fig. 8 The diagram of adsorption mechanism |
| [1] |
|
| [2] |
|
| [3] |
|
| [4] |
|
| [5] |
|
| [6] |
|
| [7] |
|
| [8] |
|
| [9] |
|
| [10] |
|
| [11] |
|
| [12] |
|
| [13] |
|
| [14] |
|
| [15] |
|
| [16] |
|
| [17] |
|
| [18] |
|
| [19] |
|
| [20] |
|
| [21] |
|
| [22] |
|
| [23] |
|
| [24] |
|
| [25] |
|
| [26] |
|
| [27] |
|
| [28] |
|
| [29] |
|
| [30] |
|
| [31] |
|
| [32] |
|
| [33] |
|
| [34] |
|
| [35] |
|
| [36] |
|
| [37] |
|
/
| 〈 |
|
〉 |