Some Hot Topics in Ecology and Resources Use (Guest Editors: MIN Qingwen, SHI Peili)

Selecting the Appropriate Urban Biodiversity Restoration Indices based on the Pressure-State-Response Model and a Multi-scale Management Problem Investigation in Zhuhai City

  • LI Fen ,
  • GAO Nannan , * ,
  • PENG Rui ,
  • HE Longbin ,
  • LAI Yupei ,
  • YANG Shiqi
Expand
  • Shenzhen Institute of Building Research Co., Ltd., Shenzhen, Guangdong 518049, China

LI Fen, E-mail:

Received date: 2021-08-10

  Accepted date: 2021-12-22

  Online published: 2022-04-18

Supported by

The International Cooperation Projects of Shenzhen Science and Technology Innovation Committee of China(GJHZ20190822173805220)

The International Science and Technology Cooperation Platform Construction Project from China Association for Science and Technology(2021ZZGJB071545)

Abstract

Urban biodiversity is now recognized as playing a critical role in supporting global biodiversity. However, it is important to note that biodiversity is a systematic and holistic concept and prior studies have not generally focused on cross-border or multi-scale management problems. On one hand, the ecosystems of cities are interconnected with adjacent cities by natural landscapes, so they are like mosaics instead of being isolated. Urban biodiversity research demands the consideration of the continuity within an ecosystem. On the other hand, both active protection and passive restoration strategies for urban biodiversity should not only be developed by researchers or municipal government agencies, but more importantly, they should consider the real ecosystem management problems faced by multi-scale departments in order to build a practicable Pressure-State-Response (PSR) model. The solutions for these issues should be included in the analysis to form a complete and more effective urban biodiversity strategy. The study in this paper offers an answer to whether different scales of cities or districts should adopt the same biodiversity strategy; and therefore, the decision depends on whether the places are of the same importance to the global or regional ecosystem, or whether the ecological elements are connected to the adjacent cities/districts and the problems that multiple stakeholders care about.

Cite this article

LI Fen , GAO Nannan , PENG Rui , HE Longbin , LAI Yupei , YANG Shiqi . Selecting the Appropriate Urban Biodiversity Restoration Indices based on the Pressure-State-Response Model and a Multi-scale Management Problem Investigation in Zhuhai City[J]. Journal of Resources and Ecology, 2022 , 13(3) : 518 -527 . DOI: 10.5814/j.issn.1674-764x.2022.03.016

1 Introduction

Biodiversity is an important foundation for human survival and development, and it is related to human well-being. The Ministry of Ecology and Environment of China included biodiversity indicators in the framework of comprehensive ecological quality evaluation indicators for the first time in May 2021. The UN Decade on Ecosystem Restoration, which is fundamental to achieving the Sustainable Development Goals, was declared by the UN General Assembly on 1st March 2021, and it aims to massively scale up the restoration of degraded and destroyed ecosystems as a proven measure to fight the climate crisis and enhance food security, the water supply and biodiversity (https://www.unwater.org/the-united-nations-general-assembly-declare-2021-2030-the-un-decade-on-ecosystem-restoration/). Enhancing biodiversity is the main benefit of ecosystem restoration that is considered in this paper. Ecosystem restoration is the process of assisting the recovery of an ecosystem that has been degraded, damaged, or destroyed. Ecosystem restoration efforts can be traced back to the 1830s, but the systematic study of it as a branch of ecology only began with the publication of the book “The Recovery process in damaged ecosystems” (Putwain and Cairns, 1981). The research on ecological restoration projects mainly requires project site selection, which is typically a river basin or a certain area, for the ecological restoration projects of an entire city. However, such ecological restoration projects are invariably carried out for the purpose of ecological restoration, such as the restoration of vegetation communities, forest coverage, or flood control; but there is a lack of research on urban ecological restoration projects with the main purpose of restoring biodiversity. What's more, many studies on biodiversity restoration are based on the protection of biodiversity in protected areas, and there is a lack of systematic considerations of biodiversity protection in non-protected areas such as cities.
Urban nature provides an opportunity for the people in cities to connect with nature. Understanding the urban ecosystem is critical for planning, managing, and governing urban ecosystems (McPhearson et al., 2016). Ecosystems provide various services such as mitigating atmospheric pollution, carbon sequestration, moderation of temperature and mitigation of climate change, and management of storm water (Tran et al., 2020). Land-cover and land-use based indicators are convenient for evaluating ecosystem services, but have limitations for comparative research in urban areas and may discourage new empirical, field-based research. The collection of information on department management issues is even more important in ecosystem restoration. Urban ecosystems are influenced by nonecological elements, including physical infrastructure, technology, social practices, and the cultural contexts in which people experience human-environment relations (Kremer et al., 2016). Therefore, it is time to conduct more systematic analyses beyond just considering land-cover and land-use data.
Attention should be paid to the significant gaps in both the science and policy if the Aichi targets are to be met, and if future ecosystems are to provide the range of services required to support more people sustainably (Cardinale et al., 2012). The “Pressure-State-Response” (PSR) model was promoted by the Economic Cooperation and Development (OECD) and the United Nations Environment Programme (UNEP). PSR is a framework system for studying environmental issues that was jointly developed in the 1980s and 1990s. In social-ecological system research, the PSR model has strong flexibility and practicability (Huang et al., 2011), it can integrate social and ecological evaluation indicators, and the model is often used in natural protected areas. PSR's Protection Regional applications have been extensive (Wang et al., 2019). The PSR model uses the logic of “cause-effect- response” to reflect the interactions between humans and the environment, and can better reflect the relationships between human activities, environmental issues and policies. The framework system tends to assume that the interactions between human activities and the ecological environment are linear. The PSR framework model can be adjusted according to the purpose of its use to reflect more details or specific features. For example, the United Nations Commission on Sustainable Development (UNCSD) adopts the driving force-state-response framework model to better reflect the driving force indicators in the social, economic and regulatory realms. The Driver-Pressure-State-Impacts- Response Model (DPSIR) framework used by the European Environment Agency (EEA) can be more accurate in describing the complexity of the system and the causal relationships between the elements.
In this study, we established a PSR model based on multi-scale management problem investigation and land use and land cover changes. The PSR model with the pressure, status, and response of urban biodiversity is convenient for tracking, quantitatively and intuitively expressing the pressure, status, and local responses to biodiversity changes. The response system can be combined to formulate response strategies of multiple stakeholders at all scales. It can serve as a guideline in urban ecological restoration planning.

2 Data and methods

2.1 Study area

The study area is Zhuhai City in Guangdong Province. Zhuhai City is a provincial sub-central city, a special economic zone in China approved by the State Council, a core city on the west side of the Pearl River Estuary, a coastal scenic tourist city, and an important node city in the Guangdong-Hong Kong-Macao Greater Bay Area (Central Committee of the Communist Party of China, 2019). It is located in the south-central part of Guangdong Province, in the west of Hong Kong and Shenzhen across the sea, and connects with Macau in the south. The territory area is 1736.45 km2, plus 6050 km2 of sea area. There are eight national first-class ports. It is the city with the largest ocean area, the most islands, and the longest coastline in the Pearl River Delta. According to the seventh census data, as of 1st November, 2020, the permanent population of Zhuhai City was 2.44 million (Guangdong Provincial Bureau of Statistics, 2021).
Zhuhai City has three administrative districts (Xiangzhou District, Doumen District, and Jinwan District), and five economic function zones (Hengqin New District, High-tech Industrial Development Zone, Gaolan Port Economic Zone, Wanshan Marine Development Pilot Zone, and Free Trade Zone). Zhuhai is located in the southern subtropical maritime monsoon climate zone, with sufficient light and heat resources and abundant rainfall which is beneficial to plant growth. The zonal and azonal vegetation is the southern subtropical monsoon evergreen broad-leaved forest. Zhuhai is located in an important migration area for migratory birds, which is along the paths of two international routes. The endangered bird Black-face Spoonbill appears in Zhuhai every year and Black-face Spoonbill introduction can be seen at https://www.iucnredlist.org/species/22697568/119347801).
According to the surveys conducted worldwide in 2020, the total number of Black-face Spoonbill was 4851, of which 18 were recorded on Qi'ao Island in Zhuhai in March. In the city, there are 254 vertebrate species (Table 1), accounting for 10.09% of the total species of vertebrates in China (2527 vertebrate species) and 30.87% of those in Guangdong Province (826 vertebrate species). Among them, there are 30 key protected species, one of which is a national-I level key protected species and 33 are national-II level key protected species. The main ecosystems of key protected bird species are wetland and construction land as shown in Table 2. Zhuhai has high biodiversity, but threats such as the conversions of forest land and arable land into artificial land, and natural shorelines into construction of shorelines and artificial beaches lead to the reduction of food sources for migratory birds and cause species reduction.
Table 1 Changes of species in various vertebrate groups in Zhuhai City
Categories of
vertebrate animals
Number of surveyed species Decrease Increase
2010 2018-2019
Amphibian 22 22 2 2
Reptiles 54 49 6 1
Birds 159 148 50 39
Mammals 19 17 7 5
Total 254 236 65 47

Note: Decrease represents species recorded in 2010 but not observed in the 2018-2019 survey; while increase represents species recorded in the 2018-2019 survey but not observed in 2010(① Investigation Report on the Background of Terrestrial Wild Vertebrate Resources in Zhuhai City.).

Table 2 Main locations and ecosystems of key protected birds species in Zhuhai City
Location Ecosystem Species protection level
National-II Provincial
Qi'ao Island Wetland 11 14
Hengqin Island Wetland 5 6
Huitong Village Construction land 2 4
Matou Village Construction land 3 9
Caolang Village Construction land 1 7
Hezhou north Farmland 2 5
Wuqing Village Construction land 3 5
Qingwu Village Construction land 2 3
Shalong Village Construction land 4 3

2.2 The multi-scale management survey framework

The following list of multiple stakeholders and multi-scale management problems should be taken into account when developing an urban biodiversity strategy.
(1) Global or regional biodiversity protection. Based on the integration of local scale and regional scale biodiversity goals (cross-scale management), it is necessary to identify the importance of the city land type (e.g., patch, corridor or stepping stones) for the migration and habitation of birds, fishes or other species at the global or regional scale and the management strategies/policies of the scales.
(2) Adjacent cities in the same ecosystem. It is necessary to identify whether there are ecological elements in the same ecosystem as those in adjacent cities. If there are, then the biodiversity strategies of these cities should be coordinated when developing an overall municipal protection or restoration strategy.
(3) Government agencies at the municipal level. It is necessary to have comprehensive discussions, for instance, with the water, transportation, regional planning, and other related municipal entities in order to record their problems with the past management and recommendations for the future.
(4) Government agencies at the district level. It is necessary to have discussions with the management committees of each district and their departments of the water, transportation, region planning, and other related departments.
(5) Community and residents. Investigations and surveys of the community and residents are suggested, in order to address the issues that they care about most for improving human happiness and wellbeing.

2.3 The multi-scale management of PSR model in Zhuhai City

We followed the steps of “in-depth understanding of actual management problems-remote sensing and documents data analysis-PSR model” to sort out the management problems of each related department and develop the PSR Model to further realize ecological restoration.
The Biodiversity PSR model in this paper was based on the actual problems of Zhuhai's ecosystem, rather than theoretical models (Tables 3 and 4). Through on-site investigations, panel discussions with government staff, and data collection, we obtained an in-depth understanding of the differences between the various urban departments and the actual problems faced by the departments. This knowledge is of great significance in the selection of urban biodiversity restoration indicators in the PSR model.
Table 3 Feedback on the main problems from municipal government departments
Municipal department Main problems indicated
Ecology and Environment Bureau The calculation standards, regulations, and implementation rules of ecological compensation are unsound
Bureau of Natural Resources The existing forest land is of low quality, and the construction of high-quality water source forests is expected to be included in the ecological restoration; the criteria for determining the natural shoreline after restoration shall be clarified
Housing Construction Bureau There is a conflict between green space planning and urban regulatory planning; achieving a balance between green space occupation and compensation is difficult; improvements of the refinement of management and construction are required; the specific indicators of ecological restoration must be clarified
Water Authority Part of the dikes are occupied by enterprises; management authority is not clear
Natural Resources Monitoring Center The rescue force for wild animals is weak and urgently needs to be strengthened
Mangrove Management Area The relationship between the reserve and the surrounding communities and management issues should be studied
Marine Environment Monitoring Center There are approximately 20 to 30 species of red tide organisms in the coastal waters of Zhuhai
White Dolphin Authority Chinese white dolphins are listed as Zhuhai's ecological business card; the second phase of the rescue base facilities and maintenance funds are insufficient
Table 4 Feedback on the main problems from district government departments
District department Main problem feedback
Gaolan Port District The key to the transmission system at the municipal and district levels lies in funding; indicators should consider the differentiation of each district
Doumen, Gaoxin, Jinwan and other districts The scope of river management is not clear, and there are conflicts between urban planning and land planning
Xiangzhou District The balance between green space occupancy and compensation cannot be controlled at the district-management and implementation level; the maintenance cost of landscape ponds is high
Wanshan District Law enforcement is weak, and there are no relevant regulations to support the implementation of ecological restoration projects on uninhabited islands; the plan should not restrict economic development and should not be restricted too much during the biodiversity conservation
Hengqin District Approaches of how to link with Macau and utilize ecological resources need to be considered
Toyama District The restrictive conditions and mandatory tasks for the grassroots departments should be carefully considered; the district has undertaken the city's garbage disposal, and hopes that the ecological compensation will be executed
From 1st July, 2020 to 7th August, 2020, we held panel discussions with government staff of nine Natural Resources Bureau departments, seven municipal departments, eight functional areas, and four related management committees. We conducted on-site surveys more than 20 times with drone flights and more than 60 times with physical envi ronmental temperature measurements, and collected related planning, policies and regulations, standards, the current land use data, the basic information of wild animals, plants and birds, and the seabird ecological corridor construction plan.
It can be seen that the main problems are about funding issues, the balance of the occupation of green land and compensation, and the differentiation of conditions in each district.

2.4 PSR model of biodiversity conservation in Zhuhai City

In order to quantify the urban biodiversity status of Zhuhai City, we first established a PSR model framework. On the basis of this framework, we established a PSR model according to urbanization, land use changes, and vegetation changes during 1999-2018. Based on the multi-scale management problem investigation of Zhuhai City, this research analyzed the Pressure, State and Response of its biodiversity as shown in Fig. 1. From the aspects of the potential causes of urban biodiversity problems and the potential for improvement, as well as the status quo of Zhuhai's environment, ecological space and biodiversity, the relationships between the economy, society and the natural environment are established in the PSR model in order to respond to the urban biodiversity crises.
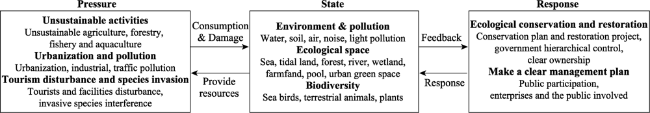
Fig. 1 Conceptual diagram of the PSR model of biodiversity conservation in Zhuhai City

3 State and pressure of biodiversity in Zhuhai City

3.1 Ecosystem states and biodiversity pressure

3.1.1 Ecosystem state

Zhuhai is one of the most livable cities in China, and it has good air quality. In 2018, the primary air pollutant was fine particulate matter (PM2.5), with an annual average value of 27 µg m-3, which represented a decrease of 10.0% from 2017. However, some inland rivers flowing through the city have serious domestic pollution issues. There are still 17 black odor water bodies and 53 problematic rivers in Zhuhai, and the river banks are mostly concrete which need re-meandering (i.e. bringing back the curves of a natural river) to maintain and improve conditions for biodiversity (Kristensen et al., 2014). In recent years, large-scale urban development and construction in Zhuhai has caused high levels of light pollution and noise pollution which are also harmful to biodiversity.
The wetland area is about 1837.82 km2, and the wetland rate is about 106.09% according to definition of wetlands in the Ramsar Convention on Wetlands. Zhuhai has the most typical subtropical-tropical transitional coastal-inland wetland ecosystem in China. The mountain area of Zhuhai is about 421.39 km2, accounting for 24.26% of the land area and 88.03% of the forest area. There are two forest parks and eight nature reserves in Zhuhai (Table 5). In total, there are 504 rivers, 82 mountain ponds and reservoirs, and 22 lakes. Specific places that are rich in biodiversity are protected as nature reserve areas such as nature reserves, forest parks and wetland parks.
Table 5 Planned wetland parks in Zhuhai City
No. Name Area (ha) Protection level
1 Hengqin National Wetland Park 327.4 National level
2 Huafashui County Provincial Wetland Park 67.0 Provincial level
3 Qi'ao Mangrove Wetland Park 460.0 District level
4 Hengqin Coastal Wetland Park 60.0 District level
5 Nanhu Lake Wetland Park 70.0 District level
6 Dongwan Wetland Park 12.0 District level
7 Shili Lianjiang Wetland Park 33.4 District level
8 Damenkou Wetland Park 95.0 District level
9 Huangyanghe Wetland Park 40.0 County level
10 Jinwan Central River Wetland Park 18.8 County level
The farmland area in Zhuhai City is about 568.08 km2, accounting for 32.70% of the land area (including islands). There are 262 islands in Zhuhai City, including 10 residential islands and 252 uninhabited islands. The total length of the mainland coastline of Zhuhai City is 235.07 km. The natural coastline rate is only 10.00%, which is far lower than the 35% rate that is required for Guangdong province's natural coastline by the Guangdong Coastal Zone Protection and Development Plan. Zhuhai City is rich in ecological patches, with 516 wetland patches. In addition to the planned wetland parks listed in Table 5, there are other important wetlands, such as Jichaomen Mangroves and Tangjiawan Seagrass Beds, that are not included in the nature reserve system.

3.1.2 Biodiversity pressure

The biodiversity pressure in Zhuhai was analyzed from the perspectives of urbanization, land use change, vegetation change, climate change and the invasive species situation.
Zhuhai's total population increased from 1.6341 million in 2015 to 2.0237 million in 2019, and the urbanization rate increased from 88.07% to 90.72%. In 2017, the urban and rural construction land area in Zhuhai was 322.51 km² in total; and in 2020, it was 393 km², representing an increase of 22% in four years. The building construction area increased 62.37% during 2015-2019, and the construction land and building construction area has expanded dramatically in the past few years (Fig. 2 and Table 6). Zhuhai's urban construction has caused a lot of ecological problems, such as air pollution, water pollution, and forest degradation, which have caused biodiversity loss especially in the urban area. At the same time, Zhuhai is subject to the influx of external pollution from upstream or adjacent cities. As a result, maintaining Zhuhai's biodiversity faces many challenges.
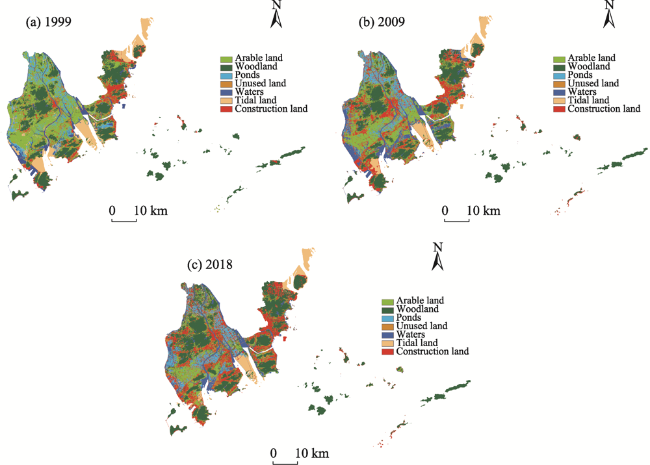
Fig. 2 Land cover/land use changes in Zhuhai City from 1999-2018
Table 6 Land cover/land use statistics in Zhuhai City
Land use type 1999 (km2) 2009 (km2) 2018 (km2)
Arable land 539.7993 427.2948 230.7276
Woodland 513.4698 505.1610 655.2864
Construction land 166.0491 336.8313 358.5105
Unused land 35.8002 6.8040 74.5146
Ponds 144.819 144.4491 156.8709
Waters 129.5649 202.4496 138.9474
Tidal land 206.2611 119.9592 128.0691
In the 1990s, researchers found that nearly a thousand seagulls and plovers gathered on the north eastern beaches of the Qi'ao Reserve in Zhuhai. There were also thousands of migratory birds such as geese and duck living in the western, central and northern regions. The Qi'ao Reserve contained the breeding grounds for thousands of egrets near the mountain. However, these birds and the breeding grounds have basically disappeared, and only a small number of gulls can be found there currently. There are hundreds of wild ducks overwintering in the periphery of the reserve. There are also hundreds of herons breeding, but only in the southwestern part. Bird species and their numbers in the reserve area are still fewer than in other similar reserve areas. Due to the artificial breeding, pollution in the offshore waters, and increased intensity of the construction and development of surrounding cities, the habitat area of the birds has decreased, and in turn, the number of birds has decreased.
The area of forest land increased by about 7.73% during the urbanization of Zhuhai from 1999 to 2018, according to the Landsat interpretation results. The ecological space area is 1384 km2 including arable landland, plantation land, woodland, pasture, other agricultural land, wetlands, other natural reserves, land waters, etc., accounting for 79% of the land area of Zhuhai City. This large area is conducive to the restoration of biodiversity. At the same time, the arable land and tidal flats decreased, especially the area of tidal flats that are important to marine life such as waterbirds, which was reduced by 5.06%.
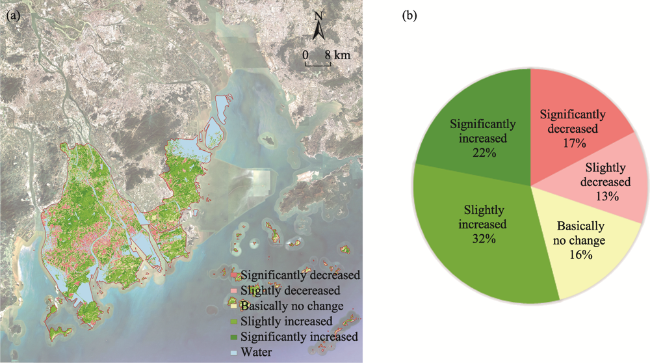
Fig. 3 NDVI (vegetation coverage) changes between 1999 and 2018. (a) Map of NDVI (vegetation coverage) change between 1999 and 2018; (b) Comparison of NDVI (vegetation coverage) change rates by area proportions in Zhuhai City.
From the Landsat Normalized Difference Vegetation Index (NDVI) calculation (https://www.usgs.gov/core-science-systems/nli/landsat/landsat-normalized-difference-vegetation-index), the overall vegetation coverage has improved through the efforts of the Zhuhai government projects for the afforestation and restoration of hills and wastelands. The vegetation of forests and the eastern urban areas has been significantly optimized, but the quality of the vegetation in non-mountainous areas in the central and western regions has declined during 1999-2018.
From 2013 to 2017, the proportions of sea areas with sea water quality at the fourth level (polluted) and inferior fourth level (severely polluted) of the “GB 3097-1997 Sea Water Quality Standard” were still at a high proportion (over 50%) (Ministry of Ecology and Environment of the people's republic of China, 1998). There are many illegal fishery and fishing activities in the surrounding area of Qi'ao Island and off the coast of Jinwan District, causing pollution of the coastal waters and severe damage to the habitats in the coastal waters. The Pearl River Estuary Chinese White Dolphin National Nature Reserve in Qi'ao Island has the problem of white dolphin population aging and southward migration, and the poor water quality of the Pearl River Estuary has caused the problem of heavy metal accumulation in the white dolphins there.
The main disastrous climatic events in Zhuhai are typhoons and heavy rains. Typhoon Hato (1713) in 2017 and Super Typhoon Mangkhut (1822) in 2018 caused great damage to Zhuhai. Large numbers of logistical and human flows in Zhuhai make it vulnerable to typhoons and secondary disasters. The main disasters of heavy rain and storms caused by typhoons may affect biodiversity (Chi et al., 2015).

3.2 Biodiversity restoration indices based on the PSR model in Zhuhai City

3.2.1 The PSR model according to historical, current, and planned investigations

According to land use change, NDVI change, the feedback on the main problems from the multi-level government survey, and document data collation, and considering the Ecosystem state and Biodiversity pressure, we established the Zhuhai biodiversity restoration indices based on the PSR model as listed in Tables 7-9.
Table 7 Biodiversity pressure indicators
Category No. Indices Explanation
Human activities 1 1-1 Agriculture, aquaculture, forestry management Human activities
1-2 Livestock and poultry farms (households) in the restricted area
1-3 Increase in the use of pesticides and fertilizers (%)
1-4 Proportion of restricted areas in tidal flat (%)
2 Increased permanent residents per year Population pressure
3 Annual number of tourists Tourist pressure
Urbanization and pollution 4 Land consumption per 10000 yuan of GDP (m2) Construction occupation
5 5-1 Percentage of sewage discharge up to the standard (%) Impact of sewage discharge
5-2 Domestic sewage treatment rate
5-3 Industrial wastewater discharge rate
6 Harmless treatment rate of domestic garbage (%) Environmental pollution from garbage
7 7-1 Noise level (%) Noise impact of urban construction
7-2 Daytime noise level
7-3 Nighttime noise level
Climate change and species invasion 8 Local woody plant index The ability to adapt and respond to climate change
9 The number of invasive alien species Invasive alien species threat
Table 8 Biodiversity status indicators
Category No. Indices Explanation
Environment 10 Air Quality Index (AQI) Air condition
11 Water quality up to the standard rate of important rivers and lakes (%) Aquatic animal and plant growth conditions
12 Proportion of coastal waters with good water quality Growth conditions for marine aquatic animals and plants
Ecological space 13 Permanent protected farmland area (km2) Farmland Habitat
14 Forest coverage rate Forest and grass Habitat
15 15-1 Wetland rate (%) Wetland Habitat
15-2 Terrestrial wetland area
15-3 Coastal Mangrove wetland area
16 Green area rate of urban built-up area (%) Urban ecological space Habitat
Biodiversity 17 Comprehensive species index Urban biodiversity
18 Species richness Biodiversity of the city
Table 9 Biodiversity response indicators
Category No. Indices Explanation
Ecological conservation and restoration projects 19 Ecological restoration area of damaged mountains (km2) Aimed at the problem of bare mountains
20 Ecological shoreline restoration rate (%) Aimed at the problem of river or sea shoreline improvement
21 The proportion of land used for ecological protection (%) Responding to the systematic protection of “Convention on Biological Diversity”
Government
hierarchical control, clear ownership
22 Ecological restoration plan Ecological network
23 Proportion of total fiscal revenue for ecological compensation revenue (%) Protect compensation and increase implementation
24 Environmental protection investment as a percentage of GDP (%) Capital investment
Grassroots and public participation 25 The proportion of government leaders participating in ecological restoration training (%) Government participating
26 Participation of the public and enterprises in ecological restoration (%) Public and enterprises participating

3.2.2 Data availability

We considered data that are open and updated regularly, such as Five-Year Plan for the Development, Economic and Social Development Statistical Bulletin, and the Zhuhai City Livable City Construction Index System Database, as the sources of statistics. The statistics departments are also given for each index. After confirming with each government department, the statistical department of each indicator is given to ensure that the data source of the indicator is clear (Table 10). The availability of data is related to whether the PSR model can regularly check on the improvement of biodiversity and its habitat in Zhuhai City.
Table 10 Data sources and statistics departments of the PSR model in Zhuhai City
Index Sources of statistics Statistics department
Agriculture, aquaculture, forestry management The 13th Five-Year Plan for the Development of Modern Agriculture in Zhuhai City Agriculture and Rural Affairs Bureau
Increased permanent residents per year Statistical Yearbook Bureau of Statistics
Annual number of tourists Statistics of Zhuhai City's Tourism Reception in 2020 Culture, Radio, Television, Tourism and Sports Bureau
Land consumption per 10000 yuan of GDP (m2) Land consumption: The Land Change Survey in 2018; GDP: Zhuhai Municipal National Economic and Social Development Statistical Bulletin Bureau of Natural Resources, Bureau of Statistics
Percentage of sewage discharge up to the standard (%) The 13th Five-Year Plan for Environmental Protection and Ecological Construction of Zhuhai City Ecology and Environment Bureau
Harmless treatment rate of domestic garbage (%) Zhuhai Livable City Construction Index System Database Bureau of Urban Management and Comprehensive Enforcement
Noise level (%) Environmental Quality of Zhuhai City in 2019 Ecology and Environment Bureau
Local woody plant index Zhuhai Livable City Construction Index System Database Bureau of Urban Management and Comprehensive Enforcement
The number of invasive alien species Investigation of Invasive Alien Plants in the Sea (Mikania micrantha, Spartina alterniflora, etc.) Wildlife Conservation Institute
Air Quality Index (AQI) The 13th Five-Year Plan for Ecological Civilization of Zhuhai Ecology and Environment Bureau
Water quality up to the standard rate of important rivers and lakes (%) Environmental Quality of Zhuhai City in 2019 Water Authority
Proportion of coastal waters with good water quality Implementation Plan for Prevention and Control of Pollution in Coastal Waters of Guangdong Province Ecology and Environment Bureau
Permanent protected farmland area (km2) The Third National Land Survey Natural Resources Bureau
Forest coverage rate Zhuhai Forest Resources Archives Database; Zhuhai Forest Resources Second Class Investigation Report Bureau of Urban Management and Comprehensive Enforcement
Wetland rate (%) The Third National Land Survey Natural Resources Bureau
Green area rate of urban built-up area (%) 2018 Zhuhai National Economic and Social Development Statistical Communiqué Zhuhai Municipal People's Government
Comprehensive species index Statistical Indicators of National Ecological Garden City Bureau of Urban Management and Comprehensive Enforcement
Species richness National Ecological Civilization Construction Demonstration Cities and Counties Construction Indicators City Wildlife Conservation Office
Ecological restoration area of damaged mountains (km2) Statistical Indicators of National Ecological Garden City Bureau of Urban Management and Comprehensive Enforcement
Ecological shoreline restoration rate (%) Special Integrated Plan for Sponge City Drainage in Zhuhai City (2018-2030) Natural Resources Bureau
The proportion of land used for ecological protection (%) National Ecological Civilization Construction Demonstration Cities and Counties Construction Indicators Natural Resources Bureau
Ecological restoration and ecological network construction planning China Biodiversity Conservation Strategy and Action Plan Natural Resources Bureau
Proportion of total fiscal revenue for ecological compensation revenue (%) Measures of Zhuhai City on Fiscal Balanced Transfer Payments; Measures of Zhuhai City on Fiscal Ecological Protection Transfer Payments Finance Bureau
Environmental protection investment as a percentage of GDP (%) The 13th Five-Year Plan for Environmental Protection and Ecological Construction of Zhuhai City Bureau of Ecology and Environment, Bureau of Statistics
The proportion of government leaders participating in ecological restoration training (%) Refer to the National Ecological Civilization Construction Model Cities and Counties Construction Indicators Ecology and Environment Bureau
Participation of the public and enterprises in ecological restoration (%) Refer to the National Ecological Civilization Construction Model Cities and Counties Construction Indicators Ecology and Environment Bureau

4 Recommendations for policy, practice, and future research

Biodiversity is declining at an unprecedented rate worldwide (IPBES, 2019). The current study found that with accelerating declines in biodiversity and profound land-use changes, biodiversity conservation is a strategy for both people and nature (Marselle et al., 2021). The key to biodiversity restoration and ecosystem management is that the PSR model indices should be divided into zones, such as those with a high biodiversity and a low intensity of land use, rural areas, built-up areas and the transmission system between municipal and district levels. This is consistent with the study by Schneiders et al. (2012) which found that the concept of divisions can help to facilitate the discussion of a joint achievement of the goals for biodiversity and ecosystem services in the field. At the municipal and district levels, one important management limitation is funding. The Proportion of total fiscal revenue for ecological compensation revenue (%) and Environmental protection investment as a percentage of GDP (%) were included in the response indices in this study, while Fu and co-authors did not take funding into account (e.g., Fu et al., 2017); while Xu et al. (2016) only considered capital investments in natural forest resource protection projects, wildlife protection and nature reserve construction projects, and wetland protection projects as Biodiversity-related Funding in a study on Assessing China's progress toward the 2020 Global Biodiversity Targets. At the municipal and district levels, the funding is not nearly enough to help biodiversity restoration. The Environmental protection investment takes environmental pollution prevention and control, ecological protection, and construction investment into account. Furthermore, ecological compensation is also considered in this study. It is a positive conservation action that is required to counter-balance the ecological values lost in the context of development or resource use, and it is an intentional form of trade-off (Morrison-Saunders and Pope, 2013).
Government efforts should take social and economic benefits and the differentiation of each district into consideration.
Wetlands support many different ecosystem services, including coastal protection and flood control. Coastal wetlands in China provide critical breeding, stopover, and wintering sites for various birds (Yang et al., 2017). However, most current ecological restorations are man-made landscapes. One recommendation is to focus on natural restoration and strengthen the construction of wetlands and coastal shelterbelts, since ecological restoration should consider the stability and sustainability of the natural ecosystem. Moreover, in the case of ecological restoration, the anthropogenic pollutants in coastal water should be removed and the man-made shoreline should be made more ecological. Taking ecology, economy, and society into account, integrated functions should be made for restoration projects.

5 Conclusions

As an urgent task for urbanization development, urban biodiversity conservation is an inevitable requirement for urban ecological security. Compared with other papers on a similar topic, this paper has paid more attention to the problems faced by ecosystem management departments of governments at multiple levels by building a Biodiversity PSR model.
In this paper, the solutions to these problems have been included in the analysis, and indicators have been selected as comprehensively as possible, by which the basis for forming a complete and operable urban biodiversity strategy has been provided. As a key source of available data, the sources of statistics and statistics departments have made the model practical.
[1]
Cairns J Jr. 1981. The recovery process in damaged ecosystems. Journal of Ecology, 69(3): 1062-1063.

[2]
Cardinale B J, Duffy J E, Gonzalez A, et al. 2012. Biodiversity loss and its impact on humanity. Nature, 486(7401): 59-67.

DOI

[3]
Central Committee of the Communist Party of China. 2019. Outline development plan for the Guangdong-Hong Kong-Macao Greater Bay Area. https://www.bayarea.gov.hk/en/outline/plan.html.

[4]
Chi C H, McEwan R W, Chang C T, et al. 2015. Typhoon disturbance mediates elevational patterns of forest structure, but not species diversity, in humid monsoon Asia. Ecosystems, 18(8): 1410-1423.

DOI

[5]
Fu B J, Yu D D, Lv N. 2017. An indicator system for biodiversity and ecosystem services evaluation in China. Acta Ecologica Sinica, 37(2): 341-348. (in Chinese)

[6]
Guangdong Provincial Bureau of Statistics. 2021. Communiqué of the Seventh National Census of Guangdong Province (No. 2). ttp://stats.gd.gov.cn/attachment/0/421/421309/3283428.pdf.

[7]
Huang H F, Kuo J, Lo S L. 2011. Review of PSR framework and development of a DPSIR model to assess greenhouse effect in Taiwan. Environmental Monitoring and Assessment, 177(1-4): 623-635.

DOI

[8]
IPBES. 2019. Global assessment report on biodiversity and ecosystem services. https://www.eaere.org/policy/ecosystems-biodiversity/ipbes-2019-global-assessment-report-on-biodiversity-and-ecosystem-services/.

[9]
Kremer P, Hamstead Z, Haase D, et al. 2016. Key insights for the future of urban ecosystem services research. Ecology and Society, 21(2): art29. DOI: 10.5751/ES-08445-210229.

DOI

[10]
Kristensen E A, Kronvang B, Wiberg-Larsen P, et al. 2014. 10 years after the largest river restoration project in Northern Europe: Hydromorphological changes on multiple scales in River Skjern. Ecological Engineering, 66: 141-149.

DOI

[11]
Marselle M R, Hartig T, Cox D T C, et al. 2021. Pathways linking biodiversity to human health: A conceptual framework. Environment International, 150: 106420. DOI: 10.1016/j.envint.2021.106420.

DOI

[12]
McPhearson T, Pickett S T A, Grimm N B, et al. 2016. Advancing urban ecology toward a science of cities. BioScience, 66(3): 198-212.

DOI

[13]
Ministry of Ecology and Environment of the People's Republic of China. 1998. Sea water quality standard (GB 3097-1997). http://mee.gov.cn/ywgz/fgbz/bz/bzwb/shjbh/shjzlbz/199807/t19980701_66499.shtml. 1998-07-01. (in Chinese)

[14]
Morrison-Saunders A, Pope J. 2013. Conceptualising and managing trade-offs in sustainability assessment. Environmental Impact Assessment Review, 38: 54-63.

DOI

[15]
Schneiders A, van Daele T, van Landuyt W, et al. 2012. Biodiversity and ecosystem services: Complementary approaches for ecosystem management? Ecological Indicators, 21: 123-133.

DOI

[16]
Tran T J, Helmus M R, Behm J E. 2020. Green infrastructure space and traits (GIST) model: Integrating green infrastructure spatial placement and plant traits to maximize multifunctionality. Urban Forestry & Urban Greening, 49: 126635. DOI: 10.1016/j.ufug.2020.126635.

DOI

[17]
Wang G P, Min Q W, Ding L B, et al. 2019. Comprehensive disaster risk assessment index system for national parks based on the PSR model. Acta Ecologica Sinica, 39(22): 8232-8244. (in Chinese)

[18]
Xu H G, Ding H, Ouyang Z Y, et al. 2016. Assessing China's progress toward the 2020 global biodiversity targets. Acta Ecologica Sinica, 36(13): 3847-3858. (in Chinese)

[19]
Yang H, Ma M G, Thompson J R, et al. 2017. Protect coastal wetlands in China to save endangered migratory birds. Proceedings of the National Academy of Sciences of the USA, 114(28): E5491-E5492.

Outlines

/