Ecosystem Assessment

New Framework for Evaluating Ecosystem Quality in Nature Reserves based on Ideal References and Key Indicators

  • WU Zhenliang , 1 ,
  • HOU Jihua , 1, * ,
  • XU Li 2 ,
  • HE Nianpeng , 2, 3, 4, *
Expand
  • 1. School of Ecology and Nature Conservation, Beijing Forestry University, Beijing 100083, China
  • 2. Key Laboratory of Ecosystem Network Observation and Modeling, Institute of Geographic Sciences and Natural Resources Research, Chinese Academy of Sciences, Beijing 100101, China
  • 3. College of Resources and Environment, University of Chinese Academy of Sciences, Beijing 100049, China
  • 4. Key Laboratory of Vegetation Ecology of Ministry of Education, Northeast Normal University, Changchun 130024, China
*HOU Jihua, E-mail: ;
HE Nianpeng, E-mail:

WU Zhenliang, E-mail:

Received date: 2021-01-09

  Accepted date: 2021-05-09

  Online published: 2022-04-18

Supported by

The Chinese Academy of Sciences Strategic Priority Research Program(XDA23080401)

The National Natural Science Foundation of China(32171544)

The National Natural Science Foundation of China(31988102)

Abstract

With increasing numbers and types of nature reserves (NRs), objective evaluation and comparison of the effects of different nature NRs on conservation efforts are of great importance for protecting species diversity, ensuring reasonable national economic input, and adjusting government management schemes. Developing a method for the combined assessment of flagship or umbrella species and ecosystem quality will improve the evaluation of NRs. However, it is also important to establish a new framework for rapid evaluation of ecosystem quality, supported by the advantages of scientific, economic, and regular principles. Here, we proposed a new framework that incorporates the novel concept of ideal references into evaluation systems, which will facilitate the comparison of results from different periods and regions. Furthermore, from the perspective of making the framework as objective, rapid, and economical as possible, we recommended some key ecological indicators, such as net primary productivity, soil organic matter, plant diversity, for use in the new evaluation framework. The new framework, referred to as “ideal reference and key indicators” (IRKI), can sufficiently meet the requirements for the rapid evaluation of ecosystem quality both regionally and nationally. Furthermore, IRKI can identify the restoration potential and restoration periods of NRs, thus facilitating the rational distribution of resources and enhancing the protective effect. There are many types of NRs in China, and it is necessary to partially alter the assessment methods or parameters for different types of NRs. Overall, IRKI provides a simple, clear, and comparable framework that will strongly enhance the conservation of protected areas (PAs) and facilitate the standardization of management practices.

Cite this article

WU Zhenliang , HOU Jihua , XU Li , HE Nianpeng . New Framework for Evaluating Ecosystem Quality in Nature Reserves based on Ideal References and Key Indicators[J]. Journal of Resources and Ecology, 2022 , 13(3) : 466 -475 . DOI: 10.5814/j.issn.1674-764x.2022.03.011

1 Introduction

The International Union for Conservation of Nature (IUCN) defines a protected area (PAs) as, “A clearly defined geographical space, recognized, dedicated and managed, through legal or other effective means, to achieve the long-term conservation of nature with associated ecosystem services and cultural values” (Dudley, 2013). Protecting certain areas is a key strategy to protect natural resources, biodiversity, and ecosystem health (Bruner et al., 2001; Watson et al., 2014). Furthermore, PAs play an important role in alleviating the pressure created by human activities, mitigating the effects of climate change, and resisting invasive species (Soares-Filho et al., 2010; Melillo et al., 2016; Geldmann et al., 2019; Liu et al., 2020b). In addition, some PAs also preserve natural historical products or cultural keystone species, which play a major role in promoting the development of various aspects, including culture and tourism (Balmford et al., 2009; Naidoo et al., 2016; Vlami et al., 2017). Therefore, PAs contribute to the sustainable development of society and human well-being and can provide reference standards for human activities (UNEP-WCMC et al., 2018).
In 1872, the USA established Yellowstone National Park, which is regarded as the first modern PA (Chape et al., 2005). In 2020, the World Database on Protected Areas (WDPA) reported 248613 PAs worldwide (UNEP- WCMC, 2020), covering 14.87% of land and 7.47% of oceans globally (IUCN, 2019). In recent years, nature reserves (NRs), as important components of PAs, have gained global popularity, especially in China. NRs now make up most of China's PAs (Wu et al., 2011), after the first was established in 1956. By the end of 2017, China had established 2750 nature reserves, covering a total area of 1471700 km2. Among them, there are 474 national NRs, with a total area of 974500 km2 (Ministry of Ecology and Environment, 2019). These NRs protect important or typical ecosystems as well as rare and endangered species. China's terrestrial PAs cover >18% of the country's land area, meeting the 2020 goal set by the Convention on Biological Diversity (Ministry of Ecology and Environment, 2020). It has been estimated that 90% of natural terrestrial ecosystems and 89% of protected wildlife species are conserved in China's NRs (Zhang et al., 2017). Standardization of management practices for nature reserves will improve the effectiveness of the efforts to protect endangered species. However, there is an urgent need to strengthen and improve the construction and management of PAs to address serious ecological and environmental problems, such as the rapid decline in biodiversity and degradation of ecosystems.
Assessing the effectiveness of conservation efforts in NRs generally focuses on management practices. For example, the Management Effectiveness Tracking Tool and the Nature Conservancy's Parks in Peril scorecard were developed based on the management effectiveness evaluation framework proposed by IUCN-WCPA (Lee and Abdullah, 2019). More importantly, it is necessary to assess species and ecosystems in NRs, and then combine them with management practices to evaluate the protective effect of NRs more effectively.

2 Need for new methods for assessing the protective effect of nature reserves

The current system for evaluating NRs is inconsistent and inefficient, and has greatly hindered the development of standardized management protocols for state and social organizations. Therefore, it is necessary to develop a scientific and reasonable assessment system for NRs. According to the main object of evaluation, assessment methods can be roughly divided into two categories. The first category involves the assessment of flagship or umbrella species in a NR (Reville, 1983; Nawaz et al., 2008; Silva et al., 2011; Speed et al., 2018; Kiffner et al., 2020). This assessment mainly involves monitoring the abundance or spatial distribution of flagship or umbrella species. This type of monitoring and the resulting investigation data have played an important role in enhancing our understanding of the effectiveness of NRs in protecting rare and endangered species to a certain extent. The second category involves the assessment of the quality of the ecosystem within an NR. The quality of the ecosystem directly affects the biodiversity and ecosystem services of an NR (Tilman et al., 2001; Butchart et al., 2010); good ecosystem quality is essential for the long-term survival and reproduction of species. Therefore, ecosystem quality can well reflect the potential pressure faced by species (Swaisgood et al., 2018; Zang et al., 2020). However, from both theoretical or operational perspectives, considering only certain types of evaluation objects will lead to inaccurate and incomplete assessments.
The two methods should be combined and each should be weighted according to the specific conditions of the NR or the purpose of the assessment. For example, the number of flagship or umbrella species in a PA increases during a certain period, but the quality of the ecosystem is decrease. For instance, the fourth giant panda survey organized by China found that the abundance and habitat area of giant pandas have increased, but the habitats are becoming more fragmented, with some patches being of poor quality (WWF, 2020). In this case, assessing ecosystem quality will be the focus of the assessment system. In addition to evaluating the protective effect of NRs for flagship or umbrella species, such evaluation systems can also predict the future trends of flagship or umbrella species in NRs by observing the changes in ecosystem quality.
Previous studies have conducted the assessment of ecosystem quality in specific areas or NRs (Wang et al., 2007; Sallustio et al., 2017). Ecosystem quality assessment methods are generally developing in two directions. The first direction involves developing assessments based on multiple ecological indicators. Its advantages include the description of the current status and changes in ecosystem quality in detail, but the evaluation system or parameters are complicated (Sinclair et al., 2015; Sun et al., 2016; Chai and Lha, 2018; Chen et al., 2019; Faridah-Hanum et al., 2019; Liu et al., 2020a). The second direction involves developing a few key ecological indicators, and this approach has the advantage of the ease of operation (Liu et al., 2001; Wang et al., 2014; Shan et al., 2019; Shen et al., 2019). The above ecosystem quality assessment methods seem to provide a reliable reflection of changes in ecosystem quality in an NR. However, owing to the lack of a unified reference system, the following problems persist: 1) It is difficult to accurately quantify the differences in the quality of different NRs and ecosystems within the NRs; 2) The indexes of ecosystem quality in NRs are not consistent. It is difficult to standardize the evaluation of different NRs; 3) Quantification of the restoration potential and restoration stage of ecosystems in NRs is challenging, and this reduces the comparability of the quality of different ecosystems and NRs. These problems hinder objective evaluation of the effectiveness of national NRs, creating difficulties when implementing national sustainable development policies or allocating funds. The previous evaluation system greatly increased the difficulty and cost of the evaluation and made it impossible to compare the results of different regions. Therefore, we developed a new framework to incorporate ideal references and several key parameters into evaluation systems, which aids the comparison of results from different periods and regions.

3 A new framework for ideal reference and key indicators (IRKI)

NRs are usually divided into three zones, the core, buffer, and experimental zones, which have different practical functions (Batisse, 1982). However, previous studies have evaluated them as a whole. In addition, many studies have demonstrated that changes in micro-habitats can have considerable effects on plant composition, soil microbes, and soil nutrients, especially at smaller scales (Lau and Lennon, 2011). In short, the ideal reference of ecosystem quality is different for different functional areas even within the same NR. In practice, many methods tend to consider as many ecological indicators as possible to better assess ecosystem quality. However, some indicators, such as those that are measured indirectly, cannot accurately reflect the status of the ecosystem, thus negatively influencing the evaluation results. Therefore, we propose that several accurately measured key indicators could better reflect the ecosystem quality of NRs. A unified indicator system can be used in most NRs for the assessment of the protective effect.
Another challenge is to ensure that results are comparable among different periods in the same NR and different NRs. Determining an ideal reference should be the best solution for addressing this problem (He et al., 2020). An ideal reference is a reference system composed of a series of indicators reflecting the quality of the ecosystem under a suitable environment or with less human disturbance. If we can establish reference systems for different NRs, even different functional areas, the new evaluation methods and their results should be comparable among different periods and reserves. Combining ideal references and key indicators is a promising method for assessing NRs under a standard framework, referred to as the IRKI framework (Fig. 1) in this study.
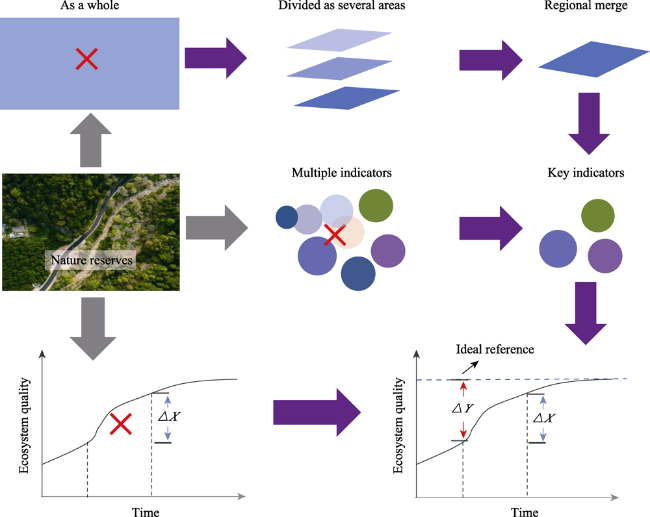
Fig. 1 Rational solutions for the evaluation of ecosystem quality in nature reserves across multiple scales

Note: The gray arrows point to the traditional framework of ecosystem quality assessment. The purple arrows point to the IRKI framework.The red “×” means discarding the previous method.

3.1 A nested method of IRKI for evaluating the ecosystem quality of nature reserves

Owing to differences in terrain or microhabitat topography, the different areas of NRs have different water availability, resulting in differences in vegetation and soils. Different NRs in China span across multiple temperature zones with significant differences in precipitation and temperature, as well as the growth-limiting factors for vegetation. More importantly, the socio-economic development of different regions around NRs is uncoordinated. Therefore, to eliminate the influence of these differences, a nested method of IRKI should be developed as a basis for the standardized evaluation and management of NRs in China. The practical details of this are as follows:
(1) According to the regional differences of different NRs, the ideal reference should be sub-divided based on the ecological division of China (Jie et al., 2001) to facilitate comparisons.
(2) Ideal reference should be established for each of the functional areas of a NR because different functional areas have different micro-habitats and experience different levels of human disturbance. In addition, the control area should be set up, that is, the area extending a certain area outside the NR. Its main function is to reflect the relative protective effect of NRs.
(3) Within the functional areas, the functions and services of different ecosystem types are also different. Therefore, it is necessary to establish ideal references for each mature ecosystem in the region, such as forests, grasslands, and deserts.
(4) The micro-topographical features influence the supply of water and nutrients, resulting in significant differences in productivity and diversity. Therefore, it is necessary to emphasize micro-topography in most NRs.

3.2 How to select key ecological indicators

3.2.1 Criteria for key ecological indicators

To better assess the ecosystem quality of NRs, key ecological indicators are essential because they can ideally represent key information on the structure and function of ecosystems. The criteria for selecting the proposed key ecological indicators were as follows:
(1) Simple and intuitive; be able to reflect public perception and scientific understanding.
(2) Can be accurately and directly measured.
(3) Should reflect environmental pressures of NRs.
(4) The measurement should be feasible and cost-effective.
(5) Should be available over the long term and regionally comparable.

3.2.2 Potential key ecological indicators

We recommend several key indicators for the evaluation of ecosystem quality in NRs (Table 1). In practice, the key indicators selected should reflect the aims and regions of the evaluation.
Table 1 Some key indicators recommended at the community level in this study
Key indicators Availability Operability Cost Quantity
Gross primary productivity 5 5 5 5
Net primary productivity 5 5 5 5
Aboveground biomass 5 5 5 5
Biomass energy 4 5 5 5
Biodiversity 3 5 3 5
Soil fertility (SOM, pH. etc.) 3 5 3 5

Note: The full score is 5, and the higher score indicated better performance.

(1) Productivity, including gross primary productivity, net primary productivity and aboveground biomass, is the predominant indicator and can reflect the foundations of ecosystem quality related to material and energy acquisition (Houghton, 2005; Beer et al., 2010; Shao et al., 2016). In general, the higher the productivity of an area, the higher is the ecosystem quality (Zhu et al., 2016). It is the basis for not only energy and biomass production by plants, but also for nutrient cycles and energy flow in ecosystems (Falster et al., 2011; Jiao et al., 2017). Furthermore, the biomass energy of living plants should be equivalent or complementary to productivity. Compared with biomass or productivity, biomass energy can potentially be standardized (or normalized) to reflect the energy stored at any NR (Abbasi and Abbasi, 2010; Yan et al., 2020).
(2) Soil fertility—described by indicators such as pH and soil nutrients (Schlesinger et al., 1996; Zhao et al., 2020)—is another important factor that reflects ecosystem quality in the long term, because the survival of plants mainly depends on the absorption of various elements from the soil. More importantly, soil fertility directly affects plant community composition and ecosystem structure and productivity (Sander and Wardell-Johnson, 2011).
(3) Biodiversity is another important factor, and in the evaluation of NRs, it should be measured with a focus on plant diversity owing to simplicity and operability. More importantly, richer plant diversity can ensure the normal operation of niches in natural ecosystems and can maintain the sustainability of functions and structure of ecosystems (Steudel et al., 2012; Wang and Loreau, 2016). Moreover, advances in remote sensing are making it increasingly easier to incorporate plant diversity in the evaluation of ecosystem quality (Muldavin et al., 2001; Hoffmann et al., 2018).

3.3 How to determine ideal references for these key indicators

Owing to differences in climate, terrain, and ecosystem types, the ideal reference (or threshold) for key indicators would differ for different regions. The methods used to determine the ideal reference of specific indicators can be roughly be divided into two types. First, the probability distribution method (Fig. 2a) is used to determine the ideal reference on a probability distribution map (5% upper or lower proportion). In detail, if the value of the indicator is positively related to the ecosystem quality, then the upper 5% threshold will be adopted. Conversely, if the value of the indicator is negatively related to the ecosystem quality, then the lower 5% threshold (even reciprocal) can be adopted. This method is simple and consistent in practice and can well reflect the ecosystem quality of NRs across several scales.
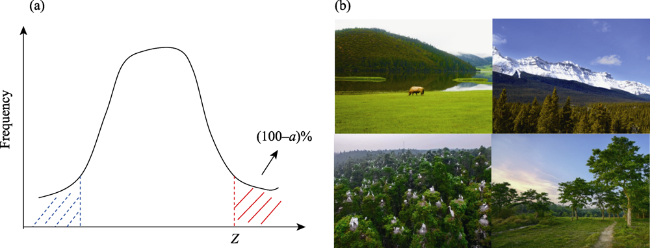
Fig. 2 Method for determining the ideal reference of specific ecological indicators to evaluate the protective effects. (a) Using probability distribution method to calculate ideal reference. (b) Using the key indicators of regions with less human disturbance as an ideal reference.

Note:“a” is a variable. The specific value is selected based on the actual situation.

The second is the reference method of ideal ecosystems (Fig. 2b). The core area of an NR is generally the least disturbed, and the values of its key indicators can be used as ideal thresholds. Some ecosystems in other functional areas with less disturbance and the best conditions could also potentially provide an ideal reference, especially for NRs with complex topography or ecosystems.

4 How to evaluate the ecosystem quality of nature reserves with IRKI

4.1 Evaluating the current status of ecosystem quality

The ecosystem quality of specific functional areas was calculated based on the absolute difference (∆Xi) and relative change (∆Yi) between the actual value of key ecological indicators and ideal references. ∆Yi reflects the relative recovery potential of ecosystem quality at time Ti as in Eqs. 1 and 2 (Fig. 3):
$\Delta {{X}_{i}}=X-{{X}_{i}}$
$\Delta {{Y}_{i}}=\frac{X-{{X}_{i}}}{X}\times 100%$
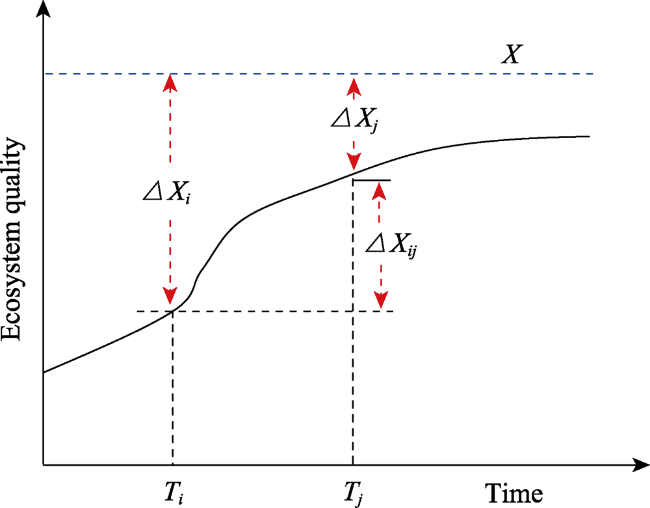
Fig. 3 New method for evaluating the protective effect of nature reserves

Note: ∆Xi and ∆Xj are the absolute difference between the actual value of key indicators and ideal reference. ∆Xij to X is the change of the actual value of key indicators from Ti to Tj. In the new framework, the recovery potential of the key indicators can be calculated by the ideal reference in Fig. 4, and then different recovery programs can be practiced based on the recovery stage. X is ideal reference.

where Xi and X are the observed values of specific indicators at time Ti and the ideal reference, respectively.
For ∆Yi, the higher the value, the lower the ecosystem quality. Using the relative change in key indicators and ideal references, we can calculate the ecosystem quality comprehensive index (QEco) using Eq. 3:
${{Q}_{Eco}}=100-\underset{m=1}{\overset{n}{\mathop \sum }}\,({{w}_{m}}\times \Delta {{Y}_{m}})$
where wm and ∆Ym are the relative weight and relative change of specific key indicators at time Ti, respectively. wm is commonly obtained using scores assigned by experts or the entropy method.
The ecosystem quality comprehensive index of the NR (QN-Eco) is calculated using Eq. 4:
$\text{ }\!\!~\!\!\text{ }{{Q}_{N-Eco}}=\underset{c=1}{\overset{n}{\mathop \sum }}\,~{{C}_{c}}\times {{\left( \underset{b=1}{\overset{n}{\mathop \sum }}\,~{{B}_{b}}\times {{\left( \underset{a=1}{\overset{n}{\mathop \sum }}\,~{{A}_{a}}\times {{Q}_{Eco-a}} \right)}_{{}}} \right)}_{{}}}~$
where Aa represents the relative weight corresponding to each slope level, and Bb represents the relative weight corresponding to each ecosystem, and Cc represents the relative weight corresponding to each functional area, and a represents the type of slope level, and b represents the type of ecosystem, and c represents the functional area of the NR. QEco-a represents the comprehensive index of ecosystem quality at different slope levels.
The grades based on the above comprehensive index are excellent, very good, good, and poor (Table 2).
Table 2 Grading and scoring criteria for ecosystem quality in Ecosystem Quality Comprehensive Index (QEco)
Level Excellent Very good Good Poor
QEco QEco≥75 55≤QEco< 75 35≤QEco<55 QEco<35
Description Ecosystem quality is excellent, close to ideal state Ecosystem quality is very nice, and the gap between current quality and ideal state being small Ecosystem quality is good, but the gap between current quality and ideal state being large Ecosystem quality is poor, far from ideal state

4.2 Evaluating the changes in ecosystem quality

Within the time period from Ti to Tj (Fig. 3), the absolute (∆Xij) and relative (∆Yij) changes between the observed values and the ideal reference of specific indicators are calculated using Eqs. 5 and 6.
$\Delta {{X}_{ij}}={{X}_{j}}-{{X}_{i}}$
$\Delta {{Y}_{ij}}=\frac{{{X}_{j}}-{{X}_{i}}}{X}\ \times 100%$
where a positive ∆Yij indicates that the ecosystem quality is increasing, while a negative value indicates decreasing quality. The relative change in specific indicators was graded as excellent, very good, good, and poor (Table 3). The relative change (∆Yij) is transformed by Eq. 7, with its value ranging from 0 to 100:
$\Delta {{Y}_{n}}=(\Delta {{Y}_{ij}}+100)/2$
Table 3 Grading and scoring criteria to evaluate the relative variation of key indicators as productivity
Level Relative changes in ∆Yij Standard for evaluation
Excellent 0.8 < ∆Yij ≤ 1.0 (85, 100]
Very good 0.6< ∆Yij ≤ 0.8 (60, 85]
Good 0.4 < ∆Yij ≤ 0.6 (40, 60]
Poor ∆Yij ≤ 0.4 [0, 40]
Finally, the ecosystem quality relative change comprehensive index (QEco-r) is calculated using Eq. 8:
${{Q}_{Eco-r}}=\underset{k=1}{\overset{n}{\mathop \sum }}\,({{w}_{k}}\times \Delta {{Y}_{k}})$
where wk and ∆Yk represent the weight coefficient and relative change score of evaluation indicators (k), respectively; their values were obtained based on the scores provided by experts or the entropy method.
The ecosystem quality relative change comprehensive index of the NR (QN-Eco-r) is calculated as:
${{Q}_{N-Eco-r}}=\underset{c=1}{\overset{n}{\mathop \sum }}\,~{{C}_{c}}\times {{\left( \underset{b=1}{\overset{n}{\mathop \sum }}\,~{{B}_{b}}\times {{\left( \underset{a=1}{\overset{n}{\mathop \sum }}\,~{{A}_{a}}\times {{Q}_{Eco-c}} \right)}_{{}}} \right)}_{{}}}$
where Aa represents the relative weight corresponding to each slope level, and Bb represents the relative weight corresponding to each ecosystem, and Cc represents the relative weight corresponding to each functional area, and a represents the type of slope level, and b represents the type of ecosystem, and c represents the functional area of the NR. QEco-c represents the comprehensive index of ecosystem quality at different functional areas.
The relative change in ecosystem quality based on the above comprehensive index was graded as Table 4.
Table 4 Grading criteria for the relative changes in ecosystem integrated quality index (QEco-r)
QEco-r Description
QEco-r ≥52.5 Ecosystem quality has improved significantly
51.0≤QEco-r < 52.5 Ecosystem quality has improved slightly
49.0≤QEco-r < 51.0 Ecosystem quality has not improved
47.5≤QEco-r < 49.0 Ecosystem quality has deteriorated slightly
QEco-r <47.5 Ecosystem quality has deteriorated significantly

5 Perspective and challenges of implementing IRKI for nature reserves

The new evaluation system that combines assessments of flagship or umbrella species and ecosystem quality discussed above has some limitations that should be addressed before it can be implemented practically. In practice, the social environment and other factors should be considered when evaluating NRs. Thus, ideally, our newly developed framework for evaluating the protective effect of NRs consists of three key elements, namely, flagship or umbrella species, ecosystem quality, and social environment (Fig. 4). This method follows the pressure-status-response framework (Kang et al., 2019) and provides a valuable reference for national policy-making.
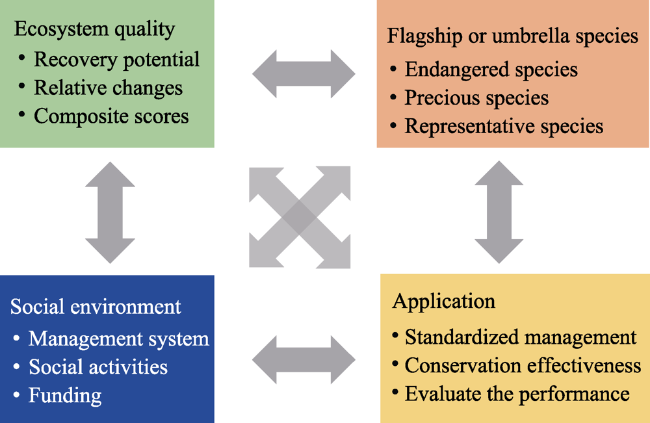
Fig. 4 Combining key species, ecosystem quality, and social environment as a novel framework for evaluating the protective effect of nature reserves.

Note: The arrows indicate feedback, including positive and negative feedback. In the framework, these four parts can give feedback to each other.

The IRKI framework has several advantages. First, the assessments reflect not only the changes in key species but also the total ecosystem quality. The latter can provide more information on the habitats and stress factors of flagship or umbrella species, thereby facilitating the prediction of future changes in flagship or umbrella species. Second, the nested ideal references and key indicators make comparison of the evaluation methods or results easier among different periods or NRs (Fig. 5). Third, unlike previous methods, this method can assess the recovery potential of the ecosystem quality. This will aid scientists or managers to objectively assess the protective effects for different NRs, even during restoration, and the changes in ecosystem quality of different NRs and their internal areas can be compared quantitatively. Thus, it will be possible to assess the change in the recovery potential of ecosystem quality in various regions (functional zoning, terrain zoning, and ecosystem type), even those at different recovery stages (Fig. 5a). The fitting models (Fig. 5b) can be established based on the social and economic data from the NR. The fitting relationships (Fig. 5d) can be formulated for each recovery stage, corresponding protection measures, capital investment, and ecological compensation. Together, these approaches will help to determine ecosystem quality in different restoration schemes and regions (Fig. 5c). The IRKI framework can provide a valuable reference for the evaluation of the ecosystem quality of NRs across multiple scales.
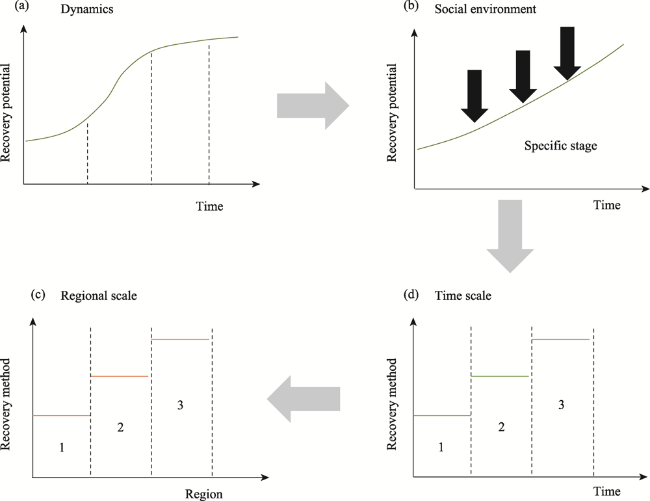
Fig. 5 Potential implications of the new framework combining ideal references and several key ecological indicators for the evaluation of the protective effect of nature reserves across different scales. (a) The restoration potential of ecosystem quality in different periods can be calculated; (b) In a specific stage, the restoration potential of ecosystem quality at multiple continuous time points can be fitted with social and environmental factors; (c) The restoration plan of ecosystem quality in different regions of nature reserves can be formulated; (d) The restoration plan of ecosystem quality in different periods can be formulated.

Note: The gray arrows indicate the direction of the calculation. The black arrows indicate the pressure of social environment on the ecosystem.

6 Conclusions

NRs are an effective means to protect the ecological environment and natural resources. Establishing an objective strategy to evaluate their protective effect is important for the governments to implement relevant management policies, and the established methods should be continually improved or novel methods developed. Here, we developed a method for evaluating ecosystem quality in NRs based on the IRKI framework. This framework can aid in evaluating the current ecosystem quality and restoration potential of specific NRs using an ideal reference and compare the conservation effect of different regions or periods with several key indicators. The simple, clear, and comparable IRKI has the potential to improve the conservation effect of NRs (or other types of PAs) and realize the standardization of management practices. However, there are some challenges that need to be resolved. The theory of IRKI may provide new insights into the evaluation of other ecological and environmental issues. China has many types of NRs, and therefore, it is necessary to partially alter the assessment methods for different types of NRs. The main purpose of this article was to project a new perspective and concept, which may provide a reference for the evaluation of ecosystem quality of other types of NRs in the future.
[1]
Abbasi T, Abbasi S A. 2010. Biomass energy and the environmental impacts associated with its production and utilization. Renewable and Sustainable Energy Reviews, 14: 919-937.

DOI

[2]
Balmford A, Beresford J, Green J, et al. 2009. A global perspective on trends in nature-based tourism. Plos Biology, 7: e1000144. DOI: 10.1371/journal.pbio.1000144.

DOI

[3]
Batisse M. 1982. The biosphere reserve: A tool for environmental conservation and management. Environmental Conservation, 9: 101-110.

DOI

[4]
Beer C, Reichstein M, Tomelleri E, et al. 2010. Terrestrial gross carbon dioxide uptake: Global distribution and covariation with climate. Science, 329: 834-838.

DOI

[5]
Bruner A G, Gullison R E, Rice R E, et al. 2001. Effectiveness of parks in protecting tropical biodiversity. Science, 291: 125-128.

PMID

[6]
Butchart S H M, Walpole M, Collen B, et al. 2010. Global biodiversity: Indicators of recent declines. Science, 328: 1164-1168.

DOI PMID

[7]
Chai L H, Lha D. 2018. A new approach of deriving indicators and comprehensive measure for ecological environmental quality assessment. Ecological Indicators, 85: 716-728.

DOI

[8]
Chape S, Harrison J, Spalding M, et al. 2005. Measuring the extent and effectiveness of protected areas as an indicator for meeting global biodiversity targets. Philosophical Transactions of the Royal Society B: Biological Sciences, 360(1454): 443-455.

DOI

[9]
Chen J B, Wang Y J, Li F Y, et al. 2019. Aquatic ecosystem health assessment of a typical sub-basin of the Liao River based on entropy weights and a fuzzy comprehensive evaluation method. Scientific Reports, 9: 14045. DOI: 10.1038/s41598-019-50499-0.

DOI

[10]
Dudley N. 2013. Guidelines for applying protected area management categories. Gland, Switzerland: IUCN.

[11]
Falster D S, Brännström Å, Dieckmann U, et al. 2011. Influence of four major plant traits on average height, leaf-area cover, net primary productivity, and biomass density in single-species forests: A theoretical investigation. Journal of Ecology, 99(1): 148-164.

DOI

[12]
Faridah-Hanum I, Yusoff F M, Fitrianto A, et al. 2019. Development of a comprehensive mangrove quality index (MQI) in Matang Mangrove: Assessing mangrove ecosystem health. Ecological Indicators, 102: 103-117.

DOI

[13]
Fu B J, Liu G H, Chen L D, et al. 2001. Scheme of ecological regionalization in China. Acta Ecologica Sinica, 21(1): 1-6. (in Chinese)

[14]
Geldmann J, Manica A, Burgess N D, et al. 2019. A global-level assessment of the effectiveness of protected areas at resisting anthropogenic pressures. Proceedings of the National Academy of Sciences of the USA, 116: 23209-23215.

DOI

[15]
He N P, Xu L, He H L. 2020. Rethinking the methods of evaluation ecosystem quality: Ideal reference and key parameters. Acta Ecologica Sinica, 40(6): 1877-1886. (in Chinese)

[16]
Hoffmann S, Schmitt T M, Chiarucci A, et al. 2018. Remote sensing of β-diversity: Evidence from plant communities in a semi-natural system. Applied Vegetation Science, 22: 13-26.

DOI

[17]
Houghton R A. 2005. Aboveground forest biomass and the global carbon balance. Global Change Biology, 11(6): 945-958.

DOI

[18]
IUCN. 2015. International union for conservation of nature. Gland, Switzerland.

[19]
IUCN. 2019. International union for conservation of nature annual report 2018. Gland, Switzerland.

[20]
Jiao C C, Yu G R, Ge J P, et al. 2017. Analysis of spatial and temporal patterns of aboveground net primary productivity in the Eurasian steppe region from 1982 to 2013. Ecology and Evolution, 7(14): 5149-5162.

DOI

[21]
Kang P, Chen W, Hou Y, et al. 2019. Spatial-temporal risk assessment of urbanization impacts on ecosystem services based on pressure-status- response framework. Scientific Reports, 9: 16806. DOI: 10.1038/s41598-019-52719-z.

DOI

[22]
Kiffner C, Binzen G, Cunningham L, et al. 2020. Wildlife population trends as indicators of protected area effectiveness in northern Tanzania. Ecological Indicators, 110: 105903. DOI: 10.1016/j.ecolind.2019.105903.

DOI

[23]
Lau J A, Lennon J T. 2011. Evolutionary ecology of plant-microbe interactions: Soil microbial structure alters selection on plant traits. New Phytologist, 192(1): 215-224.

DOI

[24]
Lee W H, Abdullah S A. 2019. Framework to develop a consolidated index model to evaluate the conservation effectiveness of protected areas. Ecological Indicators, 102: 131-144.

DOI

[25]
Liu J, Linderman M, Ouyang Z, et al. 2001. Ecological degradation in protected areas: The case of Wolong Nature Reserve for giant pandas. Science, 292(5514): 98-101.

PMID

[26]
Liu W W, Guo Z L, Jiang B, et al. 2020a. Improving wetland ecosystem health in China. Ecological Indicators, 113: 106184. DOI: 10.1016/j.ecolind.2020.106184.

DOI

[27]
Liu X, Blackburn T M, Song T, et al. 2020b. Animal invaders threaten protected areas worldwide. Nature Communications, 11: 2892. DOI: 10.1038/s41467-020-16719-2.

DOI

[28]
Melillo J M, Lu X L, Kicklighter D W, et al. 2016. Protected areas' role in climate-change mitigation. AMBIO, 45(2): 133-145.

DOI

[29]
Ministry of Ecology and Environment. 2019. China Environmental State Bulletin 2018. Beijing. http://www.mee.gov.cn/hjzl/sthjzk/zghjzkgb/201905/P020190619587632630618.pdf.

[30]
Ministry of Ecology and Environment. 2020. China Environmental State Bulletin 2019. Beijing. http://www.mee.gov.cn/hjzl/sthjzk/zghjzkgb/202006/P020200602509464172096.pdf.

[31]
Muldavin E H, Neville P, Harper G. 2001. Indices of grassland biodiversity in the Chihuahuan desert ecoregion derived from remote sensing. Conservation Biology, 15(4): 844-855.

DOI

[32]
Naidoo R, Fisher B, Manica A, et al. 2016. Estimating economic losses to tourism in Africa from the illegal killing of elephants. Nature Communications, 7: 13379. DOI: 10.1038/ncomms13379.

DOI PMID

[33]
Nawaz M A, Swenson J E, Zakaria V. 2008. Pragmatic management increases a flagship species, the Himalayan brown bears, in Pakistan's Deosai National Park. Biological Conservation, 141: 2230-2241.

DOI

[34]
Sallustio L, Toni A D, Strollo A, et al. 2017. Assessing habitat quality in relation to the spatial distribution of protected areas in Italy. Journal of Environmental Management, 201: 129-137.

DOI PMID

[35]
Sander J, Wardell-Johnson G. 2011. Impacts of soil fertility on species and phylogenetic turnover in the high-rainfall zone of the Southwest Australian global biodiversity hotspot. Plant and Soil, 345(1-2): 103-124.

DOI

[36]
Schlesinger W H, Raikes J A, Hartley A E, et al. 1996. On the spatial pattern of soil nutrients in desert ecosystems. Ecology, 77(2): 364-374.

DOI

[37]
Shan W, Jin X B, Ren J, et al. 2019. Ecological environment quality assessment based on remote sensing data for land consolidation. Journal of Cleaner Production, 239: 118126. DOI: 10.1016/j.jclepro.2019.118126.

DOI

[38]
Shao J J, Zhou X H, Luo Y Q, et al. 2016. Uncertainty analysis of terrestrial net primary productivity and net biome productivity in China during 1901-2005. Journal of Geophysical Research: Biogeosciences, 121(5): 1372-1393.

[39]
Shen G, Yang X C, Jin Y X, et al. 2019. Remote sensing and evaluation of the wetland ecological degradation process of the Zoige Plateau Wetland in China. Ecological Indicators, 104: 48-58.

DOI

[40]
Silva S, Ranjeewa A D G, Weerakoon D. 2011. Demography of Asian elephants (Elephas maximus) at Uda Walawe National Park, Sri Lanka based on identified individuals. Biological Conservation, 144(5): 1742-1752.

DOI

[41]
Sinclair S J, Griffioen P, Duncan D H, et al. 2015. Quantifying ecosystem quality by modeling multi-attribute expert opinion. Ecological Applications, 25(6): 1463-1477.

DOI

[42]
Soares-Filho B, Moutinho P, Nepstad D, et al. 2010. Role of Brazilian Amazon protected areas in climate change mitigation. Proceedings of the National Academy of Sciences of the USA, 107: 10821-10826.

DOI

[43]
Speed C W, Cappo M, Meekan M G. 2018. Evidence for rapid recovery of shark populations within a coral reef marine protected area. Biological Conservation, 220: 308-319.

DOI

[44]
Steudel B, Hector A, Friedl T, et al. 2012. Biodiversity effects on ecosystem functioning change along environmental stress gradients. Ecology Letters, 15(12): 1397-1405.

DOI

[45]
Sun T T, Lin W P, Chen G S, et al. 2016. Wetland ecosystem health as-sessment through integrating remote sensing and inventory data with an assessment model for the Hangzhou Bay, China. Science of the Total Environment, 566-567: 627-640.

DOI

[46]
Swaisgood R R, Wang D, Wei F. 2018. Panda downlisted but not out of the woods. Conservation Letters, 11(1): e12355. DOI: 10.1111/conl.12355.

DOI

[47]
Tilman D, Fargione J, Wolff B, et al. 2001. Forecasting agriculturally driven global environmental change. Science, 292(5515): 281-284.

PMID

[48]
UNEP-WCMC. 2020. Protected planet: The world database on protected areas (WDPA), (version of June 2020 downloaded). www.protectedplanet.net.

[49]
UNEP-WCMC, IUCN, NGS. 2018. Protected planet report 2018. Cambridge, UK; Gland, Switzerland; Washington DC, USA: UNEP-WCMC, IUCN and NGS.

[50]
Vlami V, Kokkoris I P, Zogaris S, et al. 2017. Cultural landscapes and attributes of “culturalness” in protected areas: An exploratory assessment in Greece. Science of the Total Environment, 595: 229-243.

DOI

[51]
Wang S P, Loreau M. 2016. Biodiversity and ecosystem stability across scales in metacommunities. Ecology Letters, 19(5): 510-518.

DOI

[52]
Wang S X, Yao Y, Zhou Y. 2014. Analysis of ecological quality of the environment and influencing factors in China during 2005-2010. International Journal of Environmental Research and Public Health, 11(2): 1673-1693.

DOI

[53]
Wang Y S, Lou Z P, Sun C C, et al. 2007. Ecological environment changes in Daya Bay, China from 1982 to 2004. Marine Pollution Bulletin, 56(11): 1871-1879.

DOI

[54]
Watson J E M, Dudley N, Segan D B, et al. 2014. The performance and potential of protected areas. Nature, 515(7525): 67-73.

DOI

[55]
Wu R D, Zhang S, Yu D W, et al. 2011. Effectiveness of China's nature reserves in representing ecological diversity. Frontiers in Ecology and the Environment, 9(7): 383-389.

DOI

[56]
WWF. 2020. International World Wide Fund For Nature-Beijing report (2017-2019). Beijing, China: WWF.

[57]
Yan P, Xiao C W, Xu L, et al. 2020. Biomass energy in China's terrestrial ecosystems: Insights into the nation's sustainable energy supply. Renewable and Sustainable Energy Reviews, 127: 109857. DOI: 109810.101016/j.rser.102020.109857.

DOI

[58]
Zang Z H, Deng S Y, Ren G F, et al. 2020. Climate-induced spatial mismatch may intensify giant panda habitat loss and fragmentation. Biological Conservation, 241: 108392. DOI: 10.1016/j.biocon.2019.108392.

DOI

[59]
Zhang L B, Luo Z H, Mallon D, et al. 2017. Biodiversity conservation status in China's growing protected areas. Biological Conservation, 210: 89-100.

[60]
Zhao W J, Luo M Q, Li Z L, et al. 2020. Evaluation of soil fertility in a gravel-sand-mulched jujube (Ziziphus jujuba) orchard based on modified nemoro fertility indexing method. Agricultural Research, 9(1): 85-93.

DOI

[61]
Zhu X J, Yu G R, Wang Q F, et al. 2016. Approaches of climate factors affecting the spatial variation of annual gross primary productivity among terrestrial ecosystems in China. Ecological Indicators, 62: 174-181.

DOI

Outlines

/