Ecosystem Assessment

Characteristics and Carbon Storage of a Typical Mangrove Island Ecosystem in Beibu Gulf, South China Sea

  • WU Bin , 1 ,
  • ZHANG Wenzhu 1 ,
  • TIAN Yichao , 2, * ,
  • LIANG Mingzhong 2 ,
  • XU Jun 1 ,
  • GU Guanhai 1
Expand
  • 1. School of Natural Resources and Surveying, Nanning Normal University, Nanning 530001, China
  • 2. School of Resources and Environment, Beibu Gulf University, Qinzhou, Guangxi 535000, China

WU Bin, E-mail:

Received date: 2020-11-24

  Accepted date: 2021-08-30

  Online published: 2022-04-18

Supported by

The Guangxi Science and Technology Base and Talent Project(GuikeAD19245041)

The Guangxi Science and Technology Base and Talent Project(2019AC20088 ))

The Guangxi Key Research and Development Program(AA18118038)

The Project to Improve the Basic Research Ability of Young and Middle-Aged Teachers in Guangxi Universities(2020KY09021)

The Project to Improve the Basic Research Ability of Young and Middle-Aged Teachers in Guangxi Universities(2019KY0426)

Abstract

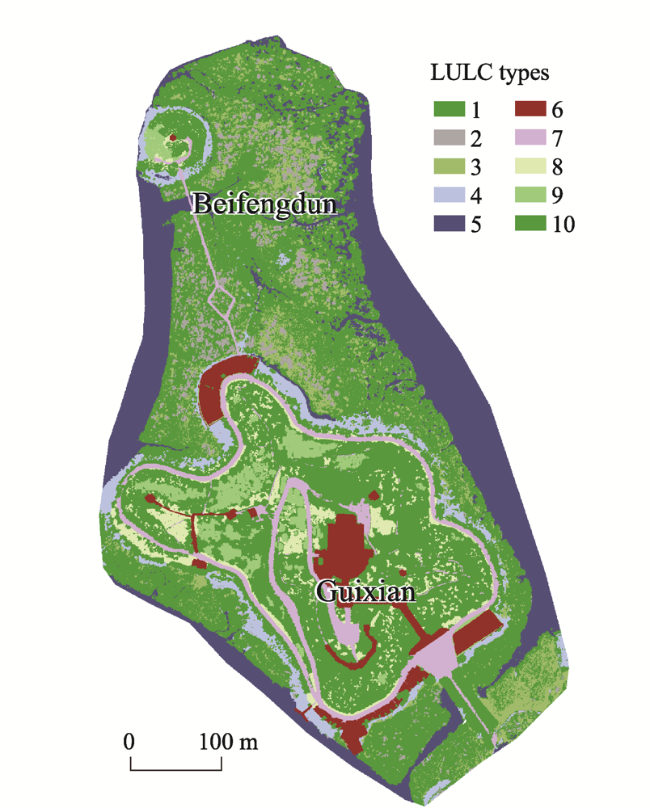
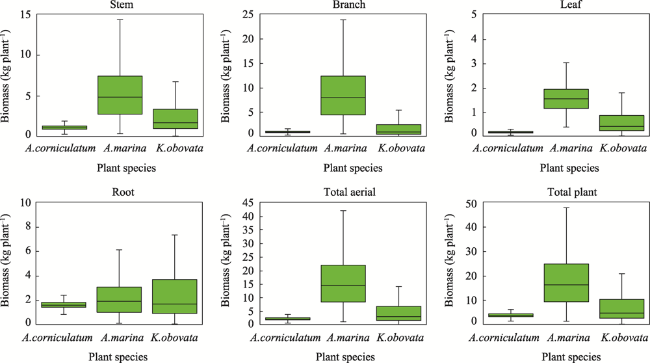
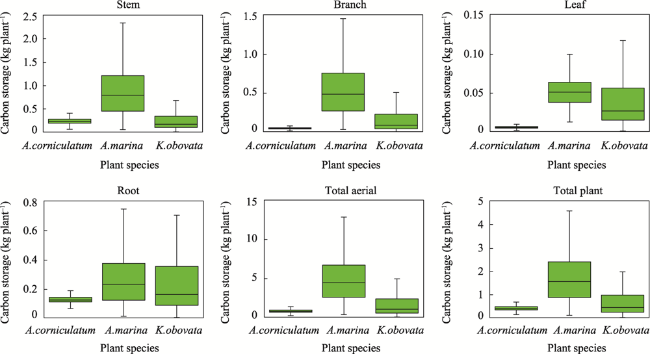
By studying the structural characteristics and carbon storage of the mangrove island ecosystem in the Beibu Gulf, this study provides a scientific basis for mangrove ecological compensation in the coastal areas of Guangxi, South China Sea. On the basis of the unmanned aerial vehicle remote sensing images and a sample plot survey, the object-oriented multi-scale segmentation algorithm is used to extract the mangrove community type information, and one-way analysis of variance is conducted to analyse the structural characteristics of the mangrove community. The carbon storage and carbon density of different mangrove ecosystems were obtained based on the allometric growth equation of mangrove plants. The analysis yielded four main results. (1) The island group covers about 27.10 ha, 41.32% (11.20 ha) of which represents mangrove areas. The mangrove forest is widely distributed in the tidal flats around the islands. (2) The main mangrove types were Aegiceras corniculatum, Kandelia obovata + Aegiceras corniculatum, Avicennia marina + Aegiceras corniculatum and Avicennia marina communities. (3) Amongst the mangrove plants, Avicennia marina had the highest biomass (18.52 kg plant-1), followed by Kandelia obovata (7.84 kg plant-1) and Aegiceras corniculatum (3.85 kg plant-1). (4) The mangrove carbon density difference was significant. Kandelia obovata had the highest carbon density (148.03 t ha-1), followed by Avicennia marina (104.79 t ha-1) and Aegiceras corniculatum (99.24 t ha-1). The carbon storage of the mangrove island ecosystem was 1194.70 t, which was higher than in other areas with the same latitude. The carbon sequestration capacity of the mangrove was relatively strong.

Cite this article

WU Bin , ZHANG Wenzhu , TIAN Yichao , LIANG Mingzhong , XU Jun , GU Guanhai . Characteristics and Carbon Storage of a Typical Mangrove Island Ecosystem in Beibu Gulf, South China Sea[J]. Journal of Resources and Ecology, 2022 , 13(3) : 458 -465 . DOI: 10.5814/j.issn.1674-764x.2022.03.010

1 Introduction

Mangrove is a woody plant community composed of evergreen trees or shrubs that grows on the tidal flats of tropical and subtropical estuaries, bays and low-energy coasts (Kathiresan and Bingham, 2001; Li et al., 2016). These communities are located at the junction of land and shallow seas, and they are flooded by periodic tides. Mangrove is a special ecosystem that is over-the-land to the ocean and is one of the most important ecosystems in the world, with the highest ecosystem service value per unit area (Dittmar et al., 2006; Alongi, 2008). Moreover, mangroves play an im-portant role in coastal regions and in the global carbon balance. In the past 50 years, due to the rising sea levels, aquaculture and coastal development activities, the global mangrove area has decreased by 30%-50% (FAO, 2008). At this rate, mangroves may disappear from the Earth in the next 100 years (Duke et al., 2007). The lack of overall planning for the development of coastal zones, the change in immediate interests and negligence of the ecological consequences have caused severe damage to beach wetlands, mangroves and coral reefs. In the past 40 years, large-scale reclamations have caused the coastal areas to lose about 2.19×10⁶ ha of coastal wetlands due to the need to reclaim lands from the sea and develop tidal flat aquaculture, and this amount was equivalent to 50% of the total area of coastal wetland in China. This situation has seriously damaged the wetland resources, and the situation of mangroves in China is alarming. Since the 1950s, mangrove area has decreased from 50000 ha to 25000 ha, which has resulted in huge irreparable losses in the ecological environment in coastal areas. Therefore, the mangrove systems should be a priority for conservation and restoration efforts in the context of global climate change.
Mangroves possess high productivity, and those around the equator have more biomass than many tropical rainforest plants due to the superior hydrothermal conditions. In addition, mangroves have a long rhizosphere carbon cycle, a low rate of soil organic carbon decomposition and a long carbon storage time, which signify a high carbon sink potential (Zhang et al., 2013). Consequently, the mangrove ecosystem stores a large amount of organic carbon. The average carbon storage of the global mangrove ecosystem is about 1023±88 t ha-1, in which the above-ground carbon storage is 159 t ha-1, and the highest value reaches 435 t ha-1 (Donato et al., 2011; Donato et al., 2012). About 10% of the organic carbon in the global offshore ecosystem comes from mangroves (Duarte et al., 2005; Bouillon, 2012). Studies on the carbon storage of mangrove ecosystems are mainly based on biomass conversion (Twilley et al., 1992; Chave et al., 2005; Komiyama et al., 2008) and are conducted through harvesting, relative growth and average wood methods (Komiyama et al., 2008). The above-ground carbon storage is measured by sampling leaves and branches according to the selected standard mangrove trees, and the stem matter is measured and converted by drilling holes (Mitra et al., 2011). Many scholars have established their own allometric growth equations for various mangrove plants to estimate the above and underground biomasses of mangroves using different tree species (Khan et al., 2007; Kirue et al., 2007; Komiyama et al., 2008; He et al., 2017). The mangrove growth environment is complex, and the corresponding productivity and carbon sink capacity are constrained by many factors, such as latitude, topography, soil depth, tide, climate, vegetation type and biological factors. In addition, the large spatial differences increase the complexity of the organic carbon calculation (Nordhaus et al., 2006; Poret et al., 2007).
Although many scholars have studied the carbon storage and circulation of mangroves (Jin et al., 2013; Lu et al., 2014; Li et al., 2016; Li et al., 2018), only a few have focused on the biomass, carbon storage and distribution pattern of mangroves in the Beibu Gulf. Using a sample plot survey and aerial images captured by a low-altitude unmanned aerial vehicle (UAV), the present study analysed the structural characteristics of the mangrove ecosystem through one-way ANOVA and biostatistical methods. Moreover, this study utilised the allometric growth equation to estimate the biomass and carbon reserves of mangrove stem, branch, leaf and root to provide a scientific basis for the protection of the mangrove community, as well as for the sustainable development of the coastal areas in Guangxi.

2 Study area and methods

2.1 Study area

The Guixian and Beifengdun islands are located in the Beibu Gulf of the South China Sea (Fig. 1). This island group is the largest and most representative of a typical island mangrove in China, which possesses a unique rock mangrove forest and island mangrove landscape. The annual average temperature is 22 °C, and the annual accumulated temperature is 8046.30 °C. The solar radiation is 108.60 kcal cm-2, and the effective radiation for photosynthesis is 56.70 kcal cm-2. The seawater has a high average annual salinity of 28.24%. The coastal tidal range is large, with average and maximal tidal ranges of 2.51 and 5.52 m, respectively. Guixian Island is the main island, which consists of various ornamental plants. The coastal beach wetlands, which are the most concentrated areas with mangroves, are abundant around the island. The main mangrove community types include Aegiceras corniculatum, Kandelia obovata + Aegiceras corniculatum, Avicennia marina + Aegiceras corniculatum and Avicennia marina. The area is essentially a nature reserve that protects the mangroves in the southern subtropical estuary, harbour and coastal tidal wetland ecosystems, as well as wintering bird habitats.
Fig. 1 Status of the Guixian and Beifengdun island group

Note: LULC: Land use and land cover. 1. Aegiceras corniculatum; 2. Avicennia marina; 3. Kandelia obovate; 4. Tidal flat; 5. Sea; 6. Construction land; 7. Road; 8. Grassland; 9. Shrub; 10. Forest.

2.2 Sampling and UAV aerial photography

Firstly, different types of mangrove communities were selected according to tree age, tide level, planting mode and other factors in the wetlands of the tidal flats around the Guixian and Beifengdun island group. Secondly, a 400 m2 (20 m×20 m) sample plot was set up and divided into 16 smaller samples, each with a size of 25 m2 (5 m×5 m). All mangrove plants in each sample plot were investigated. Thirdly, the number and global positioning system (GPS) position of each mangrove plant, as well as the relative coordinates, plant species, tree height, diameter at breast height (DBH) (measured at 1.3 or 0.3 m), crown width, coverage, phenology and branch number of the mangrove, were measured and recorded. Lastly, the relative coordinates were converted to absolute coordinates, and a basic information database for the mangrove communities was established.
In the low level of the spring tide in June 2019, low-altitude controlled flight tests and data acquisition were executed using the digital camera on the DJI PHANTOM 4 PRO Quadrotor UAV. The image collection time was set when the weather was clear with no continuous wind. The image control points and high-precision GPS positioning measurements were arranged around the two islands for the geometric correction of the UAV images. The heading and lateral overlap for each flight was set to 80% and the camera shutter time was 1/1250 s. A total of 689 UAV photos were collected in the aerial area. The Pix4Dmapper's optimisation and regional network adjustment technologies were utilised to automatically correct the image function, select the photos and obtain valid information (e.g., photo number, longitude, latitude, altitude, roll angle, heading angle and elevation angle), output calculation results, image stitching results, digital ground models and orthophoto maps with a ground spatial resolution of 0.1 m. The images were stored in Tagged Image File Format. The stitched images retained the greyscale information of the three colours (red, green and blue). Each colour contained 8-bit byte information, and the values ranged within 0-255.
To interpret the remote sensing images, the object-oriented multi-scale segmentation method in the eCognition 9.1 software was used to segment the images. Based on the pixel segmentation at a 10-segment scale, the shape index and compactness were set to 0.1 and 0.5, respectively. The weight of the band was set to 1. The selected spectral features include the brightness value and the mean values of bands 1, 2 and 3, the selected geometric features include the aspect ratio and shape index and the selected texture features include the grey level co-occurrence matrix information entropy (all directions). The support vector machine classification method was used to extract the mangrove community information. The results of the automatic classification were adjusted according to the field investigation and verification. The island community was then divided into 10 utilisation types, and the ArcGIS 10.5 software was used to map the utilisation status of the island group and quantitatively describe the distribution of the mangrove communities.

2.3 ANOVA and allometric growth equation

One-way ANOVA was adopted to determine whether the different levels of a control variable exert a significant impact on the observed variables (Xue, 2011). Assuming that control variable A had k levels and each level had r observations, then the observations of the jth test at level Ai can be defined as:
${{x}_{ij}}={{u}_{i}}+{{\varepsilon }_{ij}}, i=1,2,\cdot \cdot \cdot,k;j=1,2,\cdot \cdot \cdot,r$
where ${{x}_{ij}}$represents the ith experimental value at the jth level, ${{u}_{i}}$is the expected value of the observed variable at level Ai and ${{\varepsilon }_{ij}}$is the sampling error, which is an independent random variable that follows the normal distribution N(0, 2).
$\mu =\frac{1}{k}\sum\limits_{i=1}^{k}{{{u}_{i}}}$
where μ is the total expected value of the observed variable.
${{a}_{i}}={{u}_{i}}-\mu, i=1,2,\cdot \cdot \cdot,k$
where ai is the additional influence of the control variable Ai on the experimental result (also called the effect of Ai on the observed variable) and $\sum\limits_{i=1}^{k}{{{a}_{i}}}=0.$ Substituting Equation (3) into Equation (1) yields:
${{x}_{ij}}=\mu +{{a}_{i}}+{{\varepsilon }_{ij}}, i=1,2,\cdot \cdot \cdot,k;j=1,2,\cdot \cdot \cdot,r$
One-way ANOVA was performed to infer whether all effects of the control variable A were zero at the same time.
The biomass of each mangrove plant was estimated using the allometric growth equation (Tam et al., 1995). This study selected the allometric growth equations of mangrove plants in the Futian mangrove area of Shenzhen, Beibu Gulf (Table 1). The stem, branch, leaf, root and total aerial biomasses were calculated according to these equations, and the sum of the biomasses of each component was calculated to obtain the total biomass of each mangrove plant.
Table 1 Allometric growth equations of the mangrove plants
Plant species Plant component Allometric growth equation
A. corniculatum Stem $\ln SB=1.198\text{+}0.464\ln (DB{{H}^{2}}\times HT)$
Branch $\ln BB=1.110\text{+}0.463\ln (DB{{H}^{2}}\times HT)$
Leaf $\ln LB=0.393\text{+}0.475\ln (DB{{H}^{2}}\times HT)$
Root $\ln RB=0.967\text{+}0.303\ln (DB{{H}^{2}}\times HT)$
Total aerial biomass $\ln TB=1.496\text{+}0.465\ln (DB{{H}^{2}}\times HT)$
A. marina Stem $\ln SB=1.643\text{+}0.544\ln (DB{{H}^{2}}\times HT)$
Branch $\ln BB=1.897\text{+}0.567\ln (DB{{H}^{2}}\times HT)$
Leaf $\ln LB=0.690\text{+}0.287\ln (DB{{H}^{2}}\times HT)$
Root $\ln RB=1.361\text{+}0.615\ln (DB{{H}^{2}}\times HT)$
Total aerial biomass $\ln TB=2.092\text{+}0.529\ln (DB{{H}^{2}}\times HT)$
K. obovata Stem $\ln SB=2.162\text{+}0.869\ln (DB{{H}^{2}}\times HT)$
Branch $\ln BB=2.741\text{+}1.253\ln (DB{{H}^{2}}\times HT)$
Leaf $\ln LB=1.706\text{+}0.943\ln (DB{{H}^{2}}\times HT)$
Root $\ln RB=2.433\text{+}0.990\ln (DB{{H}^{2}}\times HT)$
Total aerial biomass $\ln TB=2.814\text{+}1.053\ln (DB{{H}^{2}}\times HT)$

3 Results

3.1 Structural characteristics of the mangrove community

The investigation results of the mangrove sample plot indicate that the growth and development of the mangrove community in the Guixian and Beifengdun island group were satisfactory (Table 2). The average height of A. corniculatum was 1.97 m. The community was relatively short, but the branches were numerous; the maximum number of branches of a single tree reached 39. The branches grew tightly and the crown was small, but the leaves were dense and the coverage was high, even reaching 98%. The tallest Note: SB: biomass of the stem; BB: biomass of the branch; LB: biomass of the leaf; TB: total aerial biomass; RB: biomass of the root; DBH: breast height diameter (m); HT: tree height (m); the unit for biomass is kg.species was A. marina, with an average height of 2.93 m. The stem of this species was thick, the maximum DBH of a single tree was 25 cm, the branches were scattered and the crown was large, but the coverage was low. The mixed growth of K. obovata with A. corniculatum and A. marina was distributed sporadically. The plants were tall but the stems were thin. Moreover, the number of branches was large, but the crown width and coverage were small. The leaves of K. obovata were emerald green, and its main community growth characteristics ranged between those of A. corniculatum and A. marina.
Table 2 Mangrove growth characteristics in the plot
Plant species Plant number Plant height (m) Breast-height diameter (cm) Branch count (number) Crown (m) Coverage (%)
A. corniculatum 5527 1.97±0.32c 4.14±1.50c 5.67±3.96a 1.06±0.53c 0.98±3.03a
A. marina 582 2.93±0.80a 8.52±4.56a 1.67±1.61c 2.28±1.48b 0.62±0.32b
K. obovata 839 2.59±0.67b 5.34±2.36b 3.07±3.10b 1.29±0.63a 0.64±0.39ab

Note: The data are expressed as mean ± standard error; a, b and c indicate significant differences (P<0.05) after the Tukey's honestly significant difference test amongst the different tree species through one-way ANOVA.

The relative abundance, significance, frequency and importance values of A. corniculatum, A. marina and K. obovata were calculated using the mangrove plot survey data; and A. corniculatum obtained the highest values amongst the three in terms of all criteria (Table 3). The importance value of A. corniculatum was 59.18, which was higher than those of K. obovata and A. marina. This value signifies that the former was the dominant species in the mangrove community. The relative abundance and frequency of K. obovata were less than those of A. marina, but the relative significance and importance value of the former were larger than those of the latter. The relative abundance, significance and importance value of A. marina were the smallest amongst the three species. These indices indicated that the species diversity in the island group was not high. The importance values of the different mangrove communities reflected the different positions of dominance for each species. As the dominant tree species of the mangrove community, A. corniculatum existed in large numbers. Although the mangrove forest was in the core area of the Maoweihai Mangrove Forest Reserve, most of the mangrove communities were not primary communities, but artificially cultivated secondary communities.
Table 3 Dominant species in the mangrove community
Plant species Relative abundance Relative significance Relative frequency Importance
value
A. corniculatum 79.55 62.26 35.71 59.18
A. marina 12.08 11.22 33.33 18.88
K. obovata 8.38 26.51 30.95 21.95
The mangrove communities, such as A. corniculatum, A. marina and K. obovate, were widely distributed in the tidal flats around the islands (Fig. 1). The high-resolution remote sensing image of the community of the Guixian and Beifengdun island group was divided into 13067 map spots and 10 landscape types. The areas of various mangrove community landscapes were calculated using the ArcGIS 10.5 software (Table 4). In the island community, the land and sea areas were about 10.10 and 17.00 ha, respectively, and the mangrove covered about 11.20 ha, or approximately 41.32%, of the total area of the island group. In the mangrove community, the area covered by A. corniculatum reached 8.75 ha (78.12%), making it the most widely distributed amongst the species present in the area, followed by K. obovata at about 1.61 ha (14.39%) and A. marina at only 0.84 ha (7.50%).
Table 4 Landscape types in the Guixian and Beifengdun island group
Landscape type Map spots (number) Perimeter
(m)
Area (m2) Proportion (%)
A. corniculatum 2262 56264.87 87467.65 32.27
A. marina 1648 13714.92 8393.98 3.10
K. obovate 5660 34476.48 16109.60 5.94
Tidal flat 501 8162.96 10780.81 3.98
Sea 768 12808.30 47257.78 17.44
Construction land 56 2855.68 11872.33 4.38
Road 232 7073.00 13798.78 5.09
Grassland 1201 12415.44 9912.02 3.66
Shrub 133 4510.75 8419.65 3.11
Forest 606 21762.67 57000.52 21.03
Total 13067 174045.07 271013.12 100.00

3.2 Biomass of the mangrove communities

The biomass of the mangrove plants was estimated using the allometric growth equation. The biomasses of the stem, branch, leaf and root, as well as the total aerial biomass of the three dominant species, were calculated separately. The sum of the biomasses of each component was then calculated to obtain the total biomass of each mangrove plant (Fig. 2). The results of multiple comparisons of the mangrove plant biomasses indicated significant differences amongst the three species. A. marina achieved the highest biomass (18.52 kg plant-1), followed by K. obovate (7.84 kg plant-1) and A. corniculatum (3.85 kg plant-1). The values of the stem, branch, leaf and total aerial biomasses can be arranged by species as A. marina > K. obovata > A. corniculatum, and the differences amongst the three were significant. For the root biomass, the species can be arranged as K. obovata > A. marina > A. corniculatum. In this case, the difference between A. marina and K. obovata was small, whereas the differences between these two and A. corniculatum were significant.
Fig. 2 Biomasses of the mangrove communities (kg plant-1)
The biomass per unit area of a mangrove plant can be obtained by summing the biomasses of each mangrove plant in the survey plot and dividing the sum by the corresponding area (Table 5). Amongst the three species, the biomass per unit area of K. obovata was the highest (1563.72 t ha-1), followed by A. marina (1084.47 t ha-1) and A. corniculatum (910.87 t ha-1). The total aerial biomass of A. marina was relatively high, accounting for 88.30% of the total biomass. The total aerial biomass of K. obovata was 1.5 times its underground biomass, whereas that of A. corniculatum was almost equal to its underground biomass. For the biomass per unit area of each component, the following sequences can be generated: A. corniculatum, roots > stems > branches > leaves; A. marina, branches > stems > roots > leaves; and K. obovata, roots > stems > branches > leaves. The biomass differences amongst the unit areas of each component of the different mangrove communities were significant.
Table 5 Biomasses of mangrove plants (Unit: t ha-1)
Plant species Stem Branch Leaf Root Total aerial Total plant
A. corniculatum 266.57 218.89 39.29 386.12 526.49 910.87
A. marina 323.66 537.52 89.94 133.35 957.66 1084.47
K. obovata 496.00 385.75 126.79 555.18 1027.46 1563.72

3.3 Carbon storage of mangrove communities

The total carbon storage of each mangrove plant can be calculated by multiplying the stem, branch, leaf, root and total aerial biomasses of the mangrove plants by the carbon content of each component, and then adding the carbon storage of all components (Fig. 3). The carbon storage of mangrove communities was positively correlated with the biomass, and the differences amongst the three species were significant. A. marina exhibited the highest carbon storage (1.79 kg plant-1), followed by K. obovata (0.74 kg plant-1) and A. corniculatum (0.42 kg plant-1). The differences of the three species in terms of either the carbon storage of the individual components or the total aerial carbon storage were significant. The comparison of the leaf and root carbon storages showed no significant differences between A. marina and K. obovata, but significant differences existed between these two and A. corniculatum.
Fig. 3 Carbon storage levels of the mangrove community (kg plant-1)
The carbon stock of each type of mangrove plant was divided by the corresponding area to obtain the carbon density of the mangrove plants in the sample (Table 6). The carbon density of K. obovata was the highest (148.03 t ha-1), followed by A. marina (104.79 t ha-1) and A. corniculatum (99.24 t ha-1). The carbon densities of the components of A. corniculatum, A. marina and K. obovata can be arranged as: stem > root > branch > leaf; stem > branch > root > leaf; and root > stem > branch > leaf, respectively. No significant differences were observed in the carbon density of the stems of the three species. The carbon density of the branches of A. corniculatum was small and different from those of the other two species. The carbon densities of the roots of the three species were significantly different. The leaves contained the lowest carbon density amongst the components, and the corresponding differences amongst the three species were significant.
Table 6 Carbon density of mangrove plants
Plant species Stem
(t ha-1)
Proportion for stem (%) Branch
(t ha-1)
Proportion for branch (%) Leaf
(t ha-1)
Proportion for leaf (%) Root
(t ha-1)
Proportion for root (%)
A. corniculatum 57.31 57.75 10.51 10.59 1.30 1.31 30.12 30.35
A. marina 52.76 50.35 32.79 31.29 2.97 2.83 16.27 15.53
K. obovata 50.10 33.84 36.26 24.50 8.37 5.65 53.30 36.01
The carbon storage values of various types of mangrove plants were calculated according to the area and carbon density of each different mangrove species (Table 7). The total carbon storage of the mangrove community in the Guixian and Beifengdun island group was 1194.70 t, amongst which that of the A. corniculatum community was the largest (868.35 t), followed those of the K. obovata (238.33 t) and A. marina (88.02 t) communities. The main reasons for these findings can be explained by differences in the distribution areas. The distribution area of the A. corniculatum community was the widest, at almost 4.1 times that of the A. marina community. Moreover, the carbon density of the K. obovata community was the largest, at 1.5 times that of the A. corniculatum community; while the distribution area of the A. marina community was the smallest amongst the three.
Table 7 Carbon storage of mangrove plants
Plant species Area (ha) Carbon density
(t ha-1)
Carbon
storage (t)
Proportion (%)
A. corniculatum 8.75 99.24 868.35 72.68
A. marina 0.84 104.79 88.02 7.37
K. obovata 1.61 148.03 238.33 19.95
Total 11.20 106.67 1194.70 100.00

4 Discussion

The characteristics of the mangrove community were obvious, but the diversity of the mangrove species was low. Mangrove plants grew densely, with the average densities of A. corniculatum, A. marina and K. obovata of 18.53, 5.85 and 19.93 plant m-2, respectively, all of which were higher than the density of mangroves in other regions within and outside of the country. Moreover, the mangrove plants exhibited excellent growth. The plant heights of the three species were 1.97, 2.93 and 2.59 m plant-1 respectively, which were greater than the heights of plants in many other areas. The diversity index of the mangrove plants was low, as most of the plants were a single species of either A. corniculatum, A. marina or K. obovate. A. corniculatum was the dominant mangrove community, accounting for 78.12% of the total mangrove area and having an importance value of 59.18. The Guixian and Beifengdun islands were located at the mouth of the river. The intertidal zone was rich in tidal flats, the soil was fertile and the development and growth of mangroves were satisfactory. In addition, the area was the core area of the Mangrove Nature Reserve. Most mangrove communities were found to be secondary mangroves (i.e., not native mangroves) with low species diversity.
The growth of mangrove communities is affected by several factors, including tree species, age and environment (temperature, precipitation, soil and salinity). Different tree species have different structures and growth characteristics, and similar tree species are known to exhibit different traits in different geographical conditions and growth environments. Even in the same area, the community of similar tree species still demonstrate great variations with tidal level, salinity and planting patterns. In addition, the biomass and carbon storage of mangroves increased with the increase of tree age. The biomasses of A. corniculatum, A. marina and K. obovata in the study area were 910.87, 1084.47 and 1563.72 t ha-1, respectively, which were generally higher than in Shenzhen Futian, Zhanjiang Fucheng, Hainan Dongzhai and other areas. The carbon storage levels of the three species can reach 99.24, 104.79 and 148.03 t ha-1, respectively, compared with the average carbon storage of mangroves in the world of 159 t ha-1, with a maximum value of 435 t ha-1. The differences in the biomass and carbon storage were essentially the result of a combination of factors, such as climate, topography, soil, tides, vegetation, biology and age. In addition, the area was located in the core scenic spot of Xiandao Park in the Guangxi Zhuang Autonomous Region, and most of the mangroves were man-made mangroves which are effectively protected. The mangrove plant density was high, and the biomass and carbon storage were larger than those in the surrounding mangrove communities.

5 Conclusions

Using a sample plot survey and aerial photography of low-altitude drones, this study analysed the structural characteristics of the mangrove island ecosystem in the Beibu Gulf using one-way ANOVA. Allometric growth equations were used to estimate the biomass and carbon storage of A. corniculatum, A. marina and K. obovata. The following conclusions were obtained:
(1) The Guixian and Beifengdun islands are typical subtropical mangrove island ecosystems, which are mainly composed of A. corniculatum, K. obovate + A. corniculatum, A. marina + A. corniculatum and A. marina communities. The average height of A. corniculatum was 1.97 m plant-1, the community was relatively short and the average number of branches of each tree was 5.67. The number of branches of A. marina was relatively high. The average height of this species was 2.93 m plant-1, the DBH was 8.52 cm and the crown width was 2.28 m plant-1. The main community characteristics of K. obovata ranged between those of the other two species. The area of the mangrove community was about 11.20 ha, which accounted for about 41.32% of the total area of the island group. The area covered by A. corniculatum was 8.75 ha, which accounted for 32.27% of the total area of the island group, therefore, A. corniculatum is the dominant species and establishment species in the mangrove community.
(2) The biomass of A. marina was the highest (18.52 kg plant-1), followed by that of K. obovata (7.84 kg plant-1) and A. corniculatum (3.85 kg plant-1). In terms of the biomasses of the components, the three species can be arranged as follows: For stem, branch and leaf, A. marina > K. obovata > A. corniculatum; and for roots, K. obovata > A. marina > A. corniculatum. The carbon density of K. obovata was the highest (148.03 t ha-1), followed by that of A. marina (104.79 t ha-1) and then A. corniculatum (99.24 t ha-1). The total carbon stock of the mangrove island ecosystem was 1194.70 t. Given that the area of A. corniculatum was widely distributed, its carbon storage was also the largest (868.35 t), followed by that of K. obovata (238.33 t) and then A. marina (88.02 t). The carbon stocks of the Guixian and Beifengdun island community ecosystem were higher than those of other regions at the same latitude, and the carbon dioxide absorption and storage capacity are strong, which play an important role in the carbon cycle and regional carbon balance.
[1]
Alongi D M. 2008. Mangrove forests: Resilience, protection from tsunamis, and responses to global climate change. Estuarine, Coastal and Shelf Science, 76(1): 1-13.

[2]
Bouillon S. 2011. Storage beneath mangroves. Nature Geoscience, 4(5): 282-283.

DOI

[3]
Chave J, Andalo C, Brown S, et al. 2005. Tree allometry and improved estimation of carbon stocks and balance in tropical forests. Oecologia, 145(1): 87-99.

DOI PMID

[4]
Dittmar T, Hertkorn N, Kattner G, et al. 2006. Mangroves, a major source of dissolved organic carbon to the oceans. Global Biogeochemical Cycles, 20(1): 152-167.

[5]
Donato D C, Kauffman J B, MacKenzie R A, et al. 2012. Whole-island carbon stocks in the tropical Pacific: Implications for mangrove conservation and upland restoration. Journal of Environmental Management, 97: 89-96.

DOI PMID

[6]
Donato D C, Kauffman J B, Murdiyarso D, et al. 2011. Mangroves among the most carbon-rich forests in the tropics. Nature Geoscience, 4(5): 293-297.

DOI

[7]
Duarte C M, Middelburg J J, Caraco N. 2005. Major role of marine vegetation on the oceanic carbon cycle. Biogeosciences, 2(1): 1-8.

DOI

[8]
Duke N C, Meynecke J O, Dittmann S, et al. 2007. A world without mangroves? Science, 317(5834): 41-42.

PMID

[9]
FAO. 2008. The world's mangroves 1980-2005. FAO Forestry Paper, (4): 703-704.

[10]
He Q F, Zheng W, Huang X R, et al. 2017. Carbon storage and distribution characteristics of mangroves in Qinzhou Bay, Guangxi. Journal of Central South University of Forestry and Technology, 37(11): 121-126. (in Chinese)

[11]
Jin L, Lu C Y, Ye Y, et al. 2013. Study on carbon storage and carbon sequestration function of candel mangrove in Jiulong River Estuary. Fujian Forestry Science and Technology, 56(4): 7-11. (in Chinese)

[12]
Kathiresan K, Bingham B L. 2001. Biology of mangroves and mangrove ecosystems. Advances in Marine Biology, 40(1): 81-251.

[13]
Khan M N I, Suwa R, Hagihara A. 2007. Carbon and nitrogen pools in a mangrove stand of Kandelia obovate (S., L.) Yong: Vertical distribution in the soil-vegetation system. Wetlands Ecology and Management, 15(2): 141-153.

DOI

[14]
Kirue B, Kairo J G, Karachi M. 2007. Allometric equations for estimating above ground biomass of Rhizophora mucronata Lamk. (Rhizophoraceae) mangroves at Gaxi Bay, Kenya. Western Indian Ocean Journal of Marine Science, 5: 27-34.

[15]
Komiyama A, Ong J E, Poungparn S. 2008. Allometry, biomass, and productivity of mangrove forests: A review. Aquatic Botany, 89(2): 128-137.

DOI

[16]
Li H Y, Peng Y S, Liu J J, et al. 2016. Species composition and community characteristics of mangroves along the coast of eastern Guangdong. Acta Ecologica Sinica, 36(1): 252-260. (in Chinese)

DOI

[17]
Li Y Z, Zhao Z Z, Wang H P, et al. 2018. Distribution characteristics of organic carbon in sediments of mangrove wetland in Dongzhai Harbor, Hainan. Journal of Anhui Agricultural University, 45(2): 268-273. (in Chinese)

[18]
Lu W Z, Lin G X, Wang C M, et al. 2014. Carbon storage and falling matter dynamics of secondary and primary mangrove communities in Zhanjiang, Guangdong. Marine Environmental Science, 33(6): 913-919. (in Chinese)

[19]
Mitra A, Sengupta K, Banerjee K. 2011. Standing biomass and carbon storage of above-ground structures in dominant mangrove trees in the Sundarbans. Forest Ecology and Management, 261(7): 1325-1335.

DOI

[20]
Nordhaus I, Wolff M, Diele K. 2006. Litter processing and population food intake of the mangrove crab Ucides cordatus in a high intertidal forest in northern Brazil. Estuarine, Coastal and Shelf Science, 67(1-2): 239-250.

[21]
Poret N, Twilley R R, Rivera-Monroy V H, et al. 2007. Belowground decomposition of mangrove roots in Florida coastal everglades. Estuaries & Coasts, 30(3): 491-496.

[22]
Tam N F Y, Wong Y S, Lan C Y, et al. 1995. Community structure and standing crop biomass of a mangrove forest in Futian Nature Reserve, Shenzhen, China. Hydrobiologia, 295(1-3): 193-201.

DOI

[23]
Twilley R R, Chen R H, Hargis T. 1992. Carbon sinks in mangroves and their implications to carbon budget of tropical coastal ecosystems. Water, Air, and Soil Pollution, 64(1-2): 265-288.

[24]
Xue W. 2011. Statistical analysis and application of SPSS. Beijing, China: Renmin University of China Press.

Outlines

/