Ecosystem Assessment

Sustainable Livelihood Security in the Poyang Lake Eco-economic Zone: Ecologically Secure, Economically Efficient or Socially Equitable?

  • WU Zhilong , 1, * ,
  • ZENG Tian 1, 2 ,
  • HUANG Jin 3
Expand
  • 1. Institute of Ecological Civilization, Jiangxi University of Finance and Economics, Nanchang 330013, China
  • 2. School of Marxism, Jiangxi University of Applied Science, Nanchang 330100, China
  • 3. Financial College of Jiangxi Normal University, Nanchang 330022, China

Received date: 2020-11-04

  Accepted date: 2021-03-04

  Online published: 2022-04-18

Supported by

The National Natural Science Foundation of China(41861036)

The China Postdoctoral Science Foundation(2018M630738)

The Natural Science Foundation of Jiangxi Province(20192BAB213023)

The Young Doctor Fund of Jiangxi Social Science Plan(17BJ38)

The Humanities and Social Sciences Research Project of Jiangxi Universities(GL18238)

The Postdoctoral Daily Fund of Jiangxi Province in 2018(2018RC29)

The Jiangxi Provincial Postdoctoral Science Foundation(2019KY11)

The Science and Technology Project of Education Department of Jiangxi Province(GJJ200504)

Abstract

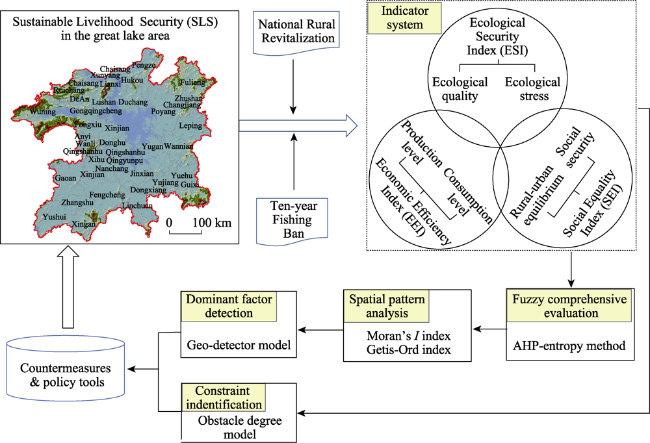
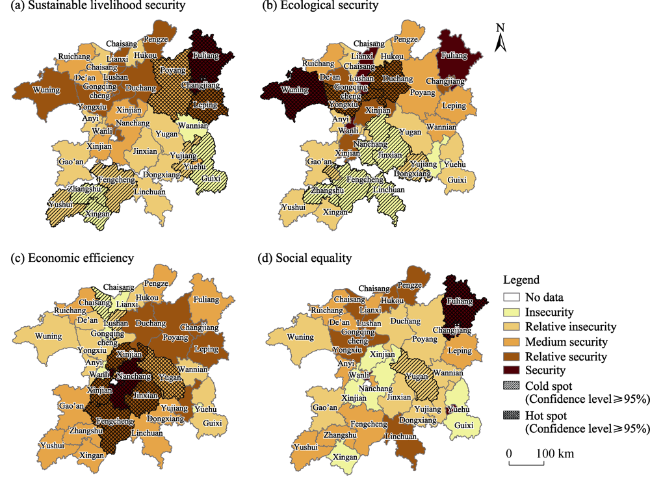
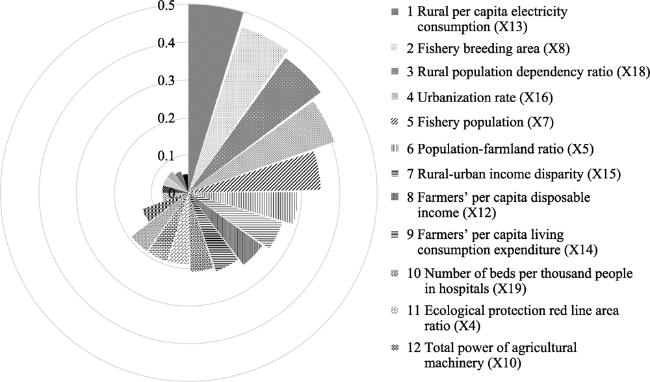
Sustainable Livelihood Security (SLS) remains a rarely considered yet important issue for rural sustainability and natural resource management. Particularly in China, rural SLS research in a typical area is urgently needed, but insufficient under the background of National Rural Revitalization and Ten-year Fishing Ban of Yangtze River. Focusing on the policy-targeted inland lake area, we proposed a Livelihood Security Analysis (LSA) framework by establishing an adaptive indicator system and integrating multiple econometrical and geographical methods. This study aims to evaluate the SLS in Poyang Lake Eco-economic Zone comprehensively from the three aspects of ecology, economy and society, analyze their spatial patterns, identify the main constraints, and finally give specific suggestions for improving rural sustainability management. The results showed that rural SLS in the inland great lake area tended to be vulnerable mainly due to the lagging economic efficiency and unbalanced social equality, and mediated by regional ecological characteristics. The overall SLS and Ecological Security Index (ESI) were higher in the north and lower in the south, while Economic Efficiency Index (EEI) and Social Equality Index (SEI) were at the middle level and circularly distributed around Nanchang City. The dominating factors which have greatly shaped the spatial pattern of SLS include rural per capita electricity consumption, fishery breeding area, population dependency ratio, urbanization rate, and fishery population. The obstacle degree is ranked as economic system > social system > ecological system. An outdated economy and incomplete social services are the main constraints, characterized by weak electricity consumption, limited beds in hospitals, low urbanization rate, deficient agricultural machinery power, and a small agricultural output value. Therefore, one urgent need is to activate the rural economy by reinforcing rural electric power facilities and promoting agricultural mechanization. In addition, transforming the peasants/fishermen to the non-agricultural sector should be accelerated, which will help to reduce ecological pressure, boost urban-rural integration and narrow the income gap.

Cite this article

WU Zhilong , ZENG Tian , HUANG Jin . Sustainable Livelihood Security in the Poyang Lake Eco-economic Zone: Ecologically Secure, Economically Efficient or Socially Equitable?[J]. Journal of Resources and Ecology, 2022 , 13(3) : 442 -457 . DOI: 10.5814/j.issn.1674-764x.2022.03.009

1 Introduction

Rural recession, such as the aging of population (Liu, 2014; Liu and Li, 2017a), ecological degradation (Cobbinah et al., 2015; Dong et al., 2015), farmland abandonment (Xie and Wu, 2020), and poverty concentration (Hilson, 2010; Liu and Cao, 2017), among others, are severe problems in rural development (Liu and Li, 2017b). In view of these issues, the Chinese government clearly announced its intention to revitalize rural development and advanced it to a national strategic priority in 2018, so as to achieve the overall goal of “industrial prosperity, livable ecology, rural civilization, effective governance, and affluent life” in rural areas. Rural revitalization, as a systems engineering, has rich connotations and multi-objects. It connects with millions of rural farmers, and requires adhering to the farmers' position and putting sustainable livelihood first (Liao and Chen, 2017). Therefore, ensuring the livelihood security of farmers and enhancing the rural sustainability are not only the internal requirements of rural revitalization, but also important methods to promote rural revitalization.
Sustainable Livelihood Security (SLS) was first proposed by Swaminathan (1991), and is defined as “livelihood choices including ecological security, economic efficiency and social equity, and emphasizes the coupling and harmonious between ecological, economic and social systems”. SLS is aligned with the concept of sustainable development and has rich connotations. It implies the protection and continuation of the current and long-term livelihood strategy, which embodies both intra-generational equity and inter-generational equity (Chambers and Conway, 1992). At the macro level, SLS requires a stable population, decreasing environmental pressure, orderly economic development, and sustainable resource management. While at the micro level, SLS requires farmers to have sufficient food and cash to meet their basic needs, as well as to maintain the availability of resources, income and assets that can hedge their risks (McCracken and Pretty, 1988). Therefore, the SLS index is widely used in the evaluation of regional sustainable development, especially in the relatively underdeveloped rural areas (Singh and Hiremath, 2010; You and Zhang, 2017; Zhou and Chen, 2018). The SLS index is also used to analyze the livelihood security of individual farmers or special groups of rural households, for example, the farmers in the Kalijhora Highlands, Nepal (Bhandari and Grant, 2007). Moreover, the SLS index is applied to livelihood impact analysis of policy projects, such as the terrace building project on the slope farmland in the Loess Plateau (Tang et al., 2013).
Although there are numerous publications on SLS research, there is still a lack of a standard analytical framework which can provide efficient methods, guide the research procedures, and help with problem analysis. Some researchers have attempted to provide only a theoretical framework instead of practical tools and methods for measuring livelihood security. For example, the Environmental Livelihood Security (ELS) framework proposed by Biggs et al. (2015) to incorporate the water, energy and food nexus into the environment-livelihood relationship. However, they provide no further guidance on how to accomplish their goals in the field. This makes the framework difficult to operationalize and use. Further, Singh and Hiremath (2010) developed an indicator framework for assessing livelihood security using 11 indicators with subjective weights. However, that framework is unable to identify the key variables and constraint factors. The other relevant frameworks may also have various problems, such as being seemingly biased (Biggs et al., 2015), too complicated (DFID, 2000; Quandt, 2018), out of scale (Lindenberg, 2002), or not fully fitting the security situation (Table 1). There is no one-size-fits-all analytical framework for SLS evaluation. Especially in some typical areas, such as the distinct poor region (Singh and Hiremath, 2010; Gecho et al., 2014), the policy targeting area (Clover and Eriksen, 2009), and the ecologically vulnerable area (Wang et al., 2016), the choice of indicators should be targeted and adaptive to the specific situation (Saleth and Swaminathan, 1993; Uma, 1993; Sherbinin et al., 2008).
Table 1 Summary of livelihood analysis frameworks
Representative framework Main advantages Potential limitations Reference Targeted area
Human Development
Index (HDI)
Consisting of three indicators: life expectancy, adult literacy rate and the logarithm of GDP per capita, the HDI allows for easy and comprehensive assessment of the social development, and helps to work out corresponding strategies The HDI is mainly derived from social and economic scope, and may neglect the ecology and environmental protection UNDP, 1990 Worldwide application
Sustainable Livelihood Analysis (SLA) framework Composed of vulnerability context, livelihood capital, transformation of structures and institutions, livelihood strategy and livelihood outcomes, SLA framework provides a checklist of important questions for livelihood study It requires a lot of resources and a high level of skill, which makes it difficult to operationalize and use Department for International Development
(DFID), 2000
Developing countries/areas
Household Livelihood Security (HLS) HLS has eight sub-components based on availability, accessibility, quality, and use and status of basic elements of livelihood security. It helps to identify the constraints to livelihood security The HLS approach is highlighted at the family or community level, but not suitable on a larger scale Lindenberg, 2002 Developing countries/areas
Vulnerability framework Vulnerability framework elaborates the complexity and relevance of internal components, i.e. exposure, sensitivity and resilience This framework is conceptual and does not provide detailed indicators or specific methods Turner et al., 2003 -
Sustainable Livelihood Security Index (SLSI) The SLSI index is comprehensively thinking and takes the ecological, economic and social systems into account It is hard to identify the key variables and obstacle factors with a subjective weight for each indicator Singh and Hiremath, 2010 Gujarat, India
Environmental Livelihood Security (ELS) framework This framework fully illustrates the water, energy and food nexus in the environment system, and the vulnerability, assets and outcome nexus in the livelihood system ELS may be insufficient for assessing livelihood security by merely focusing on the relationship between environment and livelihood Biggs et al., 2015 Tonle Sap Lake area, Cambodia
Household Livelihood Resilience Approach (HLRA) The HLRA draws from the sustainable livelihoods approach and provides detailed indicators associated with five capital assets It may be hard to operate with the HLRA as it requires a large dataset to fulfill 25 indicators Quandt, 2018 Isiolo County, Kenya
The inland great lake areas in China, such as the Poyang Lake area, the Dongting Lake area, and the Qinghai Lake area, are often economically backward, ecologically vulnerable, and national policy-targeted areas simultaneously. These lakes are all important environmental treasure houses and special economic zones in China (Wang, 2004; Zhao et al., 2007). In recent years, due to the accelerated economic development, dense population and increasing pressures on resources and the environment, a series of problems have emerged in these great lakes, such as shrinking water area (Tian et al., 2016b; Wang, 2018), deteriorating water quality (Du et al., 2018; Liu et al., 2018), biodiversity reduction (Huang and Guo, 2007; Sun et al., 2015), and an imbalance between economic and social development (Wang and Ye, 2018; Hu, 2019; Zhao and Liu, 2019), and others. These problems pose serious threats to the local livelihood security. Especially in rural areas, the per capita net income of farmers is not merely far behind the surrounding cities, but also lower than the average level of the province in which they are located (Hu, 2019). In 2019, the ten-year Fishing Ban in the Yangtze River Basin was formally implemented. Poyang Lake and Dongting Lake, as the first and the second largest lakes connecting to the Yangtze River, respectively, were required to implement a total ban on fishing by the end of 2020. This will also bring further uncertainty to the rural SLS in the lake areas. However, at present, there are insufficient studies and resources being devoted to rural SLS in the great lake areas, and a corresponding analytical framework which fits the lake situation is also lacking.
In light of the fact that research on rural SLS in lake areas remains scarce, this study aims to: 1) Introduce an innovative methodological framework which is suitable and practical for livelihood assessment and problem analysis; 2) Evaluate the SLS in the inland great lake areas and its spatial pattern from the perspectives of ecological security, economic efficiency and social equality; 3) Identify the dominant influencing factors and constraints of SLS; and 4) Provide specific and practical suggestions for improving livelihood security and rural sustainability. The framework proposed in this study can be applicable to other similar areas by the merit of its simplicity and flexibility. The research findings may be helpful for the implementation of the National Rural Revitalization and Fishing Ban Project in China, and also provide reference for future SLS research and rural sustainability management in similar areas worldwide.

2 Livelihood Security Analysis (LSA) framework

As depicted in Fig. 1, the LSA framework is focused on, but not limited to, analyzing the sustainable livelihood security in the great lake area. The framework is mainly composed of six parts: indicator system, comprehensive evaluation, spatial pattern analysis, dominant factor detection, constraint identification, and countermeasures or policy tools. These six sections form a standard procedure for livelihood security assessment and problem analysis. 1) Most importantly, the indicator system has adopted a fixed structure of three sub-goal indexes (i.e., Ecological Security Index, Economic Efficiency Index, and Social Equality Index) and six criterion-level indexes (i.e., ecological quality, ecological stress, production level, consumption level, rural-urban equilibrium and social security). However, the specific indicators and indicator number are flexible and can be selected according to the actual situations of the study areas. This semi-fixed structure makes the indicator system more adaptive and applicable in practice. 2) In the SLS evaluation step, an AHP-Entropy combined weighting method is employed, which is more objective and accurate than each individual method. The fuzzy comprehensive evaluation method is also widely accepted for its simplicity and efficiency. 3) The spatial auto-correlation model based on a GIS platform is used to visualize the spatial pattern of rural SLS, and the local Getis-Ord $G_{i}^{*}$index helps to identify both the hot spots and the cold spots. 4) The dominant factors in shaping the spatial pattern of SLS are detected through the Geo-detector model. 5) While the obstacle degree model is quite capable of identifying the constraints. 6) Finally, after going through the former procedures, countermeasures and policy feedback according to the constraints and dominant factors can be generated for SLS improvement and rural sustainability management.
Fig. 1 A framework for livelihood security analysis in the great lake area

Note: The livelihood security analysis framework established in this paper is applicable to all the great lakes region, not specifically Poyang Lake region.

2.1 SLS indicator system

Based on the indicator systems of previous studies (Saleth and Swaminathan, 1993; Singh and hiramath, 2010; Wang et al., 2016; You and Zhang, 2017) and the local situation of Poyang Lake Eco-Economic Zone, this study establishes an adaptive index system that is classified into four layers: Goal layer, sub-goal layer, criterion layer and basic indicator layer (Table 2).
Table 2 The indicator system of rural SLS in the Poyang Lake Eco-economic Zone
Goal layer Sub-goal layer Criterion layer Indicator layer Indicator description Entropy weight Comprehensive weight


Sustainable Livelihood Security
(SLS)


Ecological Security Index
(ESI) (0.33)


Ecological quality (0.50)
1 Forest coverage (%) The ratio of forest land to total land area, data from Jiangxi Provincial Department of Natural Resources (+) 0.19 0.0318
2 Water area ratio (%) The ratio of rivers, lakes, reservoirs, ponds, wetlands, etc. to the total land area, data from Jiangxi Provincial Department of Natural Resources (+) 0.34 0.0567
3 Surface water
environment quality
Measured in accordance with the “Technical Regulations for Urban Surface Water's Environmental Quality Ranking”, which comprehensively shows the pollutant concentration in the water. The higher the value, the heavier the pollution. The annual mean value is adopted, and data come from Jiangxi Provincial Department of Ecological Environment (-) 0.09 0.0152
4 Ecological protection red-line area ratio (%) The ratio of the national ecological protection red line area to the total land area, data from Jiangxi Provincial Department of Ecological Environment (+) 0.38 0.0630


Ecological stress (0.50)
5 Population-farmland ratio (person mu-1) The ratio of rural population to farmland area, calculated based on the data of Jiangxi Statistical Yearbook (-) 0.27 0.0445
6 Chemical fertilizer application intensity
(kg mu-1)
The amount of chemical fertilizer applied per unit area of arable land, calculated according to the data of Jiangxi Statistical Yearbook (-) 0.32 0.0536
7 Fishery population (person) Population engaged in fishery production, data from Jiangxi Statistical Bureau (-) 0.20 0.0338
8 Fishery breeding area (mu*) Data from Jiangxi Statistical Bureau (-) 0.21 0.0348


Economic Efficiency Index
(EEI) (0.33)


Production level (0.50)
9 Total output value of farming, forestry, animal husbandry and fishery (yuan person-1) Per capita output value of farming, forestry, animal husbandry and fishery, data from Jiangxi Statistical Bureau (+) 0.38 0.0637
10 Total power of agricultural machinery (kW) Data from Jiangxi Statistical Bureau (+) 0.49 0.0810
11 Multiple Cropping Index The ratio of the sown area of crops to cultivated land, calculated based on the data of Jiangxi Statistical Yearbook (+) 0.13 0.0220


Consumption level (0.50)
12 Farmers' per capita disposable income
(yuan person-1)
Data from Jiangxi Statistical Bureau (+) 0.21 0.0347
13 Rural per capita electricity consumption (kwh person-1) Rural per capita annual electricity consumption, data from Jiangxi Statistical Bureau (+) 0.68 0.1137
14 Farmers' per capita living consumption expenditure
(yuan person-1)
Data from Jiangxi Statistical Bureau (+) 0.11 0.0183


Social Equality Index
(SEI) (0.33)

Rural-urban
equilibrium (0.50)

15 Rural-urban income disparity (yuan)

Urban residents' disposable income minus farmers' per capita net income, calculated based on Jiangxi Statistical Yearbook data (-)

0.31

0.0512
16 Urbanization rate (%) Data from Jiangxi Statistical Bureau (+) 0.51 0.0856
17 Proportion of rural migrant laborers (%) Proportion of rural laborers seeking jobs outside of their hometown, data from Jiangxi Statistical Bureau (-) 0.18 0.0300


Social security (0.50)
18 Rural population dependency ratio The ratio of non-working-age population to working-age population, calculated according to the data of Jiangxi Statistical Yearbook (-) 0.14 0.0230
19 Number of beds per thousand people in hospitals/public health centers Data from Jiangxi Statistical Bureau (+) 0.48 0.0800
20 Faculty-student ratio of basic education The ratio of professional teachers to the number of students on campus, calculated based on the data of Jiangxi Statistical Yearbook (+) 0.38 0.0637

Note: (+) and (-) represent positive and negative indicators, respectively; (*) the values in the brackets are the AHP weight accordingly. * 1 mu = 0.06667 ha.

From the perspective of ecology, the Ecological Security Index (ESI) is synthetically reflected by the indicators at two levels: ecological quality and ecological pressure. Among them, forest and waters, known as “the lung of the earth” and “the kidney of the earth”, are the basic indicators to reflect the ecological background. In addition, in view of the severe level of water quality deterioration in Poyang Lake and the positive significance of ecological red line demarcation for ecological protection, the environmental quality of surface water and the area ratio of the ecological protection red line are also taken as important ecological background indicators. Ecological pressure can be divided into two parts: land area and water area of Poyang Lake. The pressure on the water area mainly comes from fishing and breeding of fishery. The pressure on the land is mainly manifested in the ratio of rural population to farmland and the excessive application of chemical fertilizer. Therefore, the ecological pressure of each county (district) is comprehensively evaluated by fishery population, fishery breeding area, population-farmland ratio and chemical fertilizer application intensity.
From the perspective of economy, the Economic Efficiency Index (EEI) is comprehensively reflected by the indicators at two levels: production level and consumption level. Among them, the total output value of farming, forestry, animal husbandry and fishery and the total power of agricultural machinery represent the levels of rural productivity and mechanization, respectively. In addition, in view of the serious problem of wasted cultivation in rural areas, the multiple cropping index (MCI) of cultivated land is introduced to check the regional production security. Rural per capita disposable income, rural per capita electricity consumption and farmers' per capita living consumption expenditure are respectively used to evaluate the potential consumption capacity and the actual consumption level in rural areas.
From the perspective of society, the Social Equality Index (SEI) is comprehensively reflected by the indicators of rural-urban equilibrium and social security. The rural-urban gap is first shown in the income disparity between urban and rural residents. Urbanization and labor migration are important factors influencing the rural-urban gap. Therefore, rural-urban income disparity, urbanization rate and proportion of rural migrant laborer are selected to measure the rural-urban gap. Social security mainly embodies the provisions of education, health, and pensions, etc., so this study selects three indicators to quantify the pressure and level of social security, namely, the dependency ratio of the rural population, the number of beds per thousand people in hospitals, and the faculty-student ratio of basic education.

2.2 AHP-entropy combined weighting method

Entropy method is an objective evaluation method of index weighting based on possibility theory, which effectively avoids the influence of human subjectivity, and the evaluation results are more rigorous and accurate (Chu et al., 2015; Cui et al., 2018). The Analytic Hierarchy Process (AHP) is simple and easy to operate, and it is also widely used in subjective weighting of evaluation indexes (Aminbakhsh et al., 2013; Stefanidis and Stathis, 2013). Due to the multi- level nature of the SLS index system, this study uses the approach of combining AHP and entropy method to weight the indicators, that is, the sub-goal level and the criterion level are weighted by AHP, the index layer is weighted by the entropy method, and each index weight is finally obtained based on Weighted Processing. Let the influence weight of the sub-goal layer on the goal layer be w°, the influence weight of the criterion layer on the sub-goal layer be w”, and the influence weight of the index layer on the criterion layer be w‴, then the final weighted weight of each index is:
$w={w}'\times {w}''\times {w}'''$
As the Analytic Hierarchy Process is relatively simple, only the entropy method is described here in detail. The measurement units of different indicators can indeed be different. In order to facilitate the comparison of different indicators, the entropy method requires the standardization of each index. In this study, we adopted the standardization of data ranges, and the expression is as follows:
${{{x}'}_{ij}}=\frac{{{x}_{ij}}-\underset{1\le j\le n}{\mathop{\text{m}in}}\,{{x}_{ij}}}{\underset{1\le j\le n}{\mathop{\text{m}ax}}\,{{x}_{ij}}-\underset{1\le j\le n}{\mathop{\text{m}in}}\,{{x}_{ij}}},\ j\in {{I}^{+}}$
${{{x}'}_{ij}}=\frac{\underset{1\le j\le n}{\mathop{\text{m}ax}}\,{{x}_{ij}}-{{x}_{ij}}}{\underset{1\le j\le n}{\mathop{\text{m}ax}}\,{{x}_{ij}}-\underset{1\le j\le n}{\mathop{\text{m}in}}\,{{x}_{ij}}},\ j\in {{I}^{}}$
where, ${{{x}'}_{ij}}$and ${{x}_{ij}}$ are the standardized and observed values of j sample of index i, respectively; $\underset{1\le j\le n}{\mathop{\text{m}ax}}\,{{x}_{ij}}$and $\underset{1\le j\le n}{\mathop{\text{m}in}}\,{{x}_{ij}}$are the maximum and minimum original values of index i, respectively; ${{I}^{+}}$and ${{I}^{}}$ are the index type, representing a positive index and negative index, respectively, and n is the number of observations.
The proportion ${{P}_{ij}}$of index value of sample j of i index is as follows:
${{P}_{ij}}=\frac{{{{{x}'}}_{ij}}}{\sum\limits_{j=1}^{n}{{{{{x}'}}_{ij}}}}$
The information entropy ei of index i is as follows:
${{e}_{i}}=-\frac{1}{\ln (n)}\sum\limits_{j=1}^{n}{{{P}_{ij}}}\ln ({{P}_{ij}})$
Then the entropy weight (${w}'''$) of the index i is:
${{{w}'''}_{i}}=-\frac{1-{{e}_{i}}}{\sum\limits_{i=1}^{m}{(1-{{e}_{i}})}}$
where, m is the number of indicators, n is the number of observations, $\text{i}\in [1,20]$, $j\in [1,34]$, $0\le {{{w}'''}_{i}}\le 1$, $\sum\limits_{i=1}^{m}{{{{{w}'''}}_{i}}}=1$. According to the AHP and expert scoring, the weights of each sub-goal layer to the total goal layer and the criterion layer to the sub-goal level are equal, that is, the weights of ecological security, economic efficiency and social equity to rural SLS are 0.3333, and the weight of each criterion layer is 0.5. The weight of each index layer to a different criterion layer is determined by the entropy values of the 34 counties (districts) (Table 2). Finally, the weighted processing of each index's comprehensive matrix is W= [0.0318, 0.0567, 0.0152, 0.0630, 0.0445, 0.0536, 0.0338, 0.0348, 0.0637, 0.0810, 0.0220, 0.0347, 0.1137, 0.0183, 0.0512, 0.0856, 0.0300, 0.0230, 0.0800, 0.0637].

2.3 Fuzzy comprehensive evaluation method

Let the SLS have m (m = 20) evaluation indexes to form the index set $U=\{{{u}_{1}},{{u}_{2}},\cdots,{{u}_{m}}\}$; and let p (p = 5) evaluation levels: low level, relatively low level, medium level, relatively high level and high level, constitute the appraisal set $V=\{{{v}_{1}},{{v}_{2}},\cdots,{{v}_{p}}\}$. The index membership degree model adopts the low half echelon school function, then the positive index membership function expression is:
${{u}_{i}}{{v}_{1}}({{x}^{+}})=\left\{ \begin{array}{*{35}{l}} 1, {{x}^{+}}\le {{x}_{1}} \\ \frac{{{x}_{2}}-{{x}^{+}}}{{{x}_{2}}-{{x}_{1}}}, {{x}_{1}}<{{x}^{+}}<{{x}_{2}} \\ 0, {{x}^{+}}\ge {{x}_{2}} \\\end{array} \right.$
${{u}_{i}}{{v}_{k}}({{x}^{+}})=\left\{ \begin{matrix} \frac{{{x}^{+}}-{{x}_{k-1}}}{{{x}_{k}}-{{x}_{k-1}}}, {{x}_{k-1}}<{{x}^{+}}<{{x}_{k}} \\ \frac{{{x}_{k+1}}-{{x}^{+}}}{{{x}_{k+1}}-{{x}_{k}}}, {{x}_{k}}<{{x}^{+}}<{{x}_{k+1}} \\ 0, {{x}^{+}}\ge {{x}_{k+1}}, {{x}^{+}}\le {{x}_{k-1}} \\\end{matrix} \right.$
${{u}_{i}}{{v}_{5}}({{x}^{+}})=\left\{ \begin{array}{*{35}{l}} 0, {{x}^{+}}\le {{x}_{4}} \\ \frac{{{x}_{5}}-{{x}^{+}}}{{{x}_{5}}-{{x}_{4}}}, {{x}_{4}}<{{x}^{+}}<{{x}_{5}} \\ 1, {{x}^{+}}\ge {{x}_{5}} \\\end{array} \right.$
And the negative index membership function expression is:
${{u}_{i}}{{v}_{1}}({{x}^{-}})=\left\{ \begin{array}{*{35}{l}} 1, {{x}^{-}}\ge {{x}_{1}} \\ \frac{{{x}^{-}}-{{x}_{2}}}{{{x}_{1}}-{{x}_{2}}}, {{x}_{2}}<{{x}^{-}}<{{x}_{1}} \\ 0, {{x}^{-}}\le {{x}_{2}} \\\end{array} \right.$
${{u}_{i}}{{v}_{k}}({{x}^{-}})=\left\{ \begin{matrix} \frac{{{x}^{-}}-{{x}_{k+1}}}{{{x}_{k}}-{{x}_{k+1}}}, {{x}_{k+1}}<{{x}^{-}}<{{x}_{k}} \\ \frac{{{x}_{k-1}}-{{x}^{-}}}{{{x}_{k-1}}-{{x}_{k}}}, {{x}_{k}}<{{x}^{-}}<{{x}_{k-1}} \\ 0,{{x}^{-}}\ge {{x}_{k-1}}, {{x}^{-}}\le {{x}_{k+1}} \\\end{matrix} \right.$
${{u}_{i}}{{v}_{5}}({{x}^{-}})=\left\{ \begin{array}{*{35}{l}} 1, {{x}^{-}}\le {{x}_{5}} \\ \frac{{{x}_{4}}-{{x}^{-}}}{{{x}_{4}}-{{x}_{5}}}, {{x}_{5}}<{{x}^{-}}<{{x}_{4}} \\ 0, {{x}^{-}}\ge {{x}_{4}} \\\end{array} \right.$
In the formula, x+ and x represent the actual index values of positive and negative indicators, respectively; ${{u}_{i}}{{v}_{k}}$represent the membership degrees of the kth level of the i index; and xk represent the thresholds of corresponding grades, 2≤k≤4. Therefore, the fuzzy relation matrix can be expressed as follows:
$R=\left[ \begin{matrix} {{u}_{\text{1}}}{{v}_{\text{1}}} & {{u}_{\text{1}}}{{v}_{\text{2}}} & \cdots & {{u}_{\text{1}}}{{v}_{p}} \\ {{u}_{\text{2}}}{{v}_{\text{1}}} & {{u}_{\text{2}}}{{v}_{\text{2}}} & \cdots & {{u}_{\text{2}}}{{v}_{p}} \\ \cdots & \cdots & \cdots & \cdots \\ {{u}_{m}}{{v}_{\text{1}}} & {{u}_{m}}{{v}_{\text{2}}} & \cdots & {{u}_{m}}{{v}_{p}} \\\end{matrix} \right]$
The final SLS fuzzy comprehensive evaluation result, matrix A, can be expressed as:
$\begin{align} & \ \ \ A=W\times R=\left[ \begin{matrix} {{w}_{1}} & {{w}_{2}} & \cdots & {{w}_{m}} \\\end{matrix} \right]\times \\ & \left[ \begin{matrix} {{u}_{\text{1}}}{{v}_{\text{1}}} & {{u}_{\text{1}}}{{v}_{\text{2}}} & \cdots & {{u}_{\text{1}}}{{v}_{p}} \\ {{u}_{\text{2}}}{{v}_{\text{1}}} & {{u}_{\text{2}}}{{v}_{\text{2}}} & \cdots & {{u}_{\text{2}}}{{v}_{p}} \\ \cdots & \cdots & \cdots & \cdots \\ {{u}_{m}}{{v}_{\text{1}}} & {{u}_{m}}{{v}_{\text{2}}} & \cdots & {{u}_{m}}{{v}_{p}} \\\end{matrix} \right]=[\begin{matrix} {{a}_{1}} & {{a}_{2}} & \cdots & {{a}_{p}} \\\end{matrix}] \\ \end{align}$

2.4 Spatial pattern analysis

In order to further reveal the spatial pattern and agglomeration characteristics of rural SLS in Poyang Lake Ecological Economic Zone, this study uses the Moran's I index of global spatial autocorrelation and local Getis-Ord $G_{i}^{*}$index to identify the overall spatial association and local cold-hot zones of SLS, and visualize them based on the ArcGIS platform. Among them, the formula for the spatial autocorrelation of Moran's I index is:
$I=\frac{n}{\sum\limits_{i=1}^{n}{\sum\limits_{j=1}^{n}{{{w}_{ij}}}}}\times \frac{\sum\limits_{i=1}^{n}{\sum\limits_{j=1}^{n}{[{{w}_{ij}}({{x}_{i}}-\bar{x})({{x}_{j}}-\bar{x})]}}}{\sum\limits_{i=1}^{n}{{{({{x}_{i}}-\bar{x})}^{2}}}}$
The Getis-Ord $G_{i}^{*}$index of hotspot analysis can be expressed as:
$G_{i}^{*}=\frac{\sum\limits_{j=1}^{n}{({{w}_{ij}}{{x}_{j}})}}{\sum\limits_{j=1}^{n}{{{x}_{j}}}}$
where, n is the number of evaluation units, wij is the spatial weight between evaluation units i and j, xi and xj are the SLS values of evaluation unit i and unit j respectively, and $\bar{x}$is the average value of SLS of all units. G is the significant statistic in essence. A high G value indicates similar high value spatial aggregation, namely a hot spot area, while a low G value indicates similar low value spatial aggregation, namely a cold spot zone.

2.5 Geo-detector model

Geographical detector analyzes the possible relationships between geographical variables by testing the spatial distribution consistency of the geographical variables (factor variables and outcome variables). It is often used to detect the dominant factors of the spatial differentiation of geographical elements (Wang et al., 2010; Liu and Li, 2017a). Through geographical detector, this study analyzes the impact of each index variable on the spatial differentiation of rural SLS, and determines the leading factors affecting the livelihood security in Poyang Lake Ecological Economic Zone. Based on the spatial differentiation theory and GIS spatial overlay technology, various kinds of geographical variables and outcome variables are classified according to the natural break method, and normalized under the same spatial scale. Then the power determinant value of each factor on the spatial differentiation of outcome variables is measured by q (Wang and Xu, 2017):
$q(Y/h\text{)}=1-\frac{1}{n{{\delta }^{2}}}\sum\limits_{h=1}^{L}{{{n}_{h}}\delta _{h}^{2}}$
where, q is the power determinant value of each factor variable on the outcome variable, and the value is in [0, 1]. The greater the value, the greater the influence of the geographical factor on the spatial differentiation of the outcome variable. When q=1, it indicates that the spatial differentiation of the outcome variable is determined by the geographical factor; when q=0, it indicates that the outcome variable is randomly distributed, and the geographical factor has no influence on the outcome variable. Here, Y is the outcome variable, which refers to the SLS index and h is the index classification. In this paper, the geographical factor indicators are divided into L=5 categories by the natural break method (i.e., the factor variables are divided into five categories: low, relatively low, medium, relatively high and high). n and ${{n}_{h}}$ are the number of evaluation units in the whole study area and the number of evaluation units of type h, respectively. x ${{\delta }^{2}}$.and $\delta _{h}^{2}$are the global discrete variance of the outcome variable and the discrete variance of the h th type, respectively.

2.6 Obstacle degree model

In order to explore the obstacle factors restricting the SLS in rural areas, this study introduces the obstacle degree model to makes a pathological diagnosis on the factors hindering SLS. The main indexes involved are “deviation degree” index and “obstacle degree” index, and their expressions are as follows:
${{s}_{i}}=1-{{{x}'}_{i}}$
${{y}_{i}}={{w}_{i}}{{s}_{i}}/\sum\limits_{i=1}^{m}{({{w}_{i}}{{s}_{i}})}$
where, ${{s}_{i}}$ represents the deviation degree of the i-th index, that is, the gap between the actual value and the target value of the index; ${{{x}'}_{i}}$ represents the standardized value of the i-th index; ${{y}_{i}}$ refers to the obstacle degree index; ${{w}_{i}}$ refers to the weight of the i-th index, and m refers to the number of evaluation indicators.
On the basis of analyzing the restriction level of each individual index evaluation factor, the barrier degree of each criterion layer and sub-goal to SLS is further determined, and their expressions are as follows:
${{Y}_{j}}\text{=}\sum\limits_{i=1}^{m}{{{y}_{ij}}}$
where, ${{Y}_{j}}$represents the barrier degree of the jth criterion layer or sub-goal layer; and ${{y}_{ij}}$ refers to the barrier degree of the ith indicator of jth criterion layer or sub-goal layer.

3 Study area: The Poyang Lake Ecological Economic Zone

Poyang Lake is located in the south bank of the middle and lower reaches of the Yangtze River and the north of Jiangxi Province. Its geographic coordinates are 115°49′-116°46′E, 28°24′-29°46′N, with a vast area of 3150 km2. It is the largest crossing river lake in the Yangtze River Basin and the largest freshwater lake in inland China. In December 2009, the Chinese State Council approved “the development plan for Poyang Lake Ecological Economic Zone”. With Poyang Lake as the core and Poyang Lake urban circle as the support, 38 counties (or districts) from nine cities, such as Nanchang, Jiujiang, Shangrao, Yichun, Yingtan, Xinyu, Jingdezhen, Fuzhou and Ji'an, are included in the scope of special economic zones, with the aim of building a world-wide ecological economy demonstration zone and a low-carbon economy pioneer zone. The total area of Poyang Lake Ecological Economic Zone is 51200 km2, which accounts for 30.67% of the total land area of Jiangxi Province. The zone carries a population of 37.88 million people (about 40% of the total population of Jiangxi Province), including a rural population of more than 24 million and a fishery population of more than 1.02 million (according to the data of Jiangxi Municipal Statistic Bureau in 2017). It is worth noting that the fishery households and fishermen involved in the Fishing Ban account for 39.7% and 41.9% of the whole Yangtze River Basin, respectively (as reported by the Fishery Bureau of Jiangxi Agriculture and Rural Affairs Department in 2017).
As the object of this study is rural sustainable livelihood security, some urban areas do not involve a rural population and lack the relevant data. Therefore, the study area mainly includes 34 of the 38 counties (districts), and excludes Xihu District and Qingyunpu District of Nanchang City, Xunyang District of Jiujiang City, and Zhushan District of Jingdezhen City. Due to the recent statistical data not being updated and published in time, all the data cited in this study are the yearly data of 2017, mainly including “social and economic statistical yearbook”, “land use and land cover data”, and “eco-environmental monitoring and protection information”, respectively from Jiangxi Provincial Statistical Bureau, Jiangxi Provincial Department of Natural Resources, and Jiangxi Provincial Department of Ecological Environment. The multiple index data can be obtained through direct queries or indirect calculations in these three categories of data.

4 Results

4.1 SLS evaluation

Using the Natural Break method, the indicators are divided into five levels: low level I, relatively low level II, medium level III, relatively high level IV and high level V. According to the comprehensive fuzzy calculation of index grading and corresponding weights, the evaluation results of rural SLS in Poyang Lake Ecological Economic Zone are shown in Fig. 2 and Fig. 3. Among the 34 counties (districts), 2 counties (Changjiang District and Fujiang County) have rural livelihood levels that are highly secure, accounting for 5.89%; 9 counties are relatively safe, accounting for 26.47%; 7 counties are moderately safe, accounting for 20.59%; 12 counties are relatively low safe, accounting for 35.29%; and 4 of them (Zhangshu City, Xingan County, Guixi City and Wannian County) have low safety, accounting for 11.76%. These data show that the overall SLS in Poyang Lake Ecological Economic Zone is low, so there is still room for improvement.
Fig. 2 Spatial pattern of rural SLS in Poyang Lake Eco-economic Zone
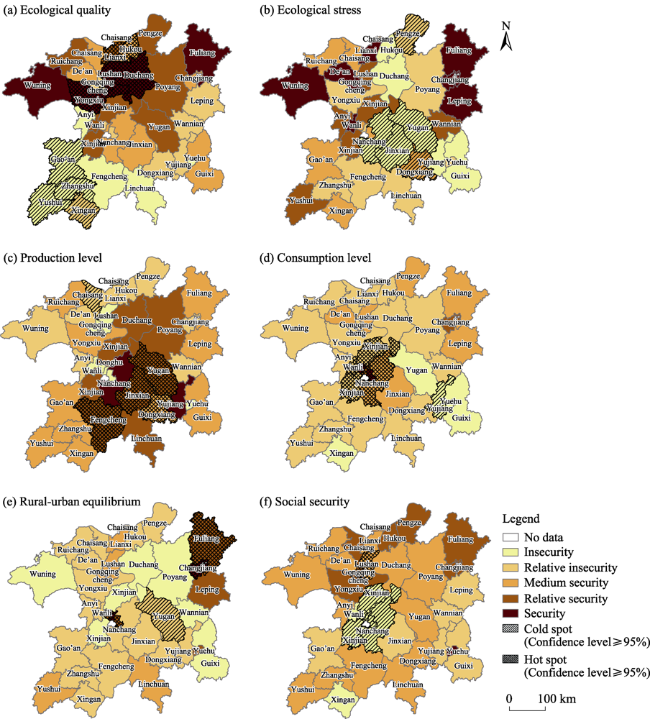
Fig. 3 Spatial pattern of rural SLS factors
For the sub-goal layer the distribution of counties in terms of ecological security was: high (5 counties, 14.71%), relatively high (5, 14.71%), medium (6, 17.65%), relatively low (11, 32.35%) and low (7, 20.59%). The distribution of counties in terms of economic efficiency was: high (2 counties, 5.88%), relatively high (8, 23.53%), medium (11, 32.35%), relatively low (8, 23.53%) and low (5, 14.71%). The distribution of counties in terms of social equity was: high (4 counties, 11.76%), relatively high (7, 20.59%), medium (9, 26.47%), relatively low (9, 26.47%) and low (5, 14.71%). Therefore, the rural EEI and SEI of Poyang Lake Ecological Economic Zone are in the middle level overall, but the ESI is generally low.
For the criterion layer the distribution of counties in terms of ecological quality was: high (5 counties, 14.71%), relatively high (7, 20.59%), medium (8, 23.53%), relatively low (7, 20.59%) and low (7, 20.59%). The distribution of counties in terms of ecological pressure was: high (8 counties, 23.53%), relatively high (5, 14.71%), medium (6, 17.65%), relatively low (8, 23.53%) and low (7, 20.59%). The distribution of counties in terms of production level was: high (2 counties, 5.88%), relatively high (7, 20.59%), medium (10, 29.41%), relatively low (9, 26.47%) and low (6, 17.65%). The distribution of counties in terms of consumption level was: high (1 counties, 2.94%), relatively high (2, 5.88%), medium (7, 20.59%), relatively low (19, 55.88%) and low (5, 17.41%). The distribution of counties in terms of rural-urban equilibrium was: high (2 counties, 5.88%), relatively high (4, 11.76%), medium (5, 14.71%), relatively low (17, 50.00%) and low (6, 17.65%). The distribution of counties in terms of social security was: High (1 counties, 2.94%), relatively high (7, 20.59%), medium (14, 41.18%), relatively low (6, 17.65%) and low (6, 17.65%). It can be seen that the safety levels of the eight criteria layers are mostly middle or slightly low, while the consumption level and the rural-urban equilibrium in particular are very low, so they urgently need to be improved and optimized.

4.2 Spatial pattern of SLS

Through spatial autocorrelation analysis, the Moran's I index values of SLS and the related sub-indexes were calculated. The results are shown in Table 3. Except for the production level and SEI, the spatial Moran's I value of each index is positive, and they are significant at the 95% confidence level. These results also reflect that the rural SLS index and the sub target layer and criterion layer index of Poyang Lake Ecological Economic Zone are spatially auto-correlated positively, and the spatial aggregation features are quite significant.
Table 3 The Global Moran's I index values of rural SLS
Moran's I index and statistics SLS Ecological security Economic efficiency Social equality
Ecological quality Ecological stress ESI Production
level
Consumption
level
EEI Rural-urban
equilibrium
Social
security
SEI
Moran's I 0.3940 0.3625 0.2318 0.4446 0.0847 0.3279 0.3494 0.2231 0.1998 0.0043
Z-score 3.9373 3.5021 2.3224 4.2427 1.0365 4.4427 3.4726 2.4776 2.0752 0.3195
P-value 0.0001 0.0005 0.0202 0 0.3000 0 0.0005 0.0132 0.0380 0.7493
Through hot spot analysis (Getis-Ord $G_{i}^{*}$), we find that the spatial distribution of SLS has a tendency of being higher in the north and lower in the south (see Fig. 2 and Fig. 3). The hot zones are centralized in Changjiang District, Fuliang County, Poyang County and Leping City in the northeast of Poyang Lake; while the cold zones are centralized in Fengcheng City, Zhangshu City, Yushui District, Xingan County which are in the southwest, and Yujiang County and Guixi City which are in the southeast. The spatial distribution of ESI has a more obvious tendency of being higher in the north and lower in the south. The hot zones are mainly centralized in Wuning County, Yongxiu County and Duchang County in the northwest of Poyang Lake, while the cold areas are centralized in Nanchang County, Jinxian County, Fengcheng City, Dongxiang County, Linchuan District and Zhangshu City in the southern Poyang Lake. The ESI hot zone mainly benefits from higher forest coverage and ecological red line protection area, while the cold zone is limited by low forest coverage, ecological red line protection area or wide fishery culture area and large fishery population. The EEI is in a circular distribution, in which it is distributed around the Nanchang metropolitan area from high to low. The hot zones are concentrated in Nanchang County, Jinxian County, Xinjian District, Donghu District, Fengcheng City and Yugan County, while the cold zones are centralized in Lushan city and Chaisang District. The difference of EEI between cold and hot zones mainly stems from economic location, paticularly as it is manifested in the regional differences of agricultural machinery gross power and rural per capita electricity consumption. The SEI distribution is just contrary to EEI. It is in a circular distribution, in which it is distributed around the Nanchang metropolitan area from low to high. The peripheral area of Nanchang city is relatively low, while the surrounding areas such as Lushan City, Chaisang District, Hukou County, Linchuan District, Fuliang County and Changjiang District are higher. The hottest zones are centralized in Fuliang County and Changjiang District, while the coldest area is in Yugan County. The indicator values show that the cold and hot areas of SEI are quite different in urbanization rates, rural-urban income disparities and rural population dependency ratios.
The ecological quality is better in northern mountainous regions (like Lushan City and Yongxiu County) and counties around the Poyang Lake (such as Duchang County, Hukou County and Lianxi District) which are characterized by higher forest coverage, and larger water area and ecological red line area. However, the ecological quality is relatively poor in the southern area of Ganfu Plain, including Zhangshu City, Gao'an City, Yushui District and Xingan County. The areas with high ecological pressure are mainly concentrated in suburban areas with high populations, such as Nanchang County, Jinxian County, Yugan County, or areas with large fishery populations and wide culture areas, like Dongxiang County and Pengze County. The production level and consumption level are both circularly distributed around the Nanchang metropolitan area from high to low. The hot zone of the production level is concentrated in Fengcheng, Jinxian, Yugan and Dongxiang counties around Nanchang city, while the cold zone is in Chaisang District. The hot zone of the consumption level is mainly concentrated in related districts of Nanchang City, while Yujiang County is the significant cold area. Most counties in the Poyang Lake Ecological Economic Zone are relatively low in the rural consumption aspect. The development gap between urban and rural areas appears to be large, with a low rural-urban equilibrium index. Only Donghu District, Fuliang County and Changjiang District have developed mutually between their rural and urban areas. As to social security, there exists an unexpected phenomenon that Nanchang metropolitan area, as the cold zone, is significantly lower than the surrounding areas. This is because urbanization has caused the rural population to migrate to the suburban areas of Nanchang, which has brought about high population density and reduced the average access to social security, such as educational resources and medical care.

4.3 Geographic detector analysis

In order to further verify the dominant factors affecting SLS spatial differentiation, this study calculates the power determinant value of each index on SLS through the geographic detector model. As shown in Fig. 4, rural per capita electricity consumption (0.50), fishery breeding area (0.46), rural population dependency ratio (0.44), urbanization rate (0.41), fishery population (0.35), population-farmland ratio (0.29), and rural-urban income disparity (0.26) are the top seven factors influencing rural SLS.
Fig. 4 Power determinant value and ranking of SLS indicators
Rural per capita electricity consumption is a key indicator reflecting farmers' consumption level and rural economic efficiency, and it plays a decisive role in SLS spatial differentiation. As shown in Fig. 5a, the spatial distribution of rural per capita electricity consumption is highly consistent with SLS, as it also shows the distribution of high in the north and low in the south. The values of rural per capita electricity consumption are higher in Fuliang County, Changjiang District, Poyang County, Leping City, Duchang County, Pengze County, Lushan City and Jing'an County, while lower in Xingan County, Guixi City, Yugan County, Dongxiang County and Linchuan District. The significant hot zone of rural per capita power consumption is concentrated in Qingshanhu District, Nanchang County and Wanli District due to their developed economic and infrastructure conditions.
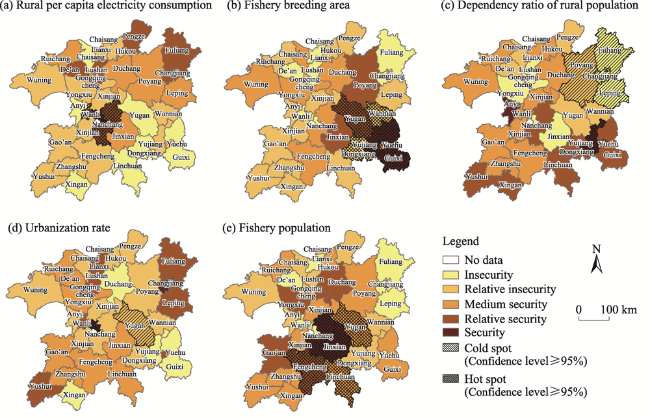
Fig. 5 Dominant factors of rural SLS in Poyang Lake Ecological Economic Zone
Fishery breeding area and fishery population also play important roles in shaping the spatial pattern of SLS, with q values of 0.46 and 0.35, respectively. This is due to the fact that fishery activities, such as overfishing and enclosure breeding, have resulted in serious water pollution and great pressure on the fish ecosystem in Poyang Lake. As fishery breeding area and fishery population are both negative indexes, their spatial patterns are opposite to that of SLS. It can be seen from Fig. 5b and Fig. 5e that the cold zone of SLS just corresponds to the hot zones of fishery breeding area and fishery population.
As a negative index, the rural population dependency ratio has a decisiveness of 0.44 to SLS. The population dependency ratio reflects the pressure of the aging population and supporting offspring, and a higher dependency ratio often requires more investments in social security. It can be seen from Fig. 5c that the high and low value areas of rural population dependency ratio correspond to the low and high value areas of SLS.
The spatial pattern of urbanization rate is quite similar to that of SLS (Fig. 5d), nearly sharing the same districts of high and low values. While the spatial patterns of population-farmland ratio and rural-urban income disparity are opposite to that of SLS, this phenomenon fully proves that non-agricultural transition and urbanization are effective ways to reduce the rural-urban gap and improve rural SLS. It is also noteworthy that in the developed and urbanized areas, such as Yuehu, Wanli, Qingshanhu and Donghu, the values of SLS are quite higher despite the high population-farmland ratio and rural-urban income disparity. This is because the farmers in these districts are more fully employed in non-agricultural sectors and rely much less on farmland. Although the rural-urban income disparity is greater, farmers in these urban areas tend to have relatively abundant income and higher SLS compared with farmers in other areas.

4.4 Obstacle factor analysis

Through the analysis by the obstacle degree model, the obstacle degree is calculated for each subsystem, criterion and indicator of SLS. As shown in Table 4, from the indicator level, the top seven obstacles (and their mean obstacle degree values) are: rural per capita electricity consumption (0.16), number of beds per thousand people in hospitals (0.11), urbanization rate (0.10), the total power of agricultural machinery (0.09), the total output value of farming, forestry, animal husbandry and fishery (0.09), the area ratio of ecological protection red line (0.07), and the rural-urban income disparity (0.06). Among the total of 34 districts, more than 30 districts have values of these above seven indicators which are all greater than 0.03. This means that these seven indicators are the main limitations restricting rural SLS, and have become the common problems in Poyang Lake Ecological Economic Zone.
Table 4 Obstacle degree of SLS and its ranking
Sub-goal layer Criterion layer Indicator layer The frequency of
obstacles≥ 3%
Mean value of
obstacle degree
Ranking of
obstacle degree
Ecological Security Index (0.23) Ecological quality
(0.16)
1. Forest coverage 22 0.03 13
2. Water area ratio 25 0.05 9
3. Surface water environmental quality 0 0.01 18
4. Ecological protection red line area ratio 30 0.07 6
Ecological stress (0.08) 5. Population-farmland ratio 5 0.02 15
6. Chemical fertilizer application intensity 28 0.04 11
7. Fishery population 3 0.01 17
8. Fishery breeding area 4 0.01 20
Economic Efficiency Index (0.41) Production level
(0.20)
9. Total output value of farming, forestry, animal husbandry and fishery 33 0.09 5
10. Total power of agricultural machinery 33 0.09 4
11. Multiple Cropping Index 4 0.02 14
Consumption level (0.21) 12. Farmers' per capita disposable income 32 0.04 10
13. Rural per capita electricity consumption 33 0.16 1
14. Farmers' per capita living consumption expenditure 3 0.01 19
Social Equality Index (0.36) Rural-urban
equilibrium (0.18)
15. Rural-urban income disparity 32 0.06 7
16. Urbanization rate 32 0.10 3
17. Proportion of rural migrant laborer 26 0.03 12
Social security
(0.18)
18. Rural population dependency ratio 3 0.01 16
19. Number of beds per thousand people in hospitals/public health centers 33 0.11 2
20. Faculty-student ratio of basic education 29 0.06 8

Note: (*) indicates that the values in the brackets are the obstacle degree accordingly.

From the perspective of the criterion level, the obstacle degrees of SLS criteria are successively 0.21 (consumption level), 0.20 (production level), 0.18 (rural-urban equilibrium), 0.18 (social security degree), 0.16 (ecological quality) and 0.08 (ecological pressure). From the sub-goal level, the obstacle degree of SLS in Poyang Lake eco-economic zone is mainly reflected in economic efficiency (0.41), social equity (0.36), and ecological security (0.23).
Therefore, in the Poyang Lake Eco-Economic Zone, countermeasures should focus firstly on activating rural economic efficiency, especially increasing the investment in infrastructure such as rural power, popularizing rural mechanization, and increasing the total output value of farming, forestry, animal husbandry and fishery. Secondly, we should pay attention to rural social security such as medical care and education, accelerate urbanization and non-agricultural transition of farmers, and narrow the income gap between urban and rural residents. In addition, the implementation of the ecological protection red line is of great significance for improving the regional ecological security and ensuring the safety of rural sustainable livelihoods.

5 Discussion

5.1 The LSA framework

Through the case study, the LSA framework is shown to be effective, so it can not only provide efficient methods and adaptive indicators, but also guide the research procedures, and help with problem analysis. This study proposes five strengths of the LSA framework. 1) The LSA framework has constructed a four-layer indicator system which will be comprehensive and flexible for assessing SLS in the case analysis. It innovates the SLS index by incorporating three sub-goal indexes (i.e., ecological security, economic efficiency and social equity), eight criterion-level indexes (i.e., ecological quality, ecological stress, production level, consumption level, rural-urban equilibrium and social security), and 20 new indicators. With the structure of a fixed sub-goal layer and criterion layer, and a flexible indicator layer, this semi-fixed indicator system turns out to be efficient and easy to operationalize. 2) The LSA framework provides efficient and applicable methods for analyzing, visualizing, and interpreting the results. The AHP-Entropy combined weighting method is more objective and accurate than each individual method, and the fuzzy comprehensive evaluation method is widely accepted for its simplicity and efficiency in index evaluation. The spatial auto-correlation model based on a GIS platform helps to visualize the spatial patterns of rural SLS and the local Getis-Ord $G_{i}^{*}$index identifies both the hot spots and the cold spots. 3) This framework has the benefits of identifying key factors, main constraints, and specific pathways for building livelihood security. The geographic detector model is employed to detect the dominant factors driving the spatial differentiation of SLS, while the obstacle degree model is constructed for clarifying the main obstacles of SLS. Thus, we can determine corresponding measures to improve livelihood security. 4) This framework focuses on the district level, which is in favour of macro-control and regional balance in rural SLS. 5) Lastly, the LSA framework is scientifically designed and tightly connected with the National Rural Revitalization and the Fishing Ban, which make it usable and reasonable in the implementation of the current policy programme. The indicators in this study have been selected carefully to embody the content of the National Rural Revitalization and Fishing Ban, and have to be adapted to the specific situation of the Poyang Lake Eco-economic Zone. As a result, the information on rural recession is mainly reflected by the economic efficiency and social equality indicators, such as the multiple cropping index, the rural per capita electricity consumption, the rural-urban income disparity, the rural population dependency ratio, etc., while the Fishing Ban content is mainly contained in the ecological security indicators, such as the fishery population, the fishery breeding area, the ecological protection red line area ratio, etc. Overall, the LSA framework has the potential to help the government identify specific interventions to improve livelihood security and rural sustainability. This framework can be also applied in other similar areas by the merit of its simplicity and flexibility.
Although using the LSA framework helps the in-depth analysis of livelihood security, there are also some drawbacks and critiques of this framework. First, the LSA framework is mainly applicable at the district level and useful for macro analysis on a community scale, county scale and even larger scales. However, it cannot identify the livelihood characteristics of individual farmers, and it may be difficult to incorporate household-scale factors into the security measurement. Second, it only provides a “snapshot” of livelihood security, and not necessarily a dynamic measure of how livelihood security is changing. If the goal was to look at how livelihood security has changed over time, a dataset focused on the indicators of security at two different points in time would be needed.

5.2 Policy implications

Under the background of the National Rural Revitalization and Fishing Ban in the Yangtze River Basin of China, rural SLS analysis can provide a valuable perspective for the realization of the goal of rural revitalization and environmental protection of Yangtze River. The SLS in rural areas requires the coordination of the three dimensions of ecological security, economic efficiency and social equity, which are different in approach but equally important for achieving the five dimensions of rural revitalization: “Industrial prosperity, livable ecology, rural civilization, effective governance, and affluent life” (Liao and Chen, 2017; Ma et al., 2018). The smooth implementation of the Fishing Ban project also requires the premise of guaranteeing the sustainable livelihood security in rural areas and compatible incentives for fishermen (Pang and Jin, 2020). The case study of Poyang Lake eco-economic zone shows that rural per capita electricity consumption, urbanization rate and rural-urban income disparity respectively embody rural economic efficiency and social equity and are all in the top seven indicators in terms of power of determinant and obstacle degree. They are not only the dominant factors affecting the spatial differentiation of rural SLS, but also the main obstacles restricting the construction of rural SLS. This implies that National Rural Revitalization and Fishing Ban should focus on the rural-urban integration rather than merely on rural areas (Wang, 2016; Liu, 2018), and pay more attention to improving rural sustainable livelihood security and promoting regional balanced development (Tian et al., 2016a, 2016b; Liu and Liu, 2016; Wang, 2018).
Specifically, local governments should take actions from three aspects. 1) In the ecological subsystem, the government should make a reasonable and equilibrated adjustments for the ecological red line area to avoid a red line ratio that is too high or too low, and it especially needs to highlight the joint efforts with national nature reserves and national forest parks (Kong et al., 2013). At the same time, abiding by the Fishing Ban makes it necessary to take various measures to guide the transformation of fishermen's livelihoods, gradually reduce or even eliminate overfishing and aquaculture in lakes, and restrict the area of fishery breeding. More attention should be paid to those areas with large fishery populations and breeding areas, such as Nanchang, Jinxian, and Yujiang. 2) In the economic subsystem, it is urgent to activate the rural economy by reinforcing rural power infrastructure, promoting agricultural mechanization, and increasing the total output value of farming, forestry, animal husbandry and fishery. Specifically, agricultural mechanization services in most of Jiujiang City, including Chaisang, Lianxi, Xunyang, Hukou, Lushan, and Gongqingcheng City, DeAn County, cannot meet the needs of the large-scale agriculture development. Rural power infrastructure in Linchuan, Dongxiang, Yugan, Chaisang, Guixi and Xingan has also lagged behind and should be reinforced immediately. 3) In the social subsystem, the aging problem is prominent and social security in rural areas, such as medical treatment and pensions, needs to be improved. Meanwhile, the policy on urbanization should be adjusted and strengthened to accelerate farmers' non-agricultural transition and narrow the rural-urban income gap. The areas with the lowest SEI value, such as Xinjian, Wanli, Nanchang, Guixi and Xingan, have become key areas of social governance.

6 Conclusions

An empirical study shows that rural SLS in the inland great lake area tends to be vulnerable mainly due to the lagging economic efficiency and unbalanced social equality, and is mediated by regional ecological characteristics. SLS in the Poyang Lake Ecological Economic Zone was generally low and unevenly distributed. Only 52.95% of counties' SLS and 47.06% of counties' ESI were above the medium level, and most of the well-performing counties were concentrated in the ecologically advantageous areas in the north of Poyang Lake. EEI and SEI are roughly at the medium level, and the counties with levels above medium security in EEI and SEI account for 61.76% and 58.82%, respectively. The spatial patterns of EEI and SEI are greatly influenced by the economic location and urbanization, which have formed an inside-to-outside structure of a circular layer around the capital city Nanchang. In the ecological system, fishery breeding area, fishery population, and rural population dependency ratio are the main sources of ecological pressure and have shaped the spatial patterns of ESI and SLS. In the economic system, the low rural per capita electricity consumption is the main cause for the low consumption level. In the social system, rural population dependency ratio, urbanization rate, and rural-urban income disparity are the dominant factors affecting rural-urban equilibrium and social security.
Therefore, local governments should take actions from three aspects to improve rural livelihood security. 1) In the ecological subsystem, governments should make a reasonable and equilibrated adjustment for the ecological red line area based on national nature reserves and forest parks. Meanwhile, in abiding by the Fishing Ban, necessary measures should be taken to accelerate the transformation of fishermen's livelihoods, gradually reduce or even eliminate overfishing and aquaculture in lakes, and restrict the area of fishery breeding. 2) In the economic subsystem, it is urgent to activate the rural economy by reinforcing the rural power infrastructure and promoting agricultural mechanization. 3) In the social subsystem, medical treatment and pensions for the aged population need to be improved. Meanwhile, urbanization should be accelerated to promote farmers' non-agricultural transition and narrow the rural-urban income gap.
The framework proposed in this study can be applicable to other similar areas by the merit of its simplicity and flexibility. The research findings may be helpful for the implementation of the National Rural Revitalization and Fishing Ban Project in China, and also provide reference for future SLS research and rural sustainability management in similar areas worldwide.
[1]
Aminbakhsh S, Gunduz M, Sonmez R. 2013. Safety risk assessment using analytic hierarchy process (AHP) during planning and budgeting of construction projects. Journal of Safety Research, 46: 99-105.

DOI PMID

[2]
Bhandari B S, Grant M. 2007. Analysis of livelihood security: A case study in the Kali-Khola watershed of Nepal. Journal of Environmental Management, 85(1): 17-26.

PMID

[3]
Biggs E M, Bruce E, Boruff B, et al. 2015. Sustainable development and the water-energy-food nexus: A perspective on livelihoods. Environmental Science & Policy, 54: 389-397.

[4]
Chambers R, Conway G, 1992. Sustainable rural livelihoods: Practical concepts for the 21st century. IDS Discussion Paper No. 296. Brighton, UK: Institute of Development Studies.

[5]
Chu J Y, Wang J H, Wang C. 2015. A structure-efficiency based performance evaluation of the urban water cycle in Northern China and its policy implications. Resources, Conservation and Recycling, 104: 1-11.

[6]
Clover J, Eriksen S. 2009. The effects of land tenure change on sustainability: Human security and environmental change in southern African savannas. Environmental Science & Policy, 12(1): 53-70.

[7]
Cobbinah P B, Gaisie E, Owusu-Amponsah L. 2015. Peri-urban morphology and indigenous livelihoods in Ghana. Habitat International, 50: 120-129.

DOI

[8]
Cui Y, Feng P, Jin J L, et al. 2018. Water resources carrying capacity evaluation and diagnosis based on set pair analysis and improved the entropy weight method. Entropy, 20(5): 1-20.

DOI

[9]
DFID (Department for International Development of UK). 2000. Sustainable livelihoods guidance sheets. London, UK: DFID.

[10]
Dong X B, Dai G S, Ulgiati S, et al. 2015. On the relationship between economic development, environmental integrity and well-being: The point of view of herdsmen in Northern China grassland. Plos One, 10(9): e0134786. DOI: 10.1371/journal.pone.0134786.

DOI

[11]
Du B X, Xu L G, Zhang J. 2018. The spatial-temporal characteristics of eutrophication in Poyang Lake and its relationship with the water level. Research of Environmental Sciences, 32(5): 795-801. (in Chinese)

[12]
Gecho Y, Ayele G, Lemma T, et al. 2014. Livelihood strategies and food security of rural households in Wolaita Zone, Southern Ethiopia. Social Sciences, 3(3): 92-104.

DOI

[13]
Hilson G. 2010. “Once a miner, always a miner”: Poverty and livelihood diversification in Akwatia, Ghana. Journal of Rural Studies, 26(3): 296-307.

DOI

[14]
Hu Q Q. 2019. Research on the development issues and countermeasures of the ecological economic zone around the Poyang Lake. Modern Business, 522(5): 90-91. (in Chinese)

[15]
Huang J G, Guo Z Y. 2007. The wetland biodiversity and its conservation countermeasures in the Poyang Lake. Research of Soil and Water Conservation, 14(1): 305-306. (in Chinese)

[16]
Kong S, Zeng D, Yang Y B, et al. 2013. Spatial differences comparison between national nature reserves and national forest park. Journal of Northeast Agricultural University, 44(11): 56-61. (in Chinese)

[17]
Liao C R, Chen M Q. 2017. The theoretical logic, scientific connotation and achieving methods of rural revitalization strategy. Journal of Agro-Forestry Economics and Management, 16(6): 102-109. (in Chinese)

[18]
Lindenberg M. 2002. Measuring household livelihood security at the family and community level in the developing world. World Development, 30(2): 301-318.

DOI

[19]
Liu J T, Deng Y Q, Wang F L, et al. 2018. Practices and suggestions for ecological environment protection in the Poyang Lake Water. China Water Conservancy, (17): 6-8. (in Chinese)

[20]
Liu J Y. 2014. Ageing, migration and familial support in rural China. Geoforum, 51(51): 305-312.

DOI

[21]
Liu Y S. 2018. Research on the rural-urban integration and rural revitalization in the new era in China. Acta Geographica Sinica, 73(4): 637-650. (in Chinese)

[22]
Liu Y S, Cao Z. 2017. Supply-side structural reform and its strategy for targeted poverty alleviation in China. Bulletin of the Chinese Academy of Sciences, 32(10): 1066-1073. (in Chinese)

[23]
Liu Y S, Li J T. 2017a. Geographic detection and optimizing decision of the differentiation mechanism of rural poverty in China. Acta Geographica Sinica, 72(1): 161-173. (in Chinese)

[24]
Liu Y S, Li Y H. 2017b. Revitalize the world's countryside. Nature, 548(7667): 275-277.

DOI

[25]
Liu Z X, Liu L M. 2016. Characteristics and driving factors of rural livelihood transition in the east coastal region of China: A case study of suburban Shanghai. Journal of Rural Studies, 43: 145-158.

DOI

[26]
McCracken J A, Pretty J N. 1988. Glossary of selected terms in sustainable agriculture. London, UK: International Institute of Environment and Development.

[27]
Pang J, Jin L S. 2020. Compensation rate for fishing withdrawal from Poyang Lake based on fishermens willingness to accept. China Population, Resources and Environment, 30(7): 169-176. (in Chinese)

[28]
Quandt A. 2018. Measuring livelihood resilience: The household livelihood resilience approach (HLRA). World Development, 107: 253-263.

DOI

[29]
Saleth R M, Swaminathan M S. 1993. Sustainable livelihood security index:Towards a welfare concept and robust indicator for sustainability. In: Moser F (ed.). Proceeding international workshop on evaluation criteria for a sustainable economy, 1993 April 6-7, Graz/A, Austria.

[30]
Sherbinin A D, VanWey L K, McSweeney K, et al. 2008. Rural household demographics, livelihoods and the environment. Global Environmental Change, 18(1): 38-53.

DOI

[31]
Singh P K, Hiremath B N. 2010. Sustainable livelihood security index in a developing country: A tool for development planning. Ecological Indicators, 10(2): 442-451.

DOI

[32]
Stefanidis S, Stathis D. 2013. Assessment of flood hazard based on natural and anthropogenic factors using analytic hierarchy process (AHP). Natural Hazards, 68(2): 569-585.

DOI

[33]
Sun C Z, Zhen L, Wang C, et al. 2015. Biodiversity smiluation of Poyang Lake wetlands by Invest model under different scenarios. Resource and Environment in the Yangtze Basin, 24(7): 1119-1125. (in Chinese)

[34]
Swaminathan M S. 1991. Greening of the mind. Indian Journal of Social Work, 52(3): 401-407.

[35]
Tang Q, Bennett S J, Xu Y, et al. 2013. Agricultural practices and sustainable livelihoods: Rural transformation within the Loess Plateau, China. Applied Geography, 41: 15-23.

DOI

[36]
Tian Q, Guo L Y, Zheng L. 2016a. Urbanization and rural livelihoods: A case study from Jiangxi Province, China. Journal of Rural Studies, 47: 577-587.

DOI

[37]
Tian Q, Holland J H, Brown D G. 2016b. Social and economic impacts of subsidy policies on rural development in the Poyang Lake Region, China: Insights from an agent-based model. Agricultural Systems, 148: 12-27.

DOI

[38]
Turner B L, Kasperson R E, Matson P A, et al. 2003. A framework for vulnerability analysis in sustainability science. Proceedings of the National Academy of Sciences of the USA, 100(14): 8074-8079.

DOI

[39]
Uma G. 1993. Sustainable livelihood security of villages surrounding the Pichavaram mangrove forest, India. Indian Geography, 68: 33-47.

[40]
UNDP (United Nations Development Programme). 1990. Human development report 1990:Concept and measurement of human development. New York, USA: UNDP.

[41]
Wang C C, Zhang Y Q, Yang Y S, et al. 2016. Assessment of sustainable livelihoods of different farmers in hilly red soil erosion areas of Southern China. Ecological Indicators, 64(5): 123-131.

DOI

[42]
Wang C G. 2016. Beyond the countryside and city:Integrated allocation of resources and opportunities. Beijing, China. Social Sciences Academic Press. (in Chinese)

[43]
Wang F, Ye C S. 2018. Coupling relationship between rural transformation and land use change in ecological economic zone of Poyang Lake. Research of Soil and Water Conservation, 25(6): 288-295. (in Chinese)

[44]
Wang J F, Li X H, Christakos G, et al. 2010. Geographical detectors-based health risk assessment and its application in the neural tube defects study of the Heshun region, China. International Journal of Geographical Information Science, 24(1): 107-127.

DOI

[45]
Wang J F, Xu C D. 2017. Geodetector: Principle and prospective. Acta Geographica Sinica, 72(1): 116-134. (in Chinese)

[46]
Wang S Y. 2018. Countermeasures to protect the ecological environment of the Poyang Lake. Resource Conservation and Environmental Protection, (10): 12. (in Chinese)

[47]
Wang X H. 2004. Ecosystem assessment of the Poyang Lake Wetland. Beijing, China: Science Press. (in Chinese)

[48]
Xie H L, Wu Q. 2020. Farmers' willingness to leave land fallow from the perspective of heterogeneity: A case study in ecologically vulnerable areas of Guizhou, China. Land Degradation & Development, 31(14): 1749-1760.

DOI

[49]
You H Y, Zhang X L. 2017. Sustainable livelihoods and rural sustainability in China: Ecologically secure, economically efficient or socially equitable? Resources, Conservation and Recycling, 120: 1-13.

[50]
Zhao H, Liu P H. 2019. Analysis of spatio-temporal pattern characteristics and driving factors of land urbanization in Poyang Lake Ecological Economic Zone. Acta Agriculturae Jiangxi, 31(1): 102-109. (in Chinese)

[51]
Zhao Q G, Huang G Q, Qian H Y. 2007. Ecological environment and sustainable development of Poyang Lake. Acta Pedologica Sinica, 44(2): 318-326. (in Chinese)

[52]
Zhou H H, Chen X H. 2018. Spatio-temporal evolution of sustainable livelihood security and study of its obstacle indicators in Northeast China. Scientia Geographica Sinica, 38(11): 1864-1874. (in Chinese)

Outlines

/