
Journal of Resources and Ecology >
Life Cycle Assessment of Biodegradable Polylactic Acid (PLA) Plastic Packaging Products—Taking Tianjin, China as a Case Study
|
ZHAO Menglei, E-mail: dreamleir@163.com |
Received date: 2020-11-12
Accepted date: 2021-10-20
Online published: 2022-04-18
Supported by
Tianjin Municipal Science and Technology Bureau(17JCYBJC42400)
Tianjin Municipal Education Commission(2017KJ020)
Tianjin Key Laboratory of Integrated Design and On-line Monitoring for Light Industry & Food Machinery and Equipment 2019(LIMFE08)
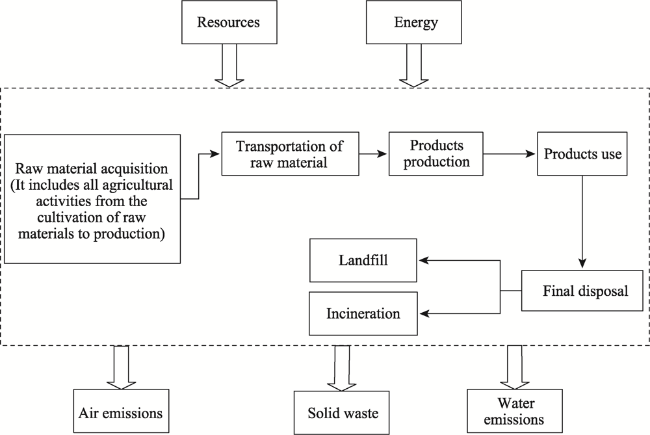
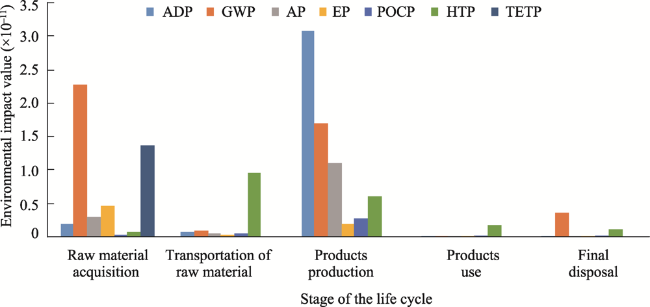
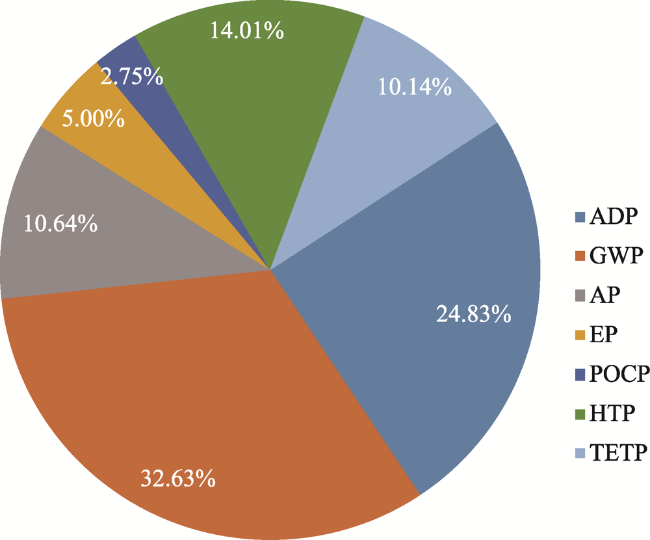
In this paper, the life cycle assessment (LCA) method is used to evaluate and quantify the energy consumption and environmental impacts of biodegradable polylactic acid (PLA) plastic packaging from the five stages of raw material acquisition, raw material transportation, product production, products use and final disposal. Seven impact categories were selected for the impact analysis: abiotic depletion potential fossil fuels (ADP), global warming potential (GWP), acidification potential (AP), eutrophication potential (EP), photochemical ozone formation potential (POCP), human toxicity potential (HTP), and terrestrial ecotoxicity potential (TETP). The results of the LCA are discussed and the results show that production of products is the highest stage of the environmental impact. Meanwhile, in the entire life cycle, the top three environmental impact categories are GWP, ADP and HTP, which account for 32.63%, 24.83% and 14.01%, respectively. The LCA results show that the environmental impact can be reduced in several ways: reducing the consumption of electricity, increasing the input of new energy, increasing the conversion rate of materials in the production process, using organic and water-soluble fertilizers instead of conventional fertilizers, using environment-friendly fuels and establishing a sound recycling system.
ZHAO Menglei , YANG Zeng , ZHAO Jingnan , WANG Yan , MA Xiaolei , GUO Jian . Life Cycle Assessment of Biodegradable Polylactic Acid (PLA) Plastic Packaging Products—Taking Tianjin, China as a Case Study[J]. Journal of Resources and Ecology, 2022 , 13(3) : 428 -441 . DOI: 10.5814/j.issn.1674-764x.2022.03.008
Fig. 1 The main global biodegradable plastic consumption categories in 2014 |
Fig. 2 LCA system boundary for PLA plastic packaging products |
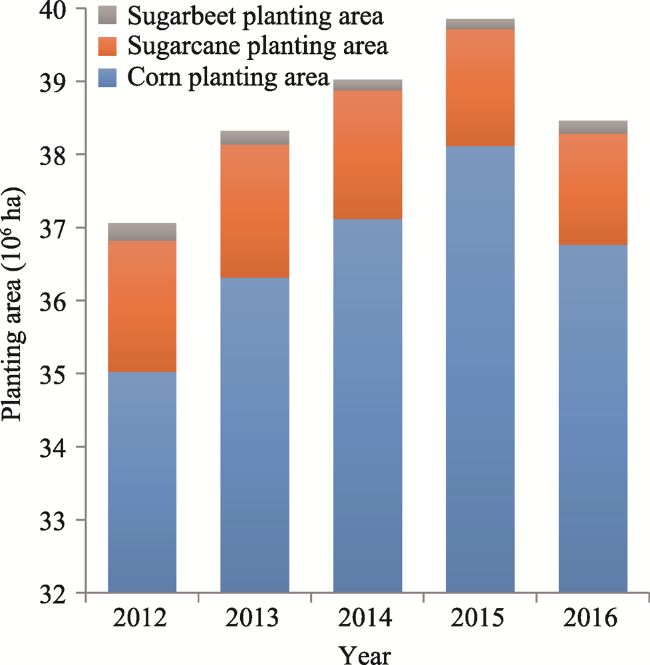
Fig. 3 The planting area of the three crops in China |
Table 1 Cost and energy analysis of raw corn |
| Term | Land lease | Corn seeds | Fertilizer | Harvest fee | Machine farming/Manual farming/Pesticides | Total |
|---|---|---|---|---|---|---|
| Cost (103 yuan ha‒1) | 3.00 | 0.80 | 1.50 | 1.00 | 1.00 | 7.30 |
Fig. 4 Production flow chart of PLA plastic packaging |
Table 2 LCA inventory of one ton PLA plastic packing products (ISO14040:2006) (Unit: kg t‒1) |
| Type | Substances | Life cycle stages | ||||||
|---|---|---|---|---|---|---|---|---|
| Raw material acquisition | Transportation of raw material | Product production | Product use | Final disposal | Total | |||
| Landfill | Incineration | |||||||
| Resources | Coal | 2.05×10² | 1.99 | 2.88×10³ | 0.13 | 7.75×10‒2 | 9.48×10‒3 | 3.08×10³ |
| Crude oil | 16.10 | 55.00 | 4.84×10² | 3.65 | 2.14 | 0.26 | 5.61×10² | |
| Natural gas* | 1.59 | 3.31×10‒3 | 35.30 | 2.20×10‒4 | 1.29×10‒4 | 1.58×10‒5 | 36.80 | |
| CO2** | ‒4.15×10³ | 0 | 0 | 0 | 0 | 0 | ‒4.15×10³ | |
| Air emissions | CO2 | 1.59×10³ | 1.40×10² | 2.84×10³ | 7.42 | 9.12 | 5.91×10² | 5.18×10³ |
| CO | 0.91 | 0.74 | 12.80 | 0.93 | 0.54 | 6.64×10‒2 | 15.98 | |
| CH4 | 0.59 | 1.43×10‒2 | 11.90 | 1.95×10‒3 | 2.26 | 1.40×10‒4 | 14.77 | |
| N2O | 21.70 | 4.05×10‒3 | 0.00 | 5.40×10‒4 | 3.17×10‒4 | 3.88×10‒5 | 21.70 | |
| SO2 | 2.24 | 0.15 | 41.60 | 4.97×10‒3 | 2.92×10‒3 | 3.57×10‒4 | 43.99 | |
| NOX | 6.31 | 3.15 | 34.20 | 6.40×10‒2 | 3.75×10‒2 | 4.59×10‒3 | 43.76 | |
| SOX | 4.12 | 0 | 0 | 0 | 0 | 0 | 4.12 | |
| PO43‒ | 0.35 | 0 | 0 | 0 | 0 | 0 | 0.35 | |
| NO3‒ | 4.76 | 0 | 0 | 0 | 0 | 0 | 4.76 | |
| NH3 | 4.23 | 0 | 0 | 0 | 0 | 0 | 4.23 | |
| NMVOC | 1.09×10‒2 | 0.56 | 1.49 | 0.18 | 0.11 | 1.29×10‒2 | 2.35 | |
| Dust | 0.30 | 1.47×10² | 0.40 | 25.30 | 14.80 | 1.81 | 2.29×10² | |
| Water emissions | Cu | 1.61 | 0 | 0 | 0 | 0 | 0 | 1.61 |
| Zn | 2.31 | 0 | 0 | 0 | 0 | 0 | 2.31 | |
| Cd | 0.33 | 0 | 0 | 0 | 0 | 0 | 0.33 | |
| Pb | 1.76×10‒2 | 0 | 0 | 0 | 0 | 0 | 1.76×10‒2 | |
| Waste liquid | 54.70 | 32.10 | 6.08×10³ | 2.14 | 1.25 | 0.15 | 6.17×10³ | |
| Waste sludge | 3.44 | 0.32 | 4.46×10² | 2.15×10‒2 | 1.26×10‒2 | 1.54×10‒3 | 4.50×10² | |
Note: * Natural gas's unit is m3 t‒1; ** CO2 refers to the amount of carbon dioxide that corn absorbs from the atmosphere through photosynthesis. NMVOC: Non methane volatile organic compounds. |
Table 3 The characterization factors of environmental impact (ISO14040:2006) |
| Impact category characterization factor | ADP | GWP | AP | EP | POCP | HTP | TETP |
|---|---|---|---|---|---|---|---|
| Coal | 27.91 | - | - | - | - | - | - |
| Crude oil | 41.87 | - | - | - | - | - | - |
| Natural gas | 38.84 | - | - | - | - | - | - |
| CO2 | - | 1.00 | - | - | - | - | - |
| CO | - | 2.00 | - | - | 2.70×10‒2 | - | - |
| CH4 | - | 21.00 | - | - | 7.00×10‒3 | - | - |
| N2O | - | 3.10×10² | - | 0.27 | - | - | - |
| SO2 | - | - | 1.00 | - | - | 9.60×10‒2 | - |
| NOX | - | - | 0.70 | 0.13 | 2.80×10‒2 | 1.20 | - |
| SOX | - | - | 0.80 | - | - | - | - |
| PO43‒ | - | - | - | 1.00 | - | - | - |
| NO3‒ | - | - | - | 0.42 | - | - | - |
| NH3 | - | - | 1.88 | 0.33 | - | - | - |
| NMVOC | - | - | - | - | 0.42 | - | - |
| Dust | - | - | - | - | - | 0.82 | - |
| Cu | - | - | - | - | - | - | 14.00 |
| Zn | - | - | - | - | - | - | 25.00 |
| Cd | - | - | - | - | - | - | 1.70×10² |
| Pb | - | - | - | - | - | - | 33.00 |
Note: ADP: abiotic depletion potential fossil fuels; GWP: global warming potential; AP: acidification potential; EP: eutrophication potential; POCP: photochemical ozone formation potential; HTP: human toxicity potential; TETP: terrestrial ecotoxicity potential. |
Table 4 The reference values of the normalization (ISO14040:2006) |
| Impact category | Unit | Reference value |
|---|---|---|
| Abiotic depletion potential fossil fuels (ADP) | MJ eq yr‒1 | 3.80×10¹⁴ |
| Global warming potential (GWP) | kg‒CO2 eq yr‒1 | 4.22×10¹³ |
| Acidification potential (AP) | kg‒SO2 eq yr‒1 | 2.39×10¹¹ |
| Eutrophication potential (EP) | kg‒PO43‒ eq yr‒1 | 1.58×10¹¹ |
| Photochemical ozone formation potential (POCP) | kg‒C2H4 eq yr‒1 | 3.68×10¹⁰ |
| Human toxicity potential (HTP) | kg‒(1,4)‒DCB eq yr‒1 | 2.58×10¹² |
| Terrestrial ecotoxicity potential (TETP) | kg‒(1,4)‒DCB eq yr‒1 | 1.09×10¹² |
Table 5 Weighting factors of the impact categories (ISO14040:2006) |
| Impact category | Weighting factor |
|---|---|
| Abiotic depletion potential (ADP fossil fuels) | 0.12 |
| Global warming potential (GWP) | 0.23 |
| Acidification potential (AP) | 0.04 |
| Eutrophication potential (EP) | 0.07 |
| Photochemical ozone formation potential (POCP) | 0.05 |
| Human toxicity potential (HTP) | 0.20 |
| Terrestrial ecotoxicity potential (TETP) | 0.11 |
Table 6 The characterization and normalization results of the LCA inventory (ISO14040:2006) |
| Impact category | Substances | Mass (kg) | Characteristic factor | Characterization result | Reference value | Normalization result | Weighting factor | Environmental impact value | Percentage of the total (%) |
|---|---|---|---|---|---|---|---|---|---|
| ADP | Coal | 3.08×10³ | 27.91 | 1.11×10⁵ | 3.80×10¹⁴ | 2.92×10‒10 | 0.12 | 3.36×10‒11 | 24.83 |
| Crude oil | 5.61×10² | 41.87 | |||||||
| Natural gas | 36.80 | 38.84 | |||||||
| GWP | CO2 | 1.03×10³ | 1.00 | 8.11×10³ | 4.22×10¹³ | 1.92×10‒10 | 0.23 | 4.42×10‒11 | 32.63 |
| CO | 15.90 | 2.00 | |||||||
| CH4 | 14.80 | 21.00 | |||||||
| N2O | 21.70 | 3.10×10² | |||||||
| AP | SO2 | 44.00 | 1.00 | 85.90 | 2.39×10¹¹ | 3.60×10‒10 | 0.04 | 1.44×10‒11 | 10.64 |
| NOX | 43.80 | 0.70 | |||||||
| SOX | 4.12 | 0.80 | |||||||
| NH3 | 4.23 | 1.88 | |||||||
| EP | PO43‒ | 0.35 | 1.00 | 15.30 | 1.58×10¹¹ | 9.67×10‒11 | 0.07 | 6.77×10‒12 | 5.00 |
| N2O | 21.70 | 0.27 | |||||||
| NOX | 43.80 | 0.13 | |||||||
| NO3‒ | 4.76 | 0.42 | |||||||
| NH3 | 4.23 | 0.33 | |||||||
| POCP | CO | 15.90 | 2.70×10‒2 | 2.74 | 3.68×10¹⁰ | 7.44×10‒11 | 0.05 | 3.72×10‒12 | 2.75 |
| CH4 | 14.80 | 7.00×10‒3 | |||||||
| NOX | 43.80 | 2.80×10‒2 | |||||||
| NMVOC | 2.35 | 0.42 | |||||||
| HTP | SO2 | 44.00 | 9.60×10‒2 | 2.44×10² | 2.58×10¹² | 9.48×10‒11 | 0.20 | 1.90×10‒11 | 14.01 |
| NOX | 43.80 | 1.20 | |||||||
| Dust | 2.29×10² | 0.82 | |||||||
| TETP | Cu | 1.61 | 14.00 | 1.36×10² | 1.09×10¹² | 1.25×10‒10 | 0.11 | 1.37×10‒11 | 10.14 |
| Zn | 2.31 | 25.00 | |||||||
| Cd | 0.33 | 1.70×10² | |||||||
| Pb | 1.76×10‒2 | 33.00 |
Note: ADP: abiotic depletion potential fossil fuels; GWP: global warming potential; AP: acidification potential; EP: eutrophication potential; POCP: photochemical ozone formation potential; HTP: human toxicity potential; TETP: terrestrial ecotoxicity potential. |
Table 7 The detailed environmental impacts of each stage |
| Impact category | Raw material acquisition | Transportation of raw material | Product production | Product use | Final disposal | Total | ||||||||
|---|---|---|---|---|---|---|---|---|---|---|---|---|---|---|
| ADP | Normalization result | 1.70×10‒11 | 6.21×10‒12 | 2.68×10‒10 | 4.12×10‒13 | 2.71×10‒13 | 2.92×10‒10 | |||||||
| Environmental impact value | 1.95×10‒12 | 7.14×10‒13 | 3.09×10‒11 | 4.74×10‒14 | 3.12×10‒14 | 3.36×10‒11 | ||||||||
| Percent (%) | 5.81 | 2.13 | 91.82 | 0.14 | 0.09 | 100.00 | ||||||||
| GWP | Normalization result | 9.92×10‒11 | 3.39×10‒12 | 7.38×10‒11 | 2.24×10‒13 | 1.54×10‒11 | 1.92×10‒10 | |||||||
| Environmental impact value | 2.28×10‒11 | 7.79×10‒13 | 1.70×10‒11 | 5.16×10‒14 | 3.53×10‒12 | 4.42×10‒11 | ||||||||
| Percent (%) | 51.67 | 1.76 | 38.45 | 0.12 | 8.00 | 100.00 | ||||||||
| AP | Normalization result | 7.50×10‒11 | 9.86×10‒12 | 2.75×10‒10 | 2.08×10‒13 | 1.37×10‒13 | 3.60×10‒10 | |||||||
| Environmental impact value | 3.00×10‒12 | 3.94×10‒13 | 1.10×10‒11 | 8.34×10‒15 | 5.49×10‒15 | 1.44×10‒11 | ||||||||
| Percent (%) | 20.84 | 2.74 | 76.33 | 0.06 | 0.04 | 100.00 | ||||||||
| EP | Normalization result | 6.59×10‒11 | 2.59×10‒12 | 2.81×10‒11 | 5.35×10‒14 | 3.52×10‒14 | 9.67×10‒11 | |||||||
| Environmental impact value | 4.61×10‒12 | 1.82×10‒13 | 1.97×10‒12 | 3.74×10‒15 | 2.46×10‒15 | 6.77×10‒12 | ||||||||
| Percent (%) | 68.15 | 2.68 | 29.07 | 0.06 | 0.04 | 100.00 | ||||||||
| POCP | Normalization result | 5.70×10‒12 | 9.25×10‒12 | 5.44×10‒11 | 2.75×10‒12 | 2.24×10‒12 | 7.44×10‒11 | |||||||
| Environmental impact value | 2.85×10‒13 | 4.63×10‒13 | 2.72×10‒12 | 1.38×10‒13 | 1.12×10‒13 | 3.72×10‒12 | ||||||||
| Percent (%) | 7.67 | 12.44 | 73.18 | 3.70 | 3.01 | 100.00 | ||||||||
| HTP | Normalization result | 3.11×10‒12 | 4.81×10‒11 | 3.02×10‒11 | 8.06×10‒12 | 5.31×10‒12 | 9.48×10‒11 | |||||||
| Environmental impact value | 6.23×10‒13 | 9.62×10‒12 | 6.04×10‒12 | 1.61×10‒12 | 1.06×10‒12 | 1.90×10‒11 | ||||||||
| Percent (%) | 3.29 | 50.75 | 31.86 | 8.50 | 5.60 | 100.00 | ||||||||
| TETP | Normalization result | 1.25×10‒10 | 0 | 0 | 0 | 0 | 1.25×10‒10 | |||||||
| Environmental impact value | 1.37×10‒11 | 0 | 0 | 0 | 0 | 1.37×10‒11 | ||||||||
| Percent (%) | 100.00 | 0 | 0 | 0 | 0 | 100.00 | ||||||||
Note: ADP: abiotic depletion potential fossil fuels; GWP: global warming potential; AP: acidification potential; EP: eutrophication potential; POCP: photochemical ozone formation potential; HTP: human toxicity potential; TETP: terrestrial ecotoxicity potential. |
Fig. 5 Results of the environmental impact values of different life cycle stagesNote: ADP: abiotic depletion potential fossil fuels; GWP: global warming potential; AP: acidification potential; EP: eutrophication potential; POCP: photochemical ozone formation potential; HTP: human toxicity potential; TETP: terrestrial ecotoxicity potential. |
Fig. 6 The proportions of different life cycle stages in the seven impact categoriesNote: ADP: abiotic depletion potential fossil fuels; GWP: global warming potential; AP: acidification potential; EP: eutrophication potential, POCP: photochemical ozone formation potential; HTP: human toxicity potential; TETP: terrestrial ecotoxicity potential. |
Fig. 7 Environmental impact proportions of each impact category in the entire life cycleNote: ADP: abiotic depletion potential fossil fuels; GWP: global warming potential; AP: acidification potential; EP: eutrophication potential; POCP: photochemical ozone formation potential; HTP: human toxicity potential; TETP: terrestrial ecotoxicity potential. |
Table 8 The contributions of different substances to different environmental impacts in the stage of raw material acquisition |
| Impact category | Substance | Raw material acquisition | Contribution (%) | Impact category | Substance | Raw material acquisition | Contribution (%) | ||
|---|---|---|---|---|---|---|---|---|---|
| Mass (kg) | Characterization | Mass (kg) | Characterization | ||||||
| TETP | Cu | 1.61 | 22.50 | 16.52 | AP | SO2 | 2.24 | 2.24 | 12.50 |
| Zn | 2.31 | 57.80 | 42.38 | NOX | 6.31 | 4.42 | 24.67 | ||
| Cd | 0.33 | 55.50 | 40.68 | SOX | 4.12 | 3.29 | 18.39 | ||
| Pb | 1.76×10‒2 | 0.58 | 0.43 | NH3 | 4.23 | 7.96 | 44.43 | ||
| Total | 1.36×10² | 100.00 | Total | 17.90 | 100.00 | ||||
| GWP | CO2* | -2.56×10³ | -2.56×10³ | -61.02 | EP | PO43‒ | 0.35 | 0.35 | 3.34 |
| CO | 0.91 | 1.83 | 0.04 | N2O | 21.70 | 5.86 | 56.22 | ||
| CH4 | 0.59 | 12.30 | 0.29 | NOX | 6.31 | 0.82 | 7.87 | ||
| N2O** | 21.70 | 6.73×10³ | 160.68 | NO3‒ | 4.76 | 2.00 | 19.18 | ||
| Total | 4.19×10³ | 100.00 | NH3 | 4.23 | 1.40 | 13.39 | |||
| Total | 10.40 | 100.00 | |||||||
Note: GWP: global warming potential; AP: acidification potential; EP: eutrophication potential; TETP: terrestrial ecotoxicity potential; * The amount of carbon dioxide that corn takes out of the atmosphere through photosynthesis, so the value is negative; ** N2O emissions divided by total emissions, so the result is greater than 100%. |
Table 9 The contributions of different substances to different environmental impacts in the transportation of raw material stage |
| Impact category | Substance | Transportation of raw material | Contribution (%) | Impact category | Substance | Transportation of raw material | Contribution (%) | ||
|---|---|---|---|---|---|---|---|---|---|
| Mass (kg) | Characterization | Mass (kg) | Characterization | ||||||
| POCP | CO | 0.74 | 2.00×10‒2 | 5.86 | HTP | SO2 | 0.15 | 1.44×10‒2 | 0.01 |
| CH4 | 1.43×10‒2 | 1.00×10‒4 | 0.03 | NOX | 3.15 | 3.78 | 3.05 | ||
| NOX | 3.15 | 8.82×10‒2 | 25.88 | Dust | 1.47×10² | 1.20×10² | 96.94 | ||
| NMVOC | 0.56 | 0.23 | 68.23 | Total | 1.24×10² | 100.00 | |||
| Total | 0.34 | 100.00 | |||||||
Note: POCP: photochemical ozone formation potential; HTP: human toxicity potential. |
Table 10 The contributions of different substances to different environmental impacts in the stage of product production |
| Impact category | Substance | Product production | Contribution (%) | Impact category | Substance | Product production | Contribution (%) | ||
|---|---|---|---|---|---|---|---|---|---|
| Mass (kg) | Characterization | Mass (kg) | Characterization | ||||||
| ADP | Coal | 2.88×10³ | 8.03×10⁴ | 78.78 | EP | PO43‒ | 0.00 | 0.00 | 0.00 |
| Crude oil | 4.84×10² | 2.03×10⁴ | 19.88 | N2O | 0.00 | 0.00 | 0.00 | ||
| Natural gas | 35.30 | 1.37×10³ | 1.34 | NOX | 34.20 | 4.45 | 100.00 | ||
| Total | 1.02×10⁵ | 100.00 | NO3‒ | 0.00 | 0.00 | 0.00 | |||
| GWP | CO2 | 2.84×10³ | 2.84×10³ | 91.17 | NH3 | 0.00 | 0.00 | 0.00 | |
| CO | 12.80 | 25.50 | 0.82 | Total | 4.45 | 100.00 | |||
| CH4 | 11.90 | 2.50×10² | 8.01 | POCP | CO | 12.80 | 0.35 | 17.19 | |
| N2O | 0.00 | 0.00 | 0.00 | CH4 | 11.90 | 8.33×10‒2 | 4.15 | ||
| Total | 3.12×10³ | 100.00 | NOX | 34.20 | 0.96 | 47.81 | |||
| AP | SO2 | 41.60 | 41.60 | 63.47 | NMVOC | 1.49 | 0.62 | 30.85 | |
| NOX | 34.20 | 24.00 | 36.53 | Total | 2.00 | 100.00 | |||
| SOX | 0.00 | 0.00 | 0.00 | HTP | SO2 | 41.60 | 4.00 | 5.13 | |
| NH3 | 0.00 | 0.00 | 0.00 | NOX | 34.20 | 41.10 | 52.73 | ||
| Total | 65.60 | 100.00 | Dust | 40.00 | 32.80 | 42.13 | |||
| Total | 77.90 | 100.00 | |||||||
Note: ADP: abiotic depletion potential fossil fuels; GWP: global warming potential; AP: acidification potential; EP: eutrophication potential; POCP: photochemical ozone formation potential; HTP: human toxicity potential. |
Table 11 Comparison of life cycle evaluation results between PLA and PE food packaging products |
| Term | Unit | PLA packaging plastic | PE plastic bag | PLA/PE |
|---|---|---|---|---|
| CO2 emissions | kg | 1.03×10³ | 4.10×10³ | 0.25 |
| NOx emissions | kg | 43.80 | 1.90 | 23.1 |
| SOx emissions | kg | 4.12 | 5.55 | 0.74 |
| CxHy emissions | kg | 14.80 | 21.00 | 0.71 |
| Total energy | MJ | 66.52×10³ | 6.08×10³ | 10.90 |
| [1] |
|
| [2] |
|
| [3] |
|
| [4] |
China Plastics Processing Industry Association. 2018. China plastics processing industry (2017). China Plastics, 32(4): 1-5. (in Chinese)
|
| [5] |
|
| [6] |
EPRO (European Association of Plastics Recycling and Recovery Organisations). 2018. Plastic Europe 2018: Plastics-The facts. Brussels, Belgium: Association of Plastic Manufacturers.
|
| [7] |
EPRO (European Association of Plastics Recycling and Recovery Organisations). 2019. Plastic Europe 2019: Plastics-The facts. Brussels, Belgium: Association of Plastic Manufacturers.
|
| [8] |
|
| [9] |
|
| [10] |
|
| [11] |
|
| [12] |
|
| [13] |
|
| [14] |
|
| [15] |
International Organization for Standardization. 2006. Environmental management-Life cycle assessment-Principles and framework (ISO 14040:2006). Berlin, Germany: Deutsches Institut für Normung.
|
| [16] |
|
| [17] |
|
| [18] |
|
| [19] |
|
| [20] |
|
| [21] |
|
| [22] |
|
| [23] |
|
| [24] |
|
| [25] |
|
| [26] |
|
| [27] |
|
| [28] |
|
| [29] |
|
| [30] |
|
| [31] |
|
| [32] |
|
| [33] |
|
| [34] |
|
/
| 〈 |
|
〉 |


