Land Use and Sustainable Development

Analysis of the Spatio-temporal Differentiation of Cultivated Land Pressure in the Pearl River-Xijiang Economic Zone and Its Influencing Factors

  • CHEN Shiyin , 1 ,
  • WU Xuebiao 1 ,
  • MA Zhiyu 1, 2 ,
  • BIN Jinyou , 1, 2, *
Expand
  • 1. Management College of Guangdong Ocean University, Zhanjiang, Guangdong 524088, China
  • 2. Guangdong Coastal Economic Belt Development Research Institute, Zhanjiang, Guangdong 524088, China

CHEN Shiyin, E-mail:

Received date: 2020-10-13

  Accepted date: 2021-10-01

  Online published: 2022-04-18

Supported by

The Guangdong Education Science Planning Project(2019GXJK080)

The Guangdong Philosophy and Social Science Planning Project(GD19YYJ03)

The Guangdong Coastal Economic Belt Development Research Institute 2020 Special Project(YJY202002)

Abstract

Cultivated land pressure is often used to reflect the shortage of cultivated land resources. By using the methods of the Cultivated Land Pressure Index, coefficient of variation and cold-hot spot analysis, this paper analyzes the spatial-temporal differentiation pattern and dynamic change processes of cultivated land pressure in the counties of the Pearl River-Xijiang Economic Zone from 2008 to 2017, and measures the factors which influence cultivated land pressure by using Principal Component Analysis. The results show that the cultivated land pressure in the Pearl River-Xijiang Economic Zone has been in a “high pressure” state, and the Cultivated Land Pressure Index has been rising continuously from 2008 to 2017. The coefficient of variation of the Cultivated Land Pressure Index in the Pearl River-Xijiang Economic Zone and various prefecture-level cities is fluctuating and rising, which indicates that the overall spatial differences in the cultivated land pressure in this region are expanding and polarization is obvious. In addition, the area where the municipal district of the provincial capital city is located is the core area of urban development and also the area with the greatest cultivated land pressure. The spatial pattern of cultivated land pressure cold-hot spots in the Pearl River-Xijiang Economic Zone is obviously heterogeneous, in which the Pearl River Economic Zone is the main hot spot gathering area and the Xijiang Economic Zone is the main cold spot gathering area. Farmers' income, investment in fixed assets, GDP, population and other socio-economic factors are the main factors driving the changes in the cultivated land pressure in the Pearl River-Xijiang Economic Zone. Furthermore, farming production factors, such as the multiple cropping index and grain yield per unit area, will also have an important impact on the changes in the cultivated land pressure.

Cite this article

CHEN Shiyin , WU Xuebiao , MA Zhiyu , BIN Jinyou . Analysis of the Spatio-temporal Differentiation of Cultivated Land Pressure in the Pearl River-Xijiang Economic Zone and Its Influencing Factors[J]. Journal of Resources and Ecology, 2022 , 13(3) : 407 -416 . DOI: 10.5814/j.issn.1674-764x.2022.03.006

1 Introduction

Cultivated land is the material basis on which human beings rely for survival, and an important guarantee for food secu rity and even national security. Thus, it is basic national policy to cherish, rationally utilize and effectively protect the cultivated land in China. With China's social and economic development, population growth, industrialization and urbanization are accelerating, the problems associated with cultivated land are becoming more and more serious, cultivated land resources are increasingly occupied and destroyed, the quality, quantity and ecological conditions of cultivated land are declining day by day, and the bearing pressure of cultivated land is further increasing. Data show that the cultivated land area in China at the end of 2017 was 1.349×10⁸ ha. The cultivated land area in 2017 was reduced by 3.204×10⁶ ha due to construction occupation, disaster damage, ecological conversion of farmland, agricultural structure adjustments, etc. The cultivated land area in 2017 was increased by 2.595×10⁶ ha through land consolidation, agricultural structure adjustments, etc., so the net reduction of the cultivated land area in 2017 was 6.09×10⁵ ha. The food self-sufficiency rate is below 95% of the world security norms (Wang and Tian, 2020). In recent years, soil erosion, pesticide and fertilizer pollution, waste discharge and many other factors have caused the problem of cultivated land quality degradation to intensify day by day, so the contradiction between people, land and grain has been aggravated, and the task of protecting cultivated land is still very daunting.
Researchers typically use cultivated land pressure to measure the use of cultivated land resources. Cultivated land pressure refers to the ratio of the minimum cultivated land area to the actual per capita cultivated land area required to meet the normal living standard of each person. It emphasizes the measurement index of regional grain production and cultivated land resource security (Cai et al., 2002; Yang and Ren, 2009; Chen and Zhang, 2017). At the same time, it is also an important basis for measuring regional land carrying capacity. Scholars have provided valuable experience for studies of cultivated land pressure, cultivated land carrying capacity and so on, by deeply exploring the spatial-temporal differences in cultivated land pressure and its evolution at different regional scales. The research on cultivated land pressure mainly focuses on the evaluation models of cultivated land pressure (Zhao and Niu, 2015; Zhu et al., 2016), dynamic changes and predictions (Ban and Sun, 2017; Chao et al., 2018; Yang et al., 2018; Fan et al., 2019), spatial differentiation, driving forces and influencing factors (Zhang and Wang, 2017; Zhang et al., 2018; Yang et al., 2019; Luo et al., 2020), etc. For example, Zhang et al. (2018) analyzed the spatial-temporal characteristics and types of cultivated land pressure at different scales in China by using the revised Cultivated Land Pressure Index model, the center of gravity model and cluster analysis from the three scales of the country, four major economic regions and provincial regions. Zhang and Wang (2017) used the Cultivated Land Pressure Index, GDI index, spatial autocorrelation, average growth index and other methods to analyze the influences of social and economic factors on the spatial-temporal differentiation of cultivated land pressure in 342 prefectural administrative regions of China from 2001 to 2013. By using the grey system theory GM(1,1) prediction model, grey Markov model and system dynamics simulation model, the variations in the Cultivated Land Pressure Index in a research area can be predicted (Song et al., 2016; Fan et al., 2019; Tan et al., 2020). Yang et al. (2020) explored the space-time coupling characteristics of cultivated land pressure and economic development in Henan Province by using the Cultivated Land Pressure Index and center of gravity model. On the whole, the existing research is based on the national, provincial, municipal and other levels, while few studies have considered the cross-regional scale of the spatial-temporal differentiation characteristics of cultivated land pressure. This limitation has severed the relationships between micro-scale units of cross-administrative regions with adjacent geographical locations, relatively consistent natural environment conditions and relatively close social and economic ties, which makes it easy to ignore the spatial-temporal difference characteristics of cultivated land pressure between the cross-regional scales.
In view of this and based on the cross-regional perspective, this paper takes the Pearl River-Xijiang Economic Zone as the research object and the county as the research unit. In order to clarify the regional characteristics of cultivated land pressure and identify the factors driving the changes of cultivated land pressure, this paper provides an important basis and theoretical support for the effective formulation of differentiated regional land development and utilization policies, the sustainable development of food security and the coordination of regional sustainable development.

2 Research area

The Pearl River-Xijiang Economic Zone is located in the south of China. This region mainly includes Guangzhou, Foshan, Zhaoqing and Yunfu in Guangdong Province and Nanning, Liuzhou, Wuzhou, Guigang, Baise, Laibin and Chongzuo in Guangxi Zhuang Autonomous Region (Fig. 1). The total area of the region is 1.65×10⁵ km2, accounting for 1.72% of the total land area in China. The economic zone spans the hills of Guangdong and Guangxi. The terrain is generally high in the northwest and low in the southeast. The topography is complex and varied, but mainly mountainous and hilly. Guigang City has the largest plain in Guangxi, the “Xunyu Plain”. Guangzhou, Foshan and Zhaoqing are located in the Pearl River Delta. The plain topography is the main feature and the terrain fluctuations are small. The whole economic zone belongs to the subtropical monsoon humid climate, with high temperatures and rainy in summer, mild temperatures and humid in winter, with an annual rainfall of over 1000 mm, mainly concentrated in summer. It also has sufficient light and a good combination of hydrothermal conditions, which is suitable for the cultivation of grain crops and cash crops such as rice, sugar cane, etc. The Pearl River-Xijiang River system traverses the economic zone with abundant water resources and sufficient irrigation water. The soil type in the economic zone is mainly lateritic red soil, with a relatively heavy and compact texture, poor soil fertility and serious soil erosion tendencies. In 2017, the area of cultivated land in the Pearl River-Xijiang Economic Zone was 3.323×10⁶ ha, the per capita cultivated land area was 0.06 ha, the permanent population was 5.529×10⁷ and the gross domestic product was 4.631×10¹² yuan. Among them, the added value of the primary industry was 2.307×10¹¹ yuan, up 3.49% year on year. The added value of the secondary industry was 1.874×10¹² yuan, up 10.83% year on year. The added value of the tertiary industry was 2.528×10¹² yuan, up 10.5% year on year.
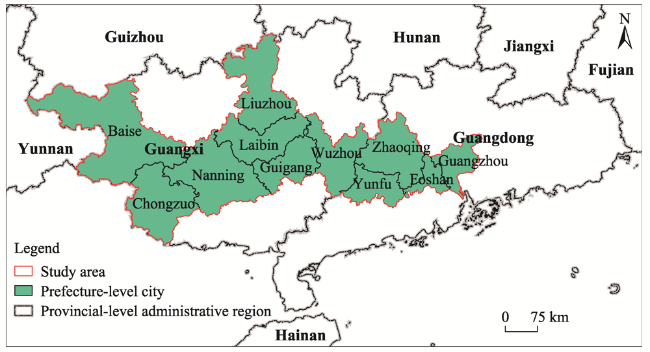
Fig. 1 Map of Pearl River-Xijiang Economic Zone

3 Research method

3.1 Cultivated Land Pressure Index

(1) Minimum cultivated land area per capita. To a certain extent, this measure shows the warning limit of arable land area for food security in a certain region (Zhang et al., 2017; Yang et al., 2018), and its calculation formula is as follows:
${{S}_{\text{min}}}=\beta \times \frac{{{G}_{r}}}{p\times q\times k}$
In the formula, Smin is the minimum cultivated area per capita (ha person-1); β is the grain self-sufficiency rate (%); Gr is the per capita food demand (kg person-1); p is grain yield (kg ha-1); q is the ratio (%) of grain sown area to total sown area; and k is multiple cropping index (%).
(2) Cultivated Land Pressure Index. This index refers to the ratio of the minimum cultivated land area per capita to the actual cultivated land area per capita (Zhang et al., 2017; Yang et al., 2018), and its calculation formula is as follows:
$K={{S}_{\min }}/S$
In the formula, K is the Cultivated Land Pressure Index, Smin is the minimum cultivated land area per capita (ha person-1), and S is the actual cultivated land area per capita (ha person-1). When K<1, the pressure of cultivated land in the region is relatively light. When K=1, the pressure of cultivated land in the region is at the critical position. When K>1, the pressure of cultivated land in the region is greater.

3.2 Coefficient of variation

The coefficient of variation can be used to measure the differences in the Cultivated Land Pressure Index among regions (Zhang et al., 2017). The greater the value of the two, the greater the differences, and its calculation formula is as follows:
$Cv=\frac{1}{{\bar{y}}}\sqrt{\frac{1}{n-2}\sum\limits_{i=1}^{n}{{{({{y}_{i}}-\bar{y})}^{2}}}}$
In the formula, Cv is the coefficient of variation; $\bar{y}$ is the average value of Cultivated Land Pressure Index; n is the number of research units; and yi is the Cultivated Land Pressure Index for each area.

3.3 Cold-hot Spot Analysis

The Cold-hot Spot Analysis (Getis-Ord Gi*) (Li et al., 2017) can be used to show the spatial correlation and agglomeration characteristics of cultivated land pressure in the Pearl River-Xinjiang Economic Zone, and its calculation formula is:
${{G}_{i}}^{*}=\frac{\sum\limits_{i=1}^{n}{{{W}_{ij}}{{x}_{i}}}}{\sum\limits_{i=1}^{n}{{{x}_{i}}}}$
In the formula, Wij is the spatial adjacent weight matrix of each spatial unit i and j in the research area. When the two are adjacent, Wij takes a value of 1, otherwise, it is 0; and xi is the observation value of unit i. Gi* is used to identify the spatial dependence and spatial heterogeneity of cultivated land pressure. When Gi* is significantly positive, the area belongs to the hot spot area; otherwise, it belongs to the cold spot area.

3.4 Principal Component Analysis

The Principal Component Analysis method (Han et al., 2020) uses the idea of dimension reduction to convert multiple variables (a1,..., am) into several comprehensive variables (Z1,..., Zm) on the premise of losing only a limited amount of information, and the principal components are not correlated with each other:
${{Z}_{m}}=\sum\limits_{i=1}^{m}{{{a}_{i}}{{x}_{i}}}$
In the formula, Zm is the dependent variable; x1, x2,..., xm are the independent variables; a1,..., am are the independent variable index coefficient vectors; and m is the number of independent variable indicators.

4 Results

4.1 Characteristics of the spatial and temporal variations in cultivated land pressure

4.1.1 Characteristics of time series changes

According to formulas (1) and (2), based on the calculation of the Cultivated Land Pressure Index for each prefecture-level city in the Pearl River-Xijiang Economic Zone from 2008 to 2017, the value of the change is calculated, and the time series change of the Cultivated Land Pressure Index in the Pearl River-Xijiang Economic Zone from 2008 to 2017 is shown in Fig. 2. The pressure index of cultivated land in the Pearl River-Xijiang Economic Zone shows an upward trend year by year, and it is always greater than 3, rising from 3.77 in 2008 to 4.76 in 2017, an increase of 26.26% (Fig. 2). This indicates that the pressure of cultivated land is very high. The main reason for the increase in the Cultivated Land Pressure Index is the acceleration of industrialization and urbanization in the Pearl River-Xijiang Economic Zone in recent years, which has led to the continuous increase in the urban construction land area, the continuous construction of roads and railways, and the increasing proportion of cultivated land occupied by construction land year by year. At the same time, the increasing population has made the cultivated land pressure in the Pearl River-Xijiang Economic Zone increase continuously.
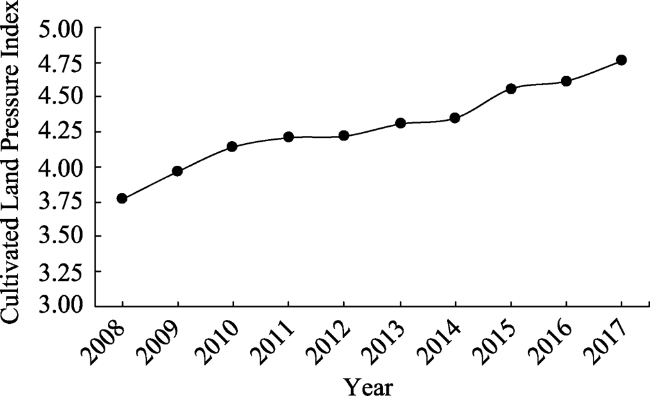
Fig. 2 Changes of the Cultivated Land Pressure Index in Pearl River-Xijiang Economic Zone from 2008 to 2017

4.1.2 Spatial distribution characteristics

(1) Characteristics of the overall spatial differences
According to formula (3), the coefficient of variation of the Cultivated Land Pressure Index in the Pearl River-Xijiang Economic Zone was calculated for all prefecture-level cities from 2008 to 2017 (Fig. 3). From 2008 to 2017, the coefficient of variation of the Pearl River-Xijiang Economic Zone showed a fluctuating upward trend, from 0.0389 in 2008 to 0.0452 in 2009. It then showed slow growth from 2009 to 2014. After 2014, it began to increase significantly, and rose to 0.0623 in 2017. These data indicate that the overall spatial difference of cultivated land pressure in the cities of the Pearl River-Xijiang Economic Zone showed a continuously expanding trend during the study period. Among the cities, the coefficient of variation of Cultivated Land Pressure Index in Guangzhou shows the largest increase and the most obvious upward trend, from 0.0379 in 2008 to 0.0790 in 2017, for an increase of 0.0411, which indicates that the spatial differences of cultivated land pressure among counties (cities) in the city area were gradually increasing. The coefficient of variation of the Cultivated Land Pressure Index in Foshan has the largest base and shows an upward trend, but the growth rate is relatively slow, from 0.0604 in 2008 to 0.0680 in 2009. The growth rate is also slow from 2009 to 2014, and then starts to increase significantly after 2014, rising to 0.0822 in 2017, which indicates that the spatial difference of cultivated land pressure among counties (cities) in this city is the largest in the whole economic zone. The coefficient of variation of the Cultivated Land Pressure Index in Chongzuo City is the smallest, showing a fluctuating upward trend overall, and the spatial difference of cultivated land pressure among counties (cities) in this city region is the smallest in the whole economic zone.
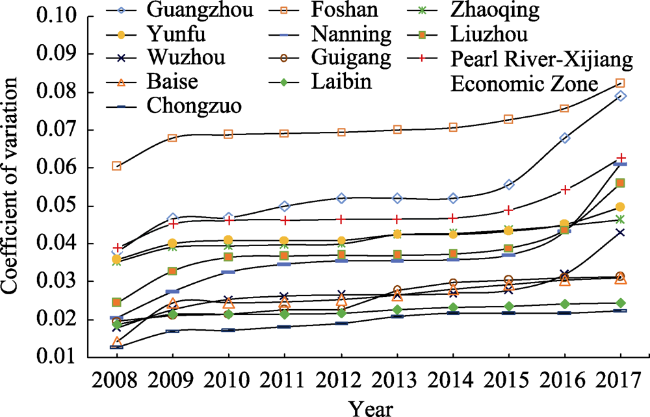
Fig. 3 The Cv of the Cultivated Land Pressure Index in the Pearl River-Xijiang Economic Zone and various prefecture-level cities from 2008 to 2017
The main reason for this spatial heterogeneity is that the differences in economic development and the total populations of cities in the Pearl River-Xijiang Economic Zone are very large, and the internal factors of cultivated land resources in different cities are also significantly different, thus the overall spatial differences of cultivated land pressure are significant. Guangzhou has been gradually readjusting its administrative divisions since 2015. The proposal of Guangdong, Hong Kong, Macao and the Great Bay Area has promoted Guangzhou's economic growth once again. At the same time, the population has continued to increase sharply, which will increase the pressure on the cultivated land in Guangzhou, thus causing the coefficient of variation of the cultivated land pressure in Guangzhou to vary greatly. Meanwhile, Foshan has a well-developed manufacturing industry, with a large demand for arable land occupied by industry and a large population in the region, but with less arable land resources in the region, thus its arable land pressure is significant and its coefficient of variation is the largest. Chongzuo's total resident population is the smallest in the region, the total economic volume is relatively small, and the cultivated land area is relatively large, so its cultivated land pressure is the smallest in the economic zone and its coefficient of variation is the smallest.
(2) Characteristics of the spatial pattern classification
According to the Cultivated Land Pressure Index of the counties in the Pearl River-Xijiang Economic Zone in 2008, 2012 and 2017, and with the use of ArcGIS 10.1, the natural fracture method was applied to divide it into seven levels (I-VII), and the spatial pattern classification and distribution map of Cultivated Land Pressure Index of the counties in the Pearl River-Xijiang Economic Zone was drawn (Fig. 4). As can be seen from Fig. 4, the spatial pattern classification of the cultivated land pressure in the Pearl River-Xijiang Economic Zone shows the characteristics of overall dispersion and local concentration. From the quantitative distribution at all levels, the counties of grades IV, V, VI and VII still account for a large proportion of the total number. Therefore, the cultivated land pressure in the Pearl River- Xijiang Economic Zone is still very large, and the task of relieving the cultivated land pressure in the region is still formidable. Guangdong Province is mainly a cluster area of counties of Grades V and VI, and the spatial pattern classification of cultivated land pressure is less differentiated. A wider variety of cultivated land pressure levels are distributed in Guangxi Zhuang Autonomous Region, and the spatial pattern classification of cultivated land pressure is very different.
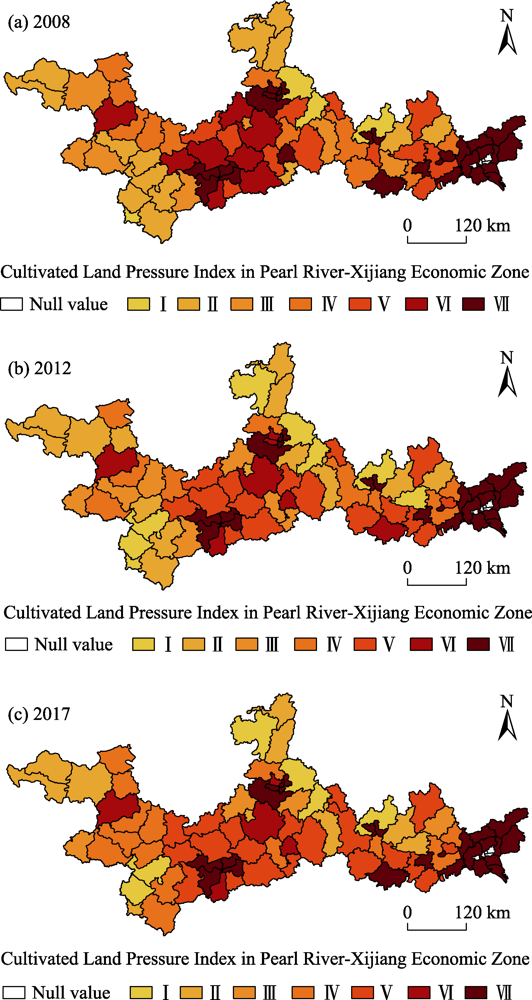
Fig. 4 Spatial distribution of Cultivated Land Pressure Index in the counties of the Pearl River-Xijiang Economic Zone in 2008, 2012 and 2017.
Specifically, the number of Grade I counties is relatively small, and their spatial distribution is mainly concentrated in remote areas and the economically underdeveloped counties and cities. The number of counties in Grade II is relatively large, but it shows a decreasing trend of fluctuations. The spatial distribution shows obvious dispersion characteristics, and they are generally distributed around the counties in Grade I and III. The total number of counties in Grade III shows a fluctuating trend. These counties are mainly concentrated in the upper reaches, and the number in the upper reaches gradually increases, while the number in the lower reaches is very small, showing a trend of shifting westward. The overall number of counties in Grade IV shows a fluctu ating downward trend, and these counties are mainly concentrated in Baise and Zhaoqing. The overall number of counties in Grade V shows a relatively large upward trend. The spatial distribution shows a trend from dispersion to agglomeration, and gradually forms agglomeration areas in Nanning, Wuzhou and Yunfu. The total number of counties in Grade VI shows a decreasing trend, and the spatial distribution of these counties shows the characteristics of concentration to dispersion, mainly concentrated in Nanning, and the distribution quantity gradually decreases. The number of counties at Grade VII shows an upward trend of fluctuation in the total amount, and the spatial distribution shows a phenomenon of large-scale dispersion and local agglomeration, mainly in counties and cities with large populations and developed economies.
The vast economic differences within the region is the main reason why the spatial pattern classification of cultivated land pressure in the Pearl River-Xijiang Economic Zone is characterized by overall dispersion and local agglomeration. Baiyun District, Shunde District, Xingning District, Chengzhong District and other counties (cities) are the core areas of urban development. Their economic development levels and industrialization levels are relatively high, and their population densities are large. However, the total amount of cultivated land resources in the region is gradually decreasing due to the needs of urban construction and development, so the contradiction between economic development and cultivated land protection is prominent. At the same time, agricultural structure adjustment and ecological construction occupy a part of the cultivated land, causing great pressure on cultivated land and forming Grade VII areas. However, Lingyun County, Jinxiu Yao Autonomous County, Tiandeng and other counties (cities) are relatively rich in cultivated land resources, with relatively high grain yield, relatively slow economic development, less human-land conflicts and relatively light pressure on the cultivated land.
(3) The characteristics of spatial correlation agglomeration
ArcGIS 10.1 was used to further analyze the spatial correlation and agglomeration characteristics of the Cultivated Land Pressure Index of the Pearl River-Xijiang Economic Zone in 2008, 2012 and 2017, and the region is divided into four characterization states: Hot spots, sub-hot spots, sub-cold spots and cold spots. The spatial distribution map of the cold-hot spots of the Cultivated Land Pressure Index in the counties of the Pearl River-Xijiang Economic Zone is shown in Fig. 5.
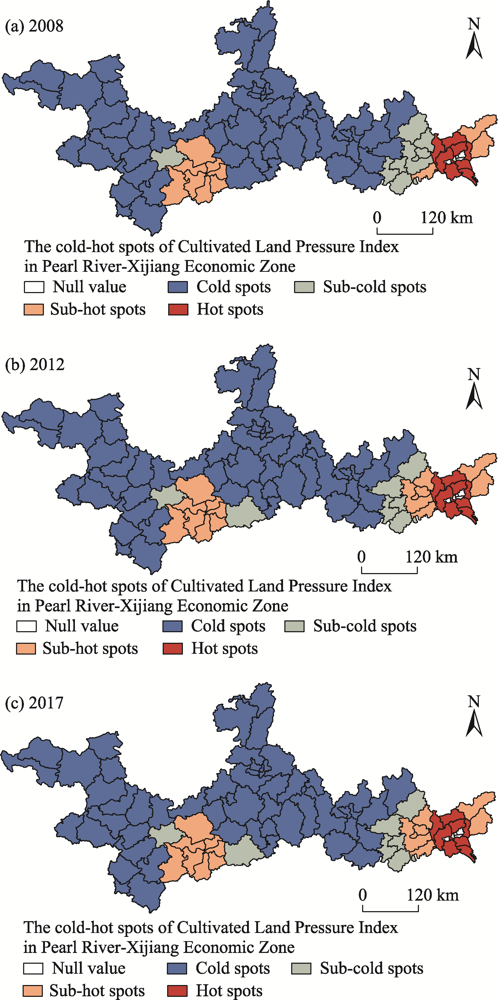
Fig. 5 Spatial distribution of cold-hot spots of Cultivated Land Pressure Index in counties of the Pearl River-Xijiang Economic Zone in 2008, 2012 and 2017.
In general, the cultivated land pressure in the Pearl River- Xijiang Economic Zone from 2008 to 2017 shows a “core- edge” spatial distribution characteristic that is gradually excessive from the hot spot area to the cold spot area around the provincial capital city (Fig. 5). Specifically, the cold spots are distributed in patches. In 2008, 2012 and 2017, there were 55 regions located in the cold spots of the Cultivated Land Pressure Index. Except for Huaiji County, Fengkai County, Deqing County, Yunan County and Luoding City, the remainders are distributed in Guangxi Zhuang Autonomous Region, accounting for 84.75% of the research area of Guangxi Zhuang Autonomous Region and 56.82% of the whole research area. This pattern shows that the cultivated land pressure of Guangxi Zhuang Autonomous Region has been relatively light for a long time. The sub-cold spots are mainly distributed around the sub-hot spots and hot spots, and most of them are distributed in Zhaoqing City and Yunfu City of Guangdong Province. The sub-hot spots show the characteristics of local concentration and distribution, and are mainly distributed in Nanning City of Guangxi Zhuang Autonomous Region, as well as Foshan City and Guangzhou City of Guangdong Province. However, there are 13 regions located in the hot spots of the Cultivated Land Pressure Index in the three periods, and they are all distributed in Guangdong province, accounting for 44.83% of the total number of research areas in Guangdong province. This shows that the cultivated land pressure in Guangdong province has been very high for a long time, and the task of relieving the cultivated land pressure will be daunting.
The concentration of spatial correlations of cultivated land pressure is not only affected by internal factors of cultivated land resources, but also by external factors such as the social economy. Guangzhou and Foshan are two economically developed cities in the Pearl River-Xijiang Economic Zone. Located in the Pearl River Delta, Guangzhou and Foshan are the two core cities in the Pearl River-Xijiang Economic Zone with superior geographical locations, perfect regional infrastructure and complete industrial structure. Their rapid economic growth has had a serious impact on the regional pressure on the cultivated land. Therefore, the cultivated land in these two cities is under great pressure, appearing as hot spots in the spatial agglomeration and forming sub-hot spots around them under the influence of the spatial agglomeration effect. Nanning, as the capital city of Guangxi Zhuang Autonomous Region, has accelerated its industrialization and urbanization in recent years. The size of the built-up area is increasing and the population is growing rapidly, both of which have increased the pressure on cultivated land. However, due to Nanning's continuous improvement in the level of grain yield per unit area, the pressure on cultivated land has been relieved to some extent and it has formed a sub-hot area. Zhaoqing City, Yunfu City and other regions have relatively good agricultural production conditions such as a regionally effective irrigation area and grain yield per unit area. Moreover, the regional economy is at a moderate level of development and the total population is moderate. As a result, the pressure on cultivated land is slightly greater, forming sub-cold spots. Liuzhou City, Baise City, Chongzuo City and other cities have formed cold spots due to the relatively coordinated development of their regional cultivated land resources and social and economic development, with less pressure on the cultivated land.

4.2 Main factors influencing the spatio-temporal differentiation of cultivated land pressure

4.2.1 Factor selection

The spatial pattern of cultivated land pressure is influenced by many factors. In order to determine the main factors affecting the spatial-temporal differentiation of cultivated land pressure in the Pearl River-Xijiang Economic Zone, we referred to the existing research results (Zhang et al., 2017; Chen et al., 2020; Lu et al., 2020; Luo et al., 2020; Ma et al., 2020) and considered the availability of data, maneuverability and the possible influences of social and economic factors on cultivated land pressure. The eight factors of GDP (X1), investment in fixed assets (X2), per capita net income of farmers (X3), population (X4), multiple cropping index (X5), grain yield level (X6), proportion of irrigated area (X7) and per capita cultivated area (X8), which have significant impacts on the Cultivated Land Pressure Index were selected and analyzed by the Principal Component Analysis method. Among them, the selected regional GDP (X1) reflects the overall level of economic development of a region; Fixed assets investment (X2) reflects the regional infrastructure investment environment; Per capita net income (X3) of farmers affects the enthusiasm of farmers to a large extent, and directly or indirectly affects the output and sowing area of grain crops, which then affects the pressure of cultivated land; Population (X4) is an important indicator of the contradiction between man and land, which has a significant impact on the pressure of cultivated land; Crop index (X5) affects the planting area of grain crops by increasing the rate of crop replanting, thus affecting the pressure of cultivated land; Grain yield level (X6) directly reflects grain yield per unit area; Proportion of irrigation area (X7) characterizes the irrigation conditions of water resources of regional cultivated land resources, and influences the pressure of cultivated land by affecting grain yield and sowing area; and, finally, Per capita cultivated land area (X8) reflects the status of cultivated land per capita and the endowment of cultivated land resources.

4.2.2 Factor analysis

SPSS 17.0 was used to analyze and process the data of the eight indexes, and the correlation coefficient between each factor and the Cultivated Land Pressure Index was obtained (Table 1). Among them, the correlation coefficients between irrigation area proportion (X7) and per capita arable land area (X8) are less than 0, so they will not be considered further. The KMO statistic is 0.746 and the Bartlett spherical test result is 0.000, which indicate that the model is reasonable and suitable for Principal Component Analysis.
Table 1 Correlation coefficients of the eight factors and the Cultivated Land Pressure Index
Factor Correlation coefficient Factor Correlation coefficient
GDP (X1) 0.979 Multiple-crop index (X5) 0.896
Investment in fixed assets (X2) 0.987 Grain yield per unit area (X6) 0.864
Per capita net income of farmers (X3) 0.973 Proportion of irrigated area (X7) -0.412
Population (X4) 0.995 Per capita cultivated land (X8) -0.988
Table 2 shows that the cumulative contribution rate of the first two principal components is 98.832%, exceeding 85%. Therefore, these two factors are selected as common factors for analyzing the factors influencing cultivated land pressure, and the maximum variance rotation is further performed to obtain the factor load matrix (Table 3).
Table 2 Results of Principal Component Analysis
Principal component Characteristic value Contribution rate (%) Cumulative contribution rate (%)
1 5.683 94.710 94.710
2 0.247 4.122 98.832
3 0.057 0.950 99.782
4 0.009 0.157 99.939
5 0.003 0.044 99.983
6 0.001 0.017 100.000
Table 3 Factor load matrix after orthogonal rotation
Factor First principal component Second principal component
GDP (X1) 0.832 0.551
Investment in fixed assets (X2) 0.839 0.543
Per capita net income of farmers (X3) 0.857 0.506
Population (X4) 0.829 0.540
Multiple-crop index (X5) 0.551 0.824
Grain yield per unit area (X6) 0.514 0.849
Table 3 shows that the load amount of the first principal component to X1, X2, X3 and X4 is large; and the second principal component has a large load on X5 and X6.
After sorting out the above factors, the main factors that affect the pressure level of the cultivated land can be generally summarized as socio-economic factors, productivity factors and farming conditions.
(1) Analysis of social and economic factors. Table 2 shows that the contribution rate of the first principal component is 94.710%, which indicates that it occupies a dominant position among all influencing factors. In the first principal component, X3 has the largest load, followed by X1 and X2, which shows that socio-economic factors have great influences on cultivated land pressure. The calculation of the Cultivated Land Pressure Index is closely related to the minimum per capita cultivated land area, which is calculated based on the supply and demand of grain. Farmers' production and living are closely related to the supply and demand of grain, so the per capita net income of farmers has the greatest influence on cultivated land pressure.
(2) Analysis of factors affecting farming conditions. The multiple cropping index of the Pearl River-Xijiang Economic Zone rose from 1.23 in 2008 to 1.37 in 2017. Table 3 shows that the multiple cropping index contributes a higher percentage to the second principal component, which indicates that the multiple cropping index has a greater impact on agricultural production. Therefore, on the premise that other agricultural production conditions remain unchanged, the multiple cropping index can be improved by improving the level of agricultural science and technology to increase grain output, thus achieving the purpose of relieving the pressure on cultivated land.
(3) Analysis of factors affecting productivity. X6 has a high contribution rate to the second principal component, which indicates that improving the productivity level plays a great role in relieving the pressure on cultivated land. Therefore, in the process of agricultural production, we should pay attention to increasing scientific and technological investments, popularizing new agricultural technologies, improving the level of agricultural mechanization, increasing the per unit yield of grain, and thus reducing the pressure on cultivated land.
In summary, the degrees of influence of the various factors influencing cultivated land pressure are different, in the order of socio-economic influencing factors > cultivation conditions influencing factors > productivity influencing factors. The specific influencing factors were analyzed, and their order of influence is per capita net income of farmers > investment in fixed assets > GDP > population > multiple cropping index > grain yield level.

5 Conclusions and recommendations

The Cultivated Land Pressure Index was used to analyze the cultivated land pressure in the Pearl River-Xijiang Economic Zone from the perspectives of spatial-temporal differentiation characteristics and influencing factors. This analysis found that the cultivated land pressure in the economic zone is expanding at this stage, and the cultivated land pressure is still relatively high. In order to alleviate the current situation of high cultivated land pressure in the region and ensure regional food security, a series of suggestions are offered.
According to the characteristics of time series changes, the cultivated land pressure in the Pearl River-Xijiang Economic Zone has shown a fluctuating upward trend since 2008. Therefore, the task of relieving the cultivated land pressure in the economic zone will be daunting. The government should improve the cultivated land protection policy, increase the intensity of cultivated land protection, stick to the red line of cultivated land protection, and ensure regional food security.
From the perspective of spatial distribution characteristics, there are significant differences in the pressure on cultivated land in the Pearl River-Xijiang Economic Zone. From the perspective of sustainable development, measures should be taken to develop, utilize and protect cultivated land according to local conditions, reasonably protect cultivated land resources in the economic zone and ensure food security, intensify the adjustments of agricultural structure, implement strict policies on cultivated land protection, strictly control the conversion of cultivated land into non- cultivated land, and implement a policy of balancing the occupation and compensation of cultivated land in areas with high pressure on the cultivated land. Efforts should be made to promote land development, reclamation and consolidation, and at the same time increase investments in science and technology, improve the level of grain yield per unit area, improve the conditions for the development and utilization of arable land, and strengthen the construction of agricultural infrastructure. For regions with less pressure on their arable land, the adjustments of the regional agricultural structure should be scientifically and reasonably promoted to improve the income level of farmers.
From the perspective of influencing factors, various factors have different degrees of influence on the pressure of cultivated land in the Pearl River-Xijiang Economic Zone. We should start with the factors that have greater degrees of influence, namely, paying attention to the protection of cultivated land while developing the economy, increasing investments in scientific research, improving the level of agricultural production, adjusting the agricultural structure and reasonably increasing the “grain-to-sow ratio”, so as to achieve the purpose of reducing the pressure of cultivated land.
[1]
Ban L G, Sun L N. 2017. Space differentiation characteristics of cultivated land pressure index and their prediction in Jilin. Chinese Agricultural Science Bulletin, 33(36): 124-130. (in Chinese)

[2]
Cai Y L, Fu Z Q, Dai E F. 2002. The minimum area per capita of cultivated land and its implication for the optimization of land resource allocation. Acta Geographica Sinica, 57(2): 127-134. (in Chinese)

[3]
Chao Z H, Zhang P D, Wang X F. 2018. Impacts of urbanization on the net primary productivity and cultivated land change in Shandong Province, China. Journal of the Indian Society of Remote Sensing, 46(5): 809-819.

DOI

[4]
Chen S P, Zhang L Q. 2017. Change characteristics and driving factors of food production and cropland pressure in Anhui Province during 1995-2013. Bulletin of Soil and Water Conservation, 37(3): 167-173, 187. (in Chinese)

[5]
Fan Y F, Yang H C, Zhang Y X. 2019. Dynamic analysis and prediction of cultivated land pressure index in Anhui Province. Henan Science, 37(12): 1949-1954. (in Chinese)

[6]
Han Q Z, Feng Q, Gao H D, et al. 2020. Influencing factors of agricultural production changes in Guanzhong based on PCA. Arid Land Geography, 43(2): 474-480. (in Chinese)

[7]
Li E T, Lu Y Q, Huang Q F, et al. 2017. Economic differences between time and space evolution and driving factors about Pan Pearl River- West River Economic Belt. Economic Geography, 37(5): 20-27. (in Chinese)

[8]
Lu X H, Liu R H, Kuang B. 2019. Regional differences and dynamic evolution of cultivated land pressure in Hubei Province. Transactions of the Chinese Society of Agricultural Engineering, 35(23): 266-272. (in Chinese)

[9]
Luo H P, Zhou J Y, He Z W. 2020. Empirical study and early warning on spatial differentiation of arable land pressure and its influencing factors in main grain-producing regions based on county scale. Acta Agriculturae Zhejiangensis, 32(8): 1493-1505. (in Chinese)

[10]
Ma X, Zhen X X, Wang Y, et al. 2020. Study on the spatial-temporal evolution of cultivated land pressure and its driving factors in Central Plains Economic Region. Chinese Journal of Agricultural Resources and Regional Planning, 42(3): 58-66. (in Chinese)

[11]
Song X P, Ma S C, Zhang H B, et al. 2016. Dynamic analysis and prediction of cultivated land pressure in Henan Province based on food security. Chinese Agricultural Science Bulletin, 32(33): 162-168. (in Chinese)

[12]
Tan S K, Han S Y, Zhang L. 2020. Study on fallow scale and dynamical simulation of major grain producing areas in China from the food security perspective. China Land Science, 34(2): 9-17. (in Chinese)

[13]
Wang Y F, Tian Z H. 2020. Research on the standard of grain statistics in China. World Agriculture, (1): 58-63.

[14]
Yang Q Y, Yang R H, Wang Y H, et al. 2019. Does fallowing cultivated land threaten food security? Empirical evidence from Chinese pilot provinces. Sustainability, 11(10): 2836. DOI: 10.3390/su11102836.

DOI

[15]
Yang R, Ren Z Y. 2009. Analysis of spatio-temporal dynamic changes and driving factors of food security and cultivated land pressure in Guizhou Province. System Science and Comprehensive Research in Agriculture, 25(2): 158-162. (in Chinese)

[16]
Yang R H, Yang Q Y, Chen Y D, et al. 2018. Cultivated area-food- population system in land fallow area and analysis of spatio-temporal evolution and prediction of cultivated land index-A case study of Hebei Province. Agricultural Research in the Arid Areas, 36(3): 270-278. (in Chinese)

[17]
Yang X J, Qin M Z, Zhang P Y, et al. 2020. Spatio-temporal analysis of coupling characteristics of cultivated land pressure and economic development in Henan Province. Areal Research and Development, 39(3): 144-149. (in Chinese)

[18]
Zhang G S, Wang F Z, Kang J Y, et al. 2017. Spatial pattern of rrban-rural income gap and its influencing factors at county level in Yangtze River Economic Belt. Economic Geography, 37(4): 42-51. (in Chinese)

DOI

[19]
Zhang H, Wang Y. 2017. Spatial differentiation of cropland pressure and its socio-economic factors in China based on panel data of 342 prefectural-level units. Geographical Research, 36(4): 731-742. (in Chinese)

[20]
Zhang Y J, Yan X S, Zhang F, et al. 2018. Analysis on temporal-spatial difference of cultivated land pressure at multiple scales in China from 1978 to 2015. Transactions of the Chinese Society of Agricultural Engineering, 34(13): 1-7. (in Chinese)

[21]
Zhao S X, Niu H P. 2015. Study on the cropland pressure in Henan Province based on grey markov model. Journal of Arid Land Resources and Environment, 29(8): 46-51. (in Chinese)

[22]
Zhu H B, Yuan Y, Sun H N. 2016. Model of cultivated land pressure index under different grain purchase and sale: Theory and demonstration. Journal of Statistics and Decision, (18): 38-41. (in Chinese)

Outlines

/