
Journal of Resources and Ecology >
Patterns and Driving Forces of Cropland Abandonment in Mountainous Areas
|
CHEN Shuanglong, E-mail: chenshuanglong@igsnrr.ac.cn |
Received date: 2020-11-14
Accepted date: 2021-08-20
Online published: 2022-04-18
Supported by
The National Natural Science Foundation of China(42071233)
The Project of the Second Tibetan Plateau Scientific Expedition and Research(2019QZKK0603)
The Project of the Strategic Priority Research Program of Chinese Academy of Sciences(XDA20040201)
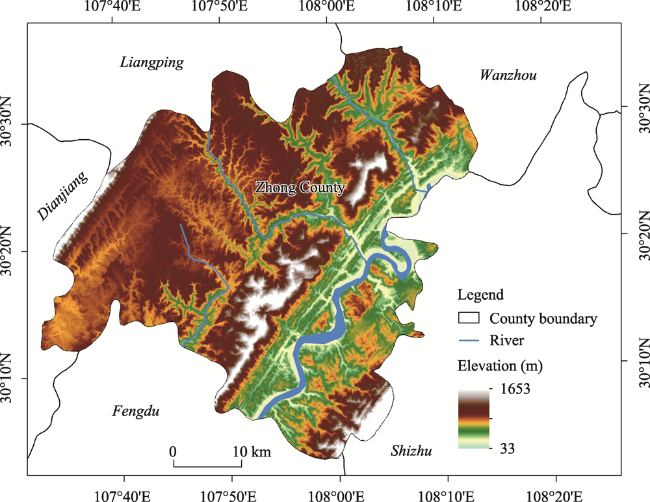
Cropland abandonment is spreading from developed countries to developing countries such as China. Cropland abandonment in China commonly occurs in mountainous areas due to their specific natural and geographical conditions. However, due to the lack of dependable monitoring methods via medium-high-resolution remote sensing images, the scale of abandoned cropland in many mountainous areas of China is unclear, and the mechanisms driving cropland abandonment have not been clearly identified. To overcome these limitations, we took Zhong County of Chongqing in China as an example, and used Landsat 8 OLI_TIRS remote sensing image data to develop a method for mapping abandoned cropland in mountainous areas based on annual land use change monitoring. At the same time, the ridge regression method was adopted to analyze the factors influencing cropland abandonment. These analyses showed that the cropland abandonment rate in Zhong County of Chongqing was as high as 7.86%, while the overall accuracy of identifying abandoned cropland was as high as 90.82%. Among the social and economic factors that affect cropland abandonment, the rural population, economic development, and livestock husbandry development were the most important ones. At the land parcel scale, large-scale cropland abandonment occurred in areas at elevations above 650 m or with slopes of more than 15°.
Key words: cropland abandonment; remote sensing; driving factors; Zhong County; China
CHEN Shuanglong , SONG Wei , LI Han , LI Han . Patterns and Driving Forces of Cropland Abandonment in Mountainous Areas[J]. Journal of Resources and Ecology, 2022 , 13(3) : 394 -406 . DOI: 10.5814/j.issn.1674-764x.2022.03.005
Fig. 1 Geographic location of Zhong County in China |
Table 1 Specific parameters of the acquired Landsat 8 images |
| Acquisition date | Cloud cover (%) | Solar azimuth (°) | Solar height (°) |
|---|---|---|---|
| 2013-08-12 | 10.22 | 120.83 | 64.07 |
| 2014-07-30 | 6.06 | 113.21 | 65.49 |
| 2015-01-22 | 18.70 | 151.16 | 34.62 |
| 2016-06-17 | 0.14 | 103.77 | 68.91 |
| 2017-07-22 | 6.20 | 109.64 | 66.38 |
| 2018-06-07 | 4.42 | 105.74 | 68.90 |
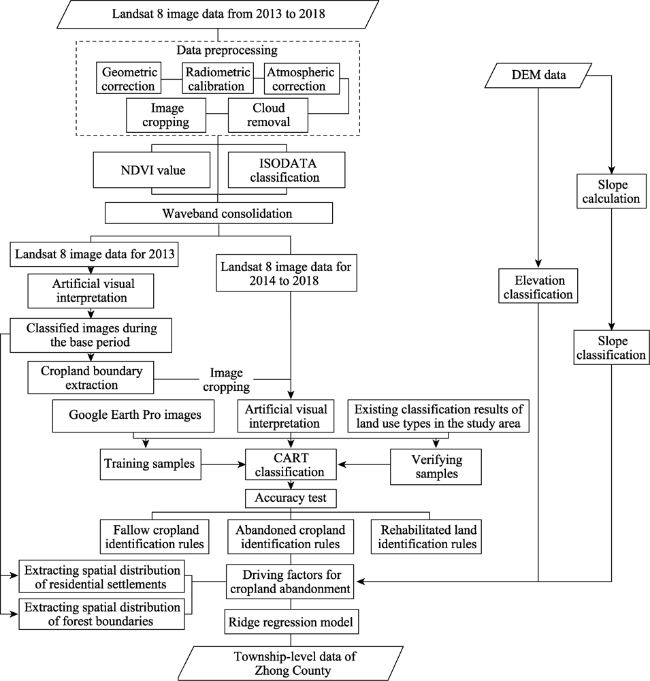
Fig. 2 Technical process |
Table 2 Social and economic development variables, summary statistics, and the expected effects of each variable |
| Variables | Minimum | Maximum | Mean | Standard deviation | Expected effect | |
|---|---|---|---|---|---|---|
| Dependent variable | Cropland abandonment rate (%) | 0.87 | 24.04 | 8.66 | 1.110 | |
| Independent variable | Explanatory variables birth rate (%) | 7.51 | 14.56 | 11.38 | 0.392 | - |
| Out-migrants (person) | 32 | 2761 | 326.36 | 92.954 | + | |
| Natural population growth rate (%) | -3.26 | 6.34 | 2.11 | 0.586 | - | |
| Rural population (person) | 6932 | 49629 | 26787.61 | 2279.835 | - | |
| Student enrollment (person) | 385 | 37717 | 4000.71 | 1321.580 | + | |
| Capital introduction from outside the county (104 yuan) | 1000 | 10500 | 5633.21 | 585.161 | +/- | |
| Average disposable personal income of rural residents (yuan) | 8350 | 12236 | 9959.25 | 203.303 | + | |
| Added value of agriculture (104 yuan) | 1425 | 21500 | 11163.79 | 999.254 | - | |
| Industrial added value (104 yuan) | 978 | 499812 | 29073.50 | 17848.175 | + | |
| Industrial investment (104 yuan) | 350 | 193312 | 16850.25 | 8843.985 | + | |
| Total retail sales of consumer goods (104 yuan) | 1099 | 376457 | 20573.68 | 13228.794 | +/- | |
| Individual business (household) | 100 | 10131 | 1045.07 | 346.572 | + | |
| Meat production (t) | 408 | 4715 | 2641.89 | 233.094 | - | |
| Citrus cultivation area (km2) | 0.08 | 23.12 | 8.00 | 1.35 | +/- | |
Note: Out-migration refers to residents perpetually or persistently migrating from an emigration area to a relocation area; Capital introduction from outside the county refers to the amount of money introduced from outside the study area through investment promotion; Individual business refers to the families engaging in industrial and commercial business. |
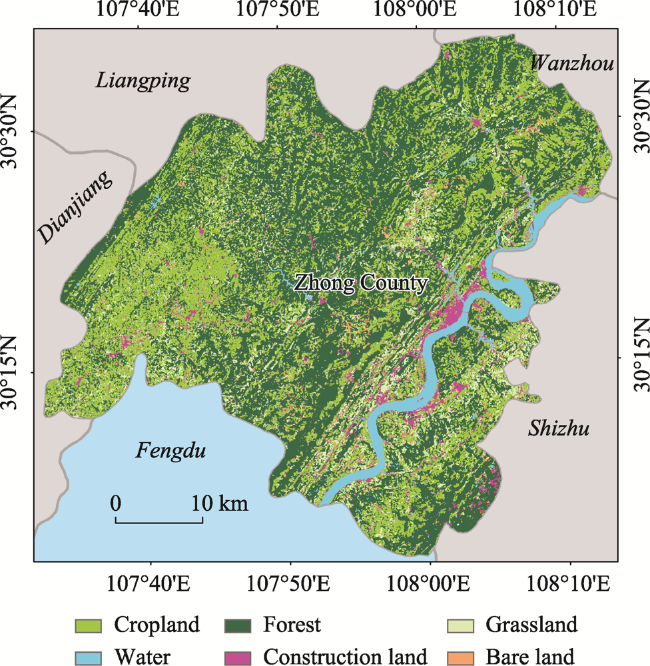
Fig. 3 Distribution of land use types in Zhong County in 2013 |
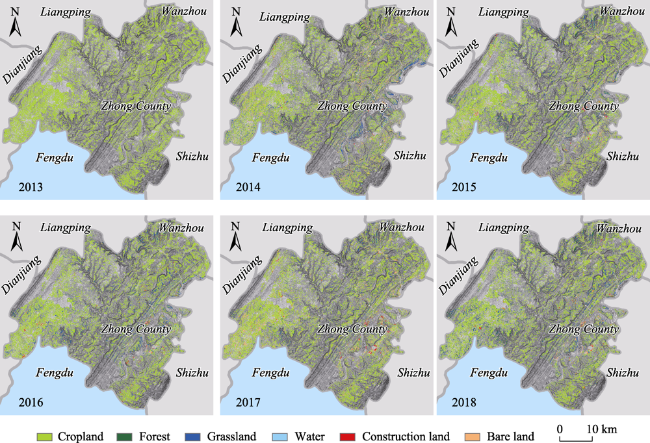
Fig. 4 Land-use changes within the cropland boundary of Zhong County in 2013, 2014, 2015, 2016, 2017, 2018. |
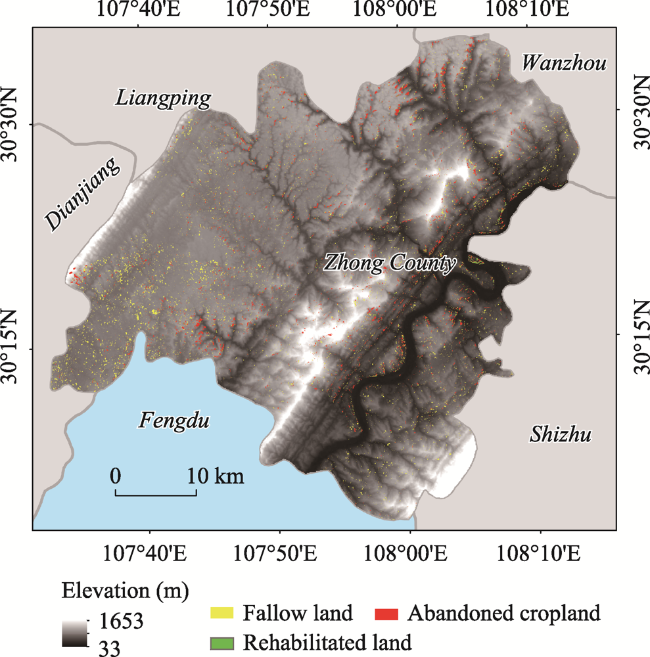
Fig. 5 Spatial distribution of fallow land, abandoned land, and rehabilitated land in Zhong County from 2013 to 2018. |
Table 3 Regression results of the social and economic explanatory variables |
| Explanatory variable | Ridge regression model | ||||
|---|---|---|---|---|---|
| Estimated parameter | Normalized parameter | Standard error | t value | ||
| Constant | 9.03 | ||||
| Birth rate | -0.19 | -1.010 | 0.803 | 0.803 | |
| Out-migrants | 0.18 | 0.942 | 1.345 | 1.345 | |
| Natural population growth rate | 0.19 | 0.978 | 0.757 | 0.757 | |
| Rural population | -0.41** | -2.117 | 2.332 | 2.332 | |
| Student enrollment | 0.31** | 1.609 | 2.453 | 2.453 | |
| Capital introduction from outside the county | 0.63** | 3.297 | 2.520 | 2.520 | |
| Average disposable personal income of rural residents | 0.74*** | 3.868 | 2.810 | 2.810 | |
| Added value of agriculture | -0.67*** | -3.464 | 3.528 | 3.528 | |
| Industrial added value | 0.17 | 0.875 | 1.289 | 1.289 | |
| Industrial investment | -0.17 | -0.863 | 0.656 | 0.656 | |
| Total retail sales of consumer goods | 0.27** | 1.392 | 2.138 | 2.138 | |
| Individual business | 0.21* | 1.104 | 1.817 | 1.817 | |
| Meat production | -0.47*** | -2.418 | 2.596 | 2.596 | |
| Citrus cultivation area | -0.42 | -2.166 | 1.55 | 1.55 | |
Note: ***, **, and * represent significance at P < 0.01, P < 0.05, and P < 0.1, respectively. |
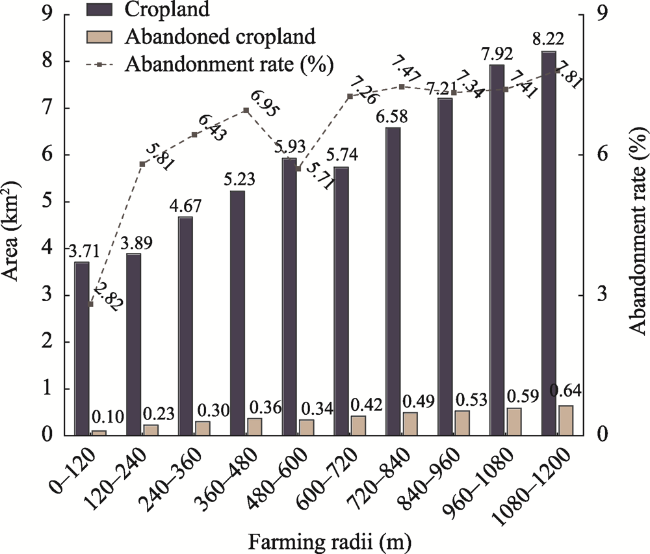
Fig. 6 Cropland area, abandoned land area, and abandonment rate at different farming radii. |
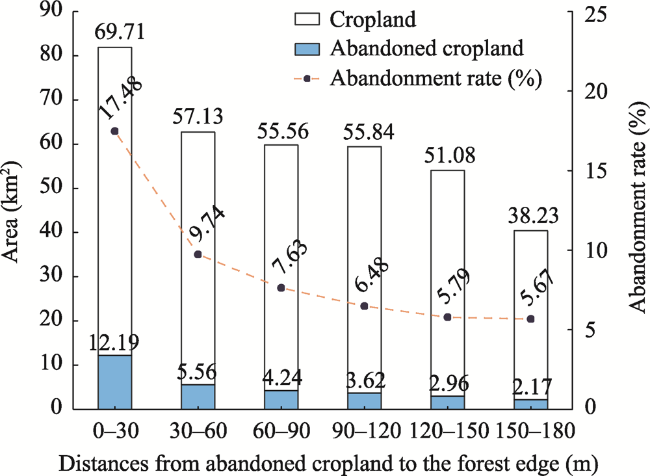
Fig. 7 Cropland area, abandoned land area, and abandonment rate at different distances from the abandoned cropland to the forest edge. |
Table 4 Influences of different slope grades on cropland abandonment in Zhong County |
| Slope (°) | 0-2 | 2-6 | 6-15 | 15-25 | 25-35 | ≥35 |
|---|---|---|---|---|---|---|
| Abandoned cropland (km2) | 0.61 | 3.61 | 14.71 | 14.33 | 5.27 | 0.80 |
| Cropland (km2) | 37.13 | 169.44 | 232.44 | 56.81 | 4.14 | 0.20 |
| Abandonment rate (%) | 1.40 | 1.81 | 5.00 | 15.95 | 40.81 | 65.04 |
Note: Abandonment rate refers to the area of abandoned cropland with different slope divided by the area of cropland with corresponding slope in 13 years. |
Table 5 Influences of different elevation grades on cropland abandonment in Zhong County |
| Elevation (m) | 0-200 | 200-350 | 350-500 | 500-650 | 650-800 | ≥800 |
|---|---|---|---|---|---|---|
| Abandoned cropland (km2) | 1.26 | 7.04 | 15.81 | 11.64 | 3.12 | 0.46 |
| Cropland (km2) | 18.41 | 97.01 | 213.04 | 148.72 | 20.53 | 2.44 |
| The abandonment rate (%) | 6.82 | 7.26 | 7.42 | 7.83 | 15.22 | 18.79 |
Note: Abandonment rate refers to the area of abandoned cropland with different elevations divided by the area of cropland with corresponding elevation in 13 years. |
| [1] |
|
| [2] |
|
| [3] |
|
| [4] |
|
| [5] |
|
| [6] |
|
| [7] |
|
| [8] |
|
| [9] |
|
| [10] |
|
| [11] |
|
| [12] |
|
| [13] |
|
| [14] |
|
| [15] |
|
| [16] |
|
| [17] |
|
| [18] |
|
| [19] |
|
| [20] |
|
| [21] |
|
| [22] |
|
| [23] |
|
| [24] |
|
| [25] |
|
| [26] |
|
| [27] |
|
| [28] |
|
| [29] |
|
| [30] |
|
| [31] |
|
| [32] |
|
| [33] |
|
| [34] |
|
| [35] |
|
| [36] |
|
| [37] |
|
| [38] |
|
| [39] |
|
| [40] |
|
/
| 〈 |
|
〉 |