
Journal of Resources and Ecology >
An Ecological Compensation Mechanism based on the Green Productive Area of Cities
|
YANG Yuanchuan, E-mail: yyc_archi@tju.edu.cn |
Received date: 2020-11-24
Accepted date: 2021-03-29
Online published: 2022-04-18
Supported by
The National Natural Science Foundation of China(51978443)
The National Natural Science Foundation of China(52078322)
The Youth Program of National Natural Science Foundation of China(51708395)
The Tianjin Graduate Research and Innovation Project in 2009(2019YJSB175)
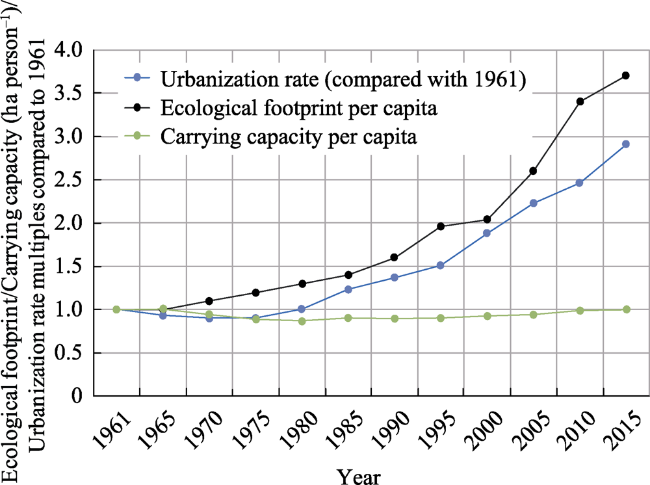
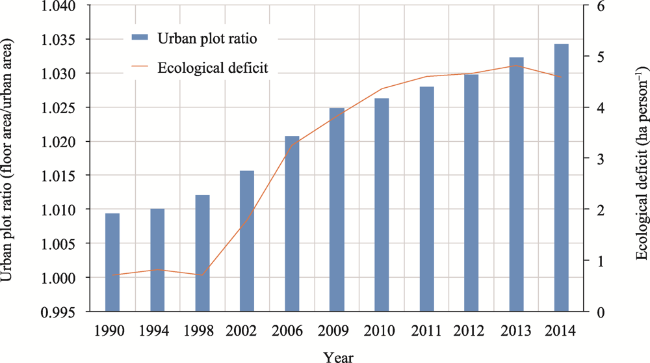
China's urban expansion, food security, and energy transition are in a critical situation. One solution is to tap into the green production potential of the built urban environment and explore new ways to save land space and alleviate ecological pressure through food and solar energy production. This paper differs from previous ecological compensation studies, which mostly focus on key ecological functional areas or fiscal compensation mechanisms, in that it innovatively establishes an ecological compensation mechanism within the urban space. In this paper, we propose the "green productive area" of cities as a way to measure the ecological carrying capacity improvement potential of cities from the perspective of urban ecology, and it is based on converting the green resource income of cities into the ecological footprint area they could save under the same conditions. First, a typological approach was used to establish a compensation strategy for green production. Second, a spatial inventory was taken of all elements of the built environment and an analysis of their green production potential was carried out. Finally, it was necessary to establish a unified accounting standard for the ecological land saving benefits of different green production options, which could be converted into green productive land area indicators. In the case of Xuefu Street in Nankai District, Tianjin, the available rooftops and idle land were used for green production, which supplemented the ecological carrying capacity provided by the natural land occupied by 12% of the buildings in the district.
YANG Yuanchuan , ZHANG Yukun , ZHENG Jie , HUANG Si , ZHAO Man , HONG Long . An Ecological Compensation Mechanism based on the Green Productive Area of Cities[J]. Journal of Resources and Ecology, 2022 , 13(3) : 382 -393 . DOI: 10.5814/j.issn.1674-764x.2022.03.004
Table 1 Summary of the strategies for built environmental elements and types of green production |
| Built environmental elements | Urban agriculture | Photovoltaic power | Generation multifunctional | Other | |
|---|---|---|---|---|---|
| Buildings and structures | Roofs | 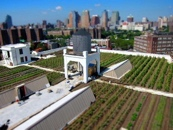 Open air planting1 | 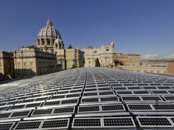 Roof covering2 |  PV greenhouses3 |  Roof wind energy4 |
| Balconies Elevation (Walls, windows) | 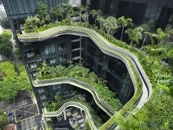 Use of balcony5 | 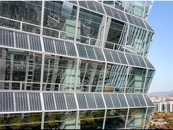 Facade integration6 | 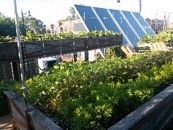 Side by side7 | 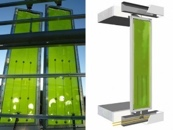 Green algae blinds8 | |
| Courtyards Basements | 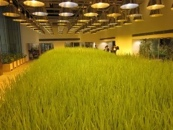 Indoor planting9 | 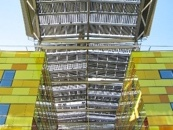 PV atrium10 | 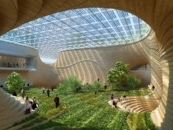 Ecological atrium11 | 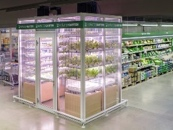 Indoor planters12 | |
| External spaces | Piazza Greenfield Water | 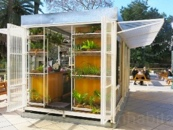 Kiosks13 | 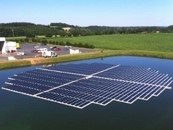 Water surface PV14 | 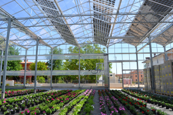 Replacement15 | 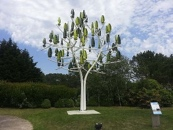 Wind energy tree16 |
| City roads Parking lots | 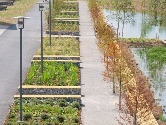 Vegetable beds17 | 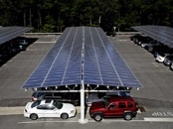 Parking shed18 | 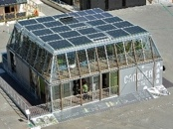 Integrated units19 | 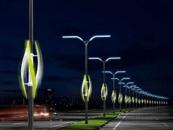 Wind energy lights20 | |
| Idle land | 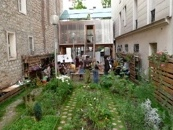 Use of open space21 | 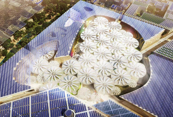 Courtyard22 | 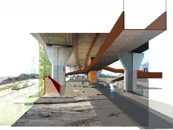 Negative space23 | 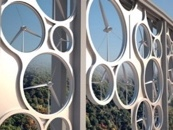 Under the bridge24 | |
| Infrastructure | Roads Railways (Stations) | 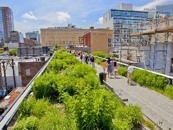 Highline park25 | 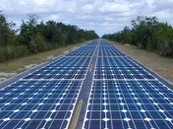 Roadway PV26 | 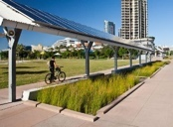 Integrated corridor27 | 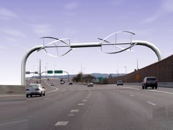 Road wind energy28 |
| Landfills Water plants Storage | 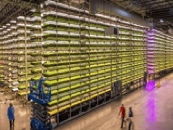 Vertical farm29 | 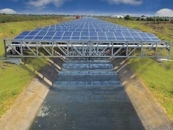 Aqueduct PV30 | 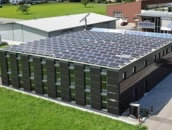 Composite plant31 |  Biomass32 | |
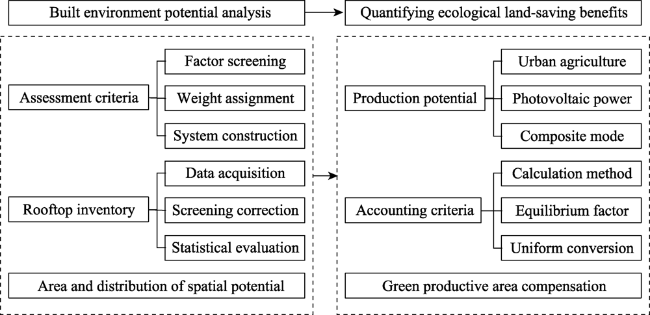
Fig. 3 Assessment framework for spatial potential and ecological benefits |
Table 2 Evaluation criteria and references for green production suitability of roofs and idle land |
| Criteria | Indicators | References | |
|---|---|---|---|
| Planning | Field location | Roof accessibility (I1) | Nicole, 2014; Wang et al., 2016; Lv, 2017 |
| Traffic accessibility (I2) | |||
| Functional properties | Architecture (I3) | The People's Government of Beijing Municipality, 2011; Sbicca, 2019 | |
| Land (I4) | |||
| Technology | Basic conditions | Roof material, age, height and carrying capacity (I5) | The People's Government of Beijing Municipality, 2011; Esther, 2015; Wang et al., 2016 |
| soil quality (I6) | |||
| Production conditions | Sun shade (I7) | Esther, 2015; Nadal et al., 2017; Saha et al., 2017 | |
| Irrigation source (I8) | |||
| shape (I9) | |||
| Economy | Usable area (I10) | Esther, 2015; Smith et al., 2017 | |
| Legal entitlement (I11) | Wang et al., 2016 | ||
Table 3 Grading scores and weights for green production suitability of roofs and idle land |
| Indicators | Quantitative rating descriptions of indicators | Weight | |||
|---|---|---|---|---|---|
| 1 | 2 | 3 | 4 | ||
| Roof accessibility (I1) | Climbing ladders | Outdoor stairs | Elevator or stairs | Floor | 0.09 |
| Traffic accessibility (I2)1 (Walking/public transit) | >500 m | 300-500 m | 100-300 m | <100 m | 0.04 |
| Architecture (I3) | Affordable facilities | Industrial buildings | Residential buildings | Service-oriented public buildings | 0.07 |
| Land (I4) | Filter reserved, protected and prohibited areas based on land use planning | - | |||
| Roof material (I5-1) | Asbestos, wood | Brick, steel tile | Concrete, steel | Concrete, steel | 0.04 |
| Age (I5-2) | Protect buildings | >20 yr | 10-20 yr | <10 yr | 0.04 |
| Height (I5-3)2 | >12 stories | 7-12 stories | 4-6 stories | 1-3 stories | 0.09 |
| Carrying capacity (I5-4)3 | 0.7 kN m-2-2 kN m-2 | ≥2 kN m-2 | ≥2 kN m-2 | ≥2 kN m-2 | 0.14 |
| Site permeability (I6-1)4 | <20% | 20%-49% | 50%-79% | >80% | 0.09 |
| Soil quality (I6-2) | Filtering of land for safety hazards based on current land use status | - | |||
| Sun shade (I7)5 (Winter solstice 6 h) | <33% | 33%-66% | >66% | Unobstructed | 0.12 |
| Irrigation source (I8) | Scoring sites based on ease of access to water and cost | 0.09 | |||
| Slope, shape (I9)6 | Gradient>10° >15° | Gradient ≤10° 6°-15° | Narrow flat roof 2°-6° | Square flat roof Plain | 0.08 |
| Usable area (I10)7 | <15 m2 | 15-100 m2 | 100-500 m2 | >500 m2 | 0.09 |
| Legal entitlement (I11) | Based on public or private property, individual or collective owners | - | |||
Note: Superscripts 1-7 in the table are explained in the text below. |
Table 4 Technical selection of suitable rooftops and idle land in Xuefu Street |
| Space | Short term development | Medium and long term development |
|---|---|---|
| Roof | 41258 m2 (Open-air agriculture, S1) | 102673 m2 (Hydroponic greenhouse, S2) |
| 31991 m2 (Photovoltaic power generation, S3) | 68212 m2 (Composite mode, S4) | |
| Idle land | 17031 m2 (Open-air agriculture S5) | |
| 10787 m2 (Composite mode S6) | ||
Note: Idle land does not need to distinguish between short term and medium and long term development. |
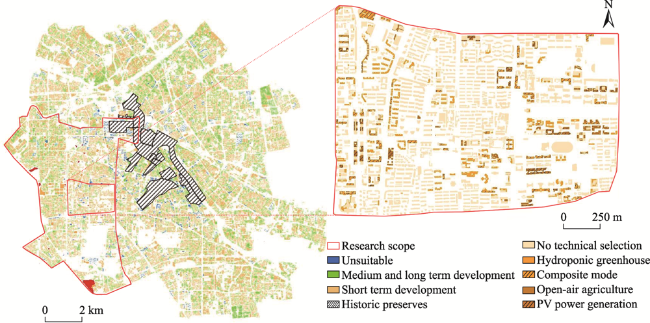
Fig. 4 Distribution of short, medium and long term and unsuitable spaces for the development of green production in Xuefu Street in Nankai District, Tianjin. |
Table 5 Methodology and results for estimating green production potential |
| Green production type | Formula for yield estimation of the actual production area | Annual production | |
|---|---|---|---|
| Agriculture | Open-air agriculture | ${{S}_{ua}}=S\times {{a}_{1}}$ | (S1+S5)×6=349734 kg S2×50=5133650 kg |
| Hydroponic greenhouse | |||
| Photovoltaics | Flat roof and idle land (Double pitched roof × 0.5) | ${{S}_{pv}}=\frac{S}{\text{cos}30{}^\circ }\times {{b}_{1}}\times 18.5%$ | 10.05×10⁶ kWh |
| Composite mode | Hydroponic greenhouse Thin film photovoltaics | ${{S}_{ua}}=S\times {{a}_{2}}$ ${{S}_{pv}}=\frac{S}{\text{cos}30{}^\circ }\times 25%\times {{b}_{2}}\times 10%$ | 3949950 kg 10.03×10⁶ kWh |
Note: where, Sua and Spv are the actual production areas; S is the available area for each production type in Table 3; an is the production per unit area of urban agriculture; and bn is the PV module generation per unit area. |
Table 6 Calculation of the green productive area equalization factors and land saving benefits |
| Type | Yield per ha | Conversion formula | Equilibrium factor (rj) | Land saving benefit (m2) |
|---|---|---|---|---|
| Open-air agriculture | 744 kg | ${{r}_{c}}=\frac{P}{35730}\times 2.19$ ${{r}_{f}}=\frac{P\times 0.66}{360000}\times 1.38$ | 0.05 | (S1+S5)×0.05=2914.45 |
| Hydroponic greenhouse | 10923 kg | 0.67 | S2×0.67=68790.91 | |
| PV power generation | 21383 kWh | 0.05 | S3×0.05=1599.55 | |
| Composite mode | 8404 kg 21340 kWh | 0.52 0.04 | (S4+S6)×0.56=44239.44 | |
| Total | - | - | 1.33 | 117544.35 |
Note: In the table, P is the yield per ha; and rc and rf are the equilibrium factor formulae for converting green production areas to cropland and forest land, respectively. Agricultural output (kg) uses the rc formula, and photovoltaic power generation (kWh) uses the rf formula. S1-S6 are the same as S1-S6 in Table 4. |
| [1] |
|
| [2] |
Department of Natural Resources. 2018. The Ministry of Natural Resources will improve the mechanism of “linking the increase and deposit of construction land”. www.gov.cn/xinwen/2018-08/01/content_5311052. htm. Viewed 15 Sep 2019. (in Chinese)
|
| [3] |
|
| [4] |
Editorial Committee of China Agricultural Yearbook. 2018. China agriculture yearbook 2017. Beijing, China: China Agricultural Press. (in Chinese)
|
| [5] |
|
| [6] |
FAO. 2019. Country data collection (China). www.fao.org/countryprofiles/index/en/?iso3=CHN. Viewed 12 Mar 2019.
|
| [7] |
Global Footprint Network. 2019. National footprint accounts 2019 edition (Data year 2016). http://data.footprintnetwork.org/#/countryTrends?cn= 351&type=BCpc, EFCpc. Viewed 1 Feb 2020.
|
| [8] |
|
| [9] |
|
| [10] |
|
| [11] |
|
| [12] |
IPCC. 2015. Climate change 2014:Mitigation of climate change. Contribution of Working Group III to the 5th assessment report of the intergovernmental panel on climate change. New York, USA: Cambridge University Press.
|
| [13] |
|
| [14] |
|
| [15] |
|
| [16] |
|
| [17] |
|
| [18] |
|
| [19] |
|
| [20] |
MHURD(Ministry of Housing and Urban-Rural Development). 2015. Statistical Bulletin of Urban and Rural Development in 2014. www.mohurd.gov.cn/xytj/tjzljsxytjgb/tjxxtjgb/201708/t20170818_232983. html. Viewed 15 Jun 2018 (in Chinese)
|
| [21] |
|
| [22] |
|
| [23] |
NBSC (National Bureau of Statistics of China). 2019a. China statistical yearbook 2019. Beijing, China: China Statistical Press. (in Chinese)
|
| [24] |
NBSC (National Bureau of Statistics of China). 2019b. Statistical communique of the People's Republic of China on the 2018 national economic and social development. Beijing, China: China Statistics Press.
|
| [25] |
|
| [26] |
|
| [27] |
|
| [28] |
|
| [29] |
|
| [30] |
|
| [31] |
|
| [32] |
|
| [33] |
|
| [34] |
|
| [35] |
|
| [36] |
The People's Government of Beijing Municipality. 2011. Opinions of the Beijing Municipal People's Government on promoting the construction of three-dimensional urban space greening. www.beijing.gov.cn/zhengce/zfwj/zfwj/szfwj/201905/t20190523_72625. html. Viewed 15 Jun 2018. (in Chinese)
|
| [37] |
UN-DESA,
|
| [38] |
|
| [39] |
|
| [40] |
|
| [41] |
|
| [42] |
|
| [43] |
|
| [44] |
|
| [45] |
|
| [46] |
|
/
| 〈 |
|
〉 |