
Journal of Resources and Ecology >
Assessing the Ecological Carrying Capacity of Countries along the Belt and Road
|
DU Wenpeng, E-mail: duwp.18b@igsnrr.ac.cn |
Received date: 2021-04-25
Accepted date: 2021-08-20
Online published: 2022-03-09
Supported by
The Strategic Priority Research Program, Chinese Academy of Sciences(XDA20010202)
The National Key Research and Development Program of China(2016YFC0503505)
The Belt and Road Initiative (B&R Initiative) is a crucial strategy to promote regional sustainable development in the new era. However, the realization of the B&R Initiative faces huge challenges because of the dual characteristics of a fragile eco-environment and strong dependence on ecological resources for economic development in the Belt and Road (B&R) countries. The ecological carrying capacity (ECC) is a crucial indicator for evaluating regional sustainable development. From the perspective of the relationship between the supply and consumption of ecological resources, this study uses net primary productivity data to measure the supply capacity of ecological resources, and it uses the agricultural production and trade data provided by the United Nations Food and Agriculture Organization to measure the level of ecological resource consumption. These supply and consumption data are then used to assess the ECC and ecological carrying status (ECS) of the B&R countries in 2017. The results show that: (1) The ECC of the B&R is 11.097 billion people; the ecosystem can also support 6.433 billion people, and the ECC is in a state of rich and surplus. (2) The ECS is polarized among the regions and countries along the B&R. Of the 65 countries, the ECC of 40 countries is in a rich and surplus state, mainly in Mid-East Europe and Southeast Asia, while the ECC of 19 countries is in severe overload, mainly in West Asia/Middle East. (3) Although the ecosystems still have ample carrying space in countries along the B&R, ecological protection is still facing enormous challenges during the implementation of the B&R Initiative combined with the internationally recognized ecological protection standards as well as the forecasts of the population and economic development. As the core content of building a new international trade network, the B&R Initiative will help to solve the spatial mismatch between the supply and consumption of ecological resources, which provides a new opportunity to coordinate the contradiction between the ecological protection and social demands of the B&R countries.
DU Wenpeng , YAN Huimin , FENG Zhiming , YANG Yanzhao . Assessing the Ecological Carrying Capacity of Countries along the Belt and Road[J]. Journal of Resources and Ecology, 2022 , 13(2) : 338 -346 . DOI: 10.5814/j.issn.1674-764x.2022.02.016
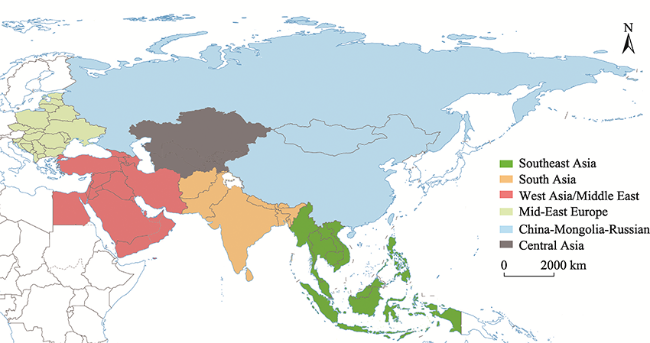
Fig. 1 The B&R countries and their zoning standards |
Table 1 The types and sources of data used in this study |
| Name | Resolution | Time-period | Source |
|---|---|---|---|
| Land use/cover change | 300 m | 2000-2017 | European Space Agency, CCI-LC |
| Gross Primary Production | 500 m | 2000-2017 | Vegetation Photosynthesis Model (Zhang et al., 2017) |
| Agriculture, forestry and animal husbandry production | Country | 2017 | Faostat Database |
| Agricultural, forestry and animal husbandry product trade | Country | 2017 | Faostat Database |
| Population | Country | 2017 | Word Bank Data |
| Land area | Country | 2017 | Word Bank Data |
Table 2 Classification standard table for ecological carrying status |
| Ecological Carrying Index (ECI) | <0.6 | 0.6-0.8 | 0.8-1.0 | 1.0-1.2 | 1.2-1.4 | >1.4 |
|---|---|---|---|---|---|---|
| Ecological Carrying Status (ECS) | Rich and surplus | Surplus | Balance | Critical overload | Overload | Severe overload |
Table 3 The ECC and ECC-UA of the B&R regions and their subregions in 2017 |
| Regions | ECC (×108 capita) | Population (×108 person)* | The proportion of ECC (%) | ECC-UA (capita km-2) |
|---|---|---|---|---|
| Southeast Asia | 31.29 | 6.48 | 28.20 | 720.86 |
| South Asia | 21.16 | 17.93 | 19.07 | 443.55 |
| West Asia/Middle East | 3.60 | 4.42 | 3.25 | 48.64 |
| Mid-East Europe | 9.23 | 1.76 | 8.32 | 434.54 |
| China-Mongolia-Russian | 44.06 | 15.34 | 39.71 | 161.29 |
| Central Asia | 1.62 | 0.71 | 1.46 | 41.20 |
| Total | 110.97 | 46.65 | 100.00 | 222.43 |
Note: * The data comes from the World Bank, 2017. |
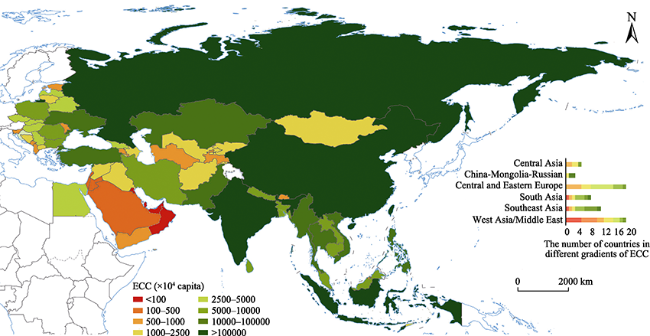
Fig. 2 The spatial distribution of the ECC of the B&R countries in 2017 |
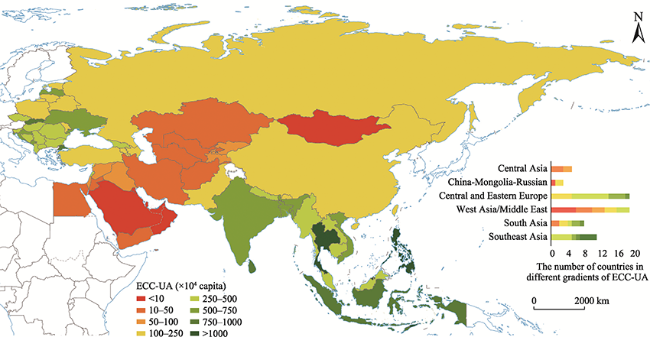
Fig. 3 The spatial distribution of the ECC-UA of the B&R countries in 2017 |
Table 4 The ECI and ECS of B&R regions and their subregions in 2017 |
| Regions | ECI | ECS |
|---|---|---|
| Southeast Asia | 0.21 | Rich and surplus |
| South Asia | 0.85 | Balance |
| West Asia/Middle East | 1.23 | Overload |
| Mid-East Europe | 0.19 | Rich and surplus |
| China-Mongolia-Russia | 0.35 | Rich and surplus |
| Central Asia | 0.44 | Rich and surplus |
| Total | 0.42 | Rich and surplus |
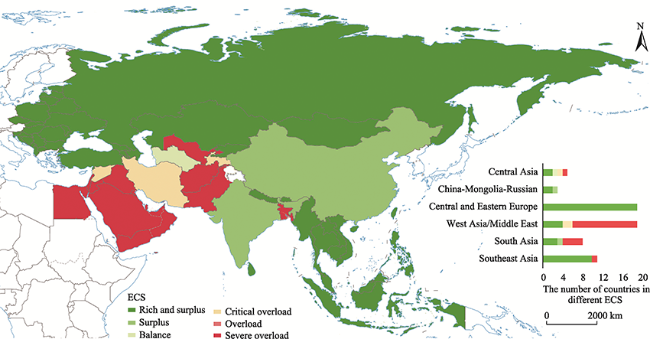
Fig. 4 The spatial distribution of the ECS of the B&R countries in 2017 |
| [1] |
|
| [2] |
|
| [3] |
|
| [4] |
|
| [5] |
|
| [6] |
|
| [7] |
|
| [8] |
|
| [9] |
|
| [10] |
|
| [11] |
|
| [12] |
|
| [13] |
|
| [14] |
|
| [15] |
|
| [16] |
|
| [17] |
|
| [18] |
|
| [19] |
|
| [20] |
|
| [21] |
|
| [22] |
|
| [23] |
|
| [24] |
|
| [25] |
|
| [26] |
|
| [27] |
|
| [28] |
|
| [29] |
|
| [30] |
|
| [31] |
|
| [32] |
|
| [33] |
|
| [34] |
|
| [35] |
|
| [36] |
|
| [37] |
|
| [38] |
|
| [39] |
|
| [40] |
|
| [41] |
|
| [42] |
|
| [43] |
|
| [44] |
|
/
| 〈 |
|
〉 |