Ecosystem in the Belt and Road Initiatives Region

Changes in the Ecological Characteristics of Key Biodiversity Areas in the BRI Region

  • WANG Boyu , 1, 2 ,
  • YAN Huimin , 1, 2, * ,
  • FENG Zhiming 1, 2 ,
  • YANG Yanzhao 1, 2
Expand
  • 1. Institute of Geographical Sciences and Natural Resources Research, Chinese Academy of Sciences, Beijing 100101, China
  • 2. University of Chinese Academy of Sciences, Beijing 100049, China
* YAN Huimin, E-mail:

WANG Boyu, E-mail:

Received date: 2021-04-23

  Accepted date: 2021-09-15

  Online published: 2022-03-09

Supported by

The Strategic Priority Research Program of the Chinese Academy of Sciences(XDA20010202)

The National Key Research and Development Program of China(2016YFC0503505)

Abstract

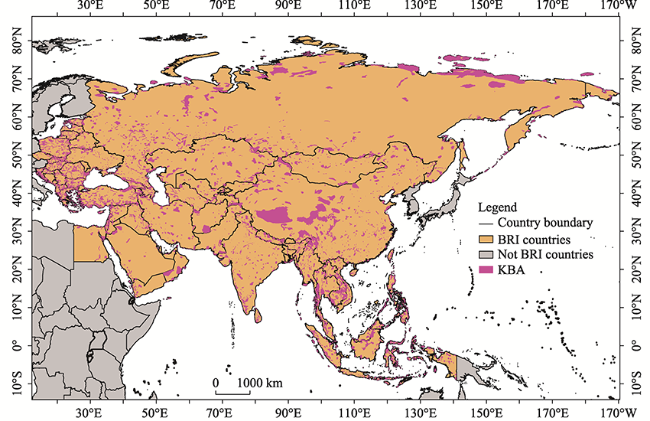
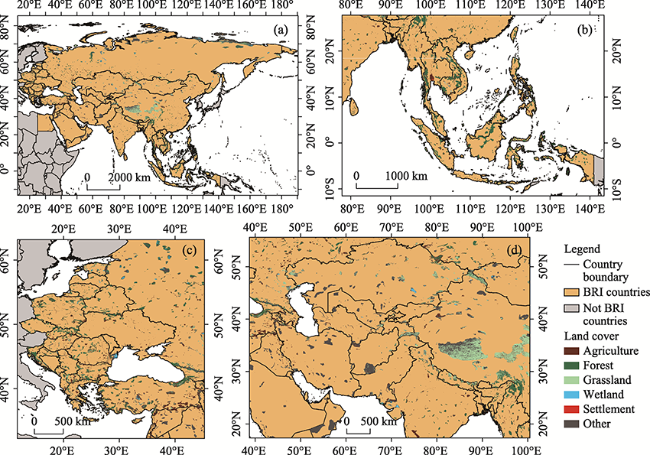
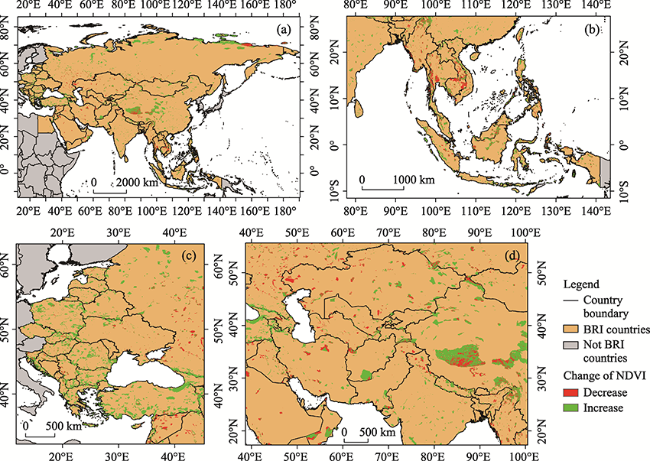
Key Biodiversity Areas (KBAs) are ecological conservation priorities proposed by IUCN and widely recognized by most countries. Evaluating the changes in the ecological characteristics in KBAs is important for biodiversity conservation and the construction of Protected Areas (PAs). There are various ecosystem types in the Belt and Road Initiative (BRI) region, which has an extremely high value of biodiversity conservation, and the KBAs should be the prime targets of ecological protection efforts. Using the data of land cover, NDVI and Nighttime Light (NTL), we analyzed the ecological conditions of the KBAs in the BRI region, and their temporal and spatial variations, from the perspectives of vegetation coverage and human activities. The conclusions are: (1) There is generally no significant difference in the land cover of the KBAs, among which forest, wilderness and grassland are the main types; (2) The NDVI of the KBAs showed an increase, indicating that the vegetation was gradually improving, while a few KBAs presenting vegetation degradation were mainly distributed in the Indochina Peninsula, Qinghai-Tibet Plateau and Central and Western Asia; and (3) The NTL in the KBAs was very low, indicating that the human pressure on the natural ecosystems was limited, and only a few KBAs distributed in Central and Eastern Europe, India, and the Indochina Peninsula have high human activity intensity which also showed an increase. This study emphasizes that we should make full use of the biome succession law, and limit the interference of human activities on natural ecosystems for ecological protection of the KBAs, so as to continuously make new breakthroughs in the construction of Protected Areas (PA) in the BRI region.

Cite this article

WANG Boyu , YAN Huimin , FENG Zhiming , YANG Yanzhao . Changes in the Ecological Characteristics of Key Biodiversity Areas in the BRI Region[J]. Journal of Resources and Ecology, 2022 , 13(2) : 328 -337 . DOI: 10.5814/j.issn.1674-764x.2022.02.015

1 Introduction

Unreasonable human activities have caused many adverse ecological and environmental consequences in recent years, including biodiversity loss, forest and grassland degradation, air and water pollution, etc., which pose serious threats to the stability of natural ecosystems and human survival and health (Delinom et al., 2009; Taniguchi et al., 2009; Wei et al., 2014; Wei and Qi, 2016; Zhang et al., 2017; Fuentes, 2018; Gosselin and Callois, 2018). The main goal of Protected Areas (PAs) is to limit the human interference on natural ecosystems and the environment, in order to maintain the stability of the ecosystems and high biodiversity, which are important for the welfare of human society (Nigel, 2008). Based on various ecological criteria, a series of “conservation priorities” have been identified worldwide, including Biodiversity Hotspots (BH), Crisis Ecoregions (CE), High Biodiversity Wildness Areas, etc. (Myers et al., 2000; Sanderson et al., 2002; Mittermeier et al., 2003; Hoekstra et al., 2005; Brooks et al., 2006; Donald et al., 2019a). These “conservation priorities” are undoubtedly the focus of ecological protection, and provide references for the designation of PAs.
The concept of Key Biodiversity Areas (KBAs), which was early put forward in 2004, includes the most extensive and comprehensive criteria covering three levels of gene, individual and ecosystem, and involves species, habitat, human activities and other aspects, so it is an agglomeration of all of the “conservation priorities” in existing studies (Eken et al., 2004). The KBA standard was officially approved in 2016, and it has been widely recognized by most countries and has become the most important reference when establishing new Protected Areas (PAs) (IUCN, 2020). Existing studies on KBAs mainly fall into two categories. The first category focuses on the identification criteria of KBAs. For example, Maxwell et al. emphasized the importance of the popularity of identification criteria through their interview and online questionnaire results (Maxwell et al., 2018), while Chen and Wu put forward specific suggestions for their application in China (Chen and Wu, 2019). Some researchers have also tried to use KBA criteria to identify the areas that should be protected (de Silva and Bass, 2011). Furthermore, some studies have pointed out the limitations of KBA criteria and discussed how to improve them. For example, Knight et al. argued that an overly prescriptive identification of important conservation features exists, along with inflexibility in dealing with landscape connectivity, and put forward corresponding suggestions (Knight et al., 2007), while Edgar and Brooks determined the absolute and percentage thresholds for KBA identification, which further improved the feasibility of the KBA criteria (Edgar and Brooks, 2011). The other category focuses on the spatial distribution of KBAs and PAs to measure their conservation effectiveness. Based specifically on the “Aichi Target 11”, some studies have calculated the area proportions of KBAs that are covered by PAs and other “conservation priorities”, to judge whether the “Aichi Target 11” has been achieved and evaluate the ecological conservation effectiveness (Xu et al., 2010; Wang et al., 2014; Li et al., 2015; Mallari et al., 2016; Donald et al., 2019b). However, few studies have considered the changes in the ecological characteristics of KBAs until now, which is very important for gaining a deep understanding of the basic conditions of KBAs and taking corresponding protection measures.
The region of the Belt and Road Initiative (BRI) has diverse geographical backgrounds, with a large variety of species and ecosystem types, making it extremely deserving of biodiversity conservation. Furthermore, human activities have caused many natural ecosystems to face great risk of ecological degradation, and some have even suffered severe deterioration and lost their original structure and functions. The high biodiversity conservation value and ecological degradation risk jointly indicate that ecological protection is always one of the most important tasks of the countries in the BRI region, which has also become the hotspot of relevant studies (Meng and Gao, 2019; Fan et al., 2020; Turschwell et al., 2020). Among the existing studies on ecological protection in the BRI region, some directly analyze the temporal and spatial variations of climate, topography, soil, hydrology and vegetation, and give some suggestions regarding physical regionalization, climate change response, green development assessment, ecological-social relationship coordination, and ecosystem services (Wu et al., 2018; Liu et al., 2019; Cheng and Ge, 2020; Xu et al., 2020; Zuo et al., 2020a). These studies focused on either the whole region on a national scale, or a specific ecosystem type or sub-region. In addition, some studies indirectly evaluated the changes in ecological characteristics from the perspective of human pressure on the ecosystems, based on either the ecological carrying capacity, ecological footprint, resilience or other indicators (Yang and Fan, 2019a, 2019b; Zhen et al., 2019; Chen et al., 2020; Zhang et al., 2020; Zuo et al., 2020b). These studies reflect the driving forces of ecological change. Although great progress has been made in ecological protection, no studies so far have paid attention to the changes in the ecological characteristics of the KBAs, although they are the most valuable conservation priorities and widely distributed in the BRI region. However, for the ecological protection of countries in the BRI region, focusing on the KBAs rather than the whole region will probably provide more useful guidance, because the KBA standard is the most important reference for the future PA designation. Therefore, it is necessary to investigate the changes in the ecological characteristics of the KBAs in the BRI region.
Taking the KBAs in the BRI region as the study area, this study analyzes the ecological condition, and its temporal and spatial variations, from the perspectives of the ecosystem itself and the human pressure on it, to explore the overall ecological protection level of KBAs in the recent past. Compared with the existing studies, the focus here is really on the areas with high ecological protection value and necessity through KBAs, and more ecological details are explored in these smaller spaces. At the same time, the ecological changes in the KBAs are analyzed directly and indirectly from the perspectives of the natural ecosystems and human activities, with the aim of providing more references for the future ecological conservation of the BRI region.

2 Materials and methods

2.1 Study area

As a top-level national cooperation initiative, the Belt and Road Initiative (BRI) was proposed by China in 2013. According to China Economic Information Network Database, there are 64 countries in the BRI region, most of which are developing countries, covering Asia, Europe and Africa, with a total area of over 5.4×10⁷ km2 and a population of about 4.665 billion people (China Economic Information Network, 2020). There are differences among the climate, topography, soil, hydrology and vegetation of each sub-region, resulting in a large variety of ecosystem types, including forests, grasslands and wetlands with high biodiversity and a strong capacity to provide ecosystem services, in addition to desertification land with fragile ecosystems and great degradation risk. Therefore, a large number of KBAs are distributed in the BRI region, with a total area of 4.33×10⁶ km2, accounting for about 10% of the whole region, which fully reflects the high ecological protection value (Fig. 1). In this study, we explore the changes in the ecological characteristics of the KBAs in the BRI region.
Fig. 1 The KBAs in the BRI region

2.2 Data and methods

Land cover is an overall reflection of the regional ecological condition, as the combination of different land cover types reflects the area proportion and spatial distribution of each ecosystem type. Forest, grassland and wetland correspond to natural ecosystems, while settlement and cropland indicate ecosystems mainly controlled by human beings. Therefore, we first need to acquire a basic understanding through land cover information. Based on that, we further analyzed the changes in the ecological characteristics from the perspectives of both the ecosystem itself and the human pressure on it, specifically focusing on vegetation coverage and human activity intensity. Vegetation coverage is a direct and informative indicator of natural ecosystem health, which is usually measured by Normalized Difference Vegetation Index (NDVI) in existing studies, and can reflect the integrity and stability of natural ecosystems and also evaluate the effectiveness of ecological restoration (Ding et al., 2015; Zhang et al., 2015; Liu et al., 2016). Human activities have been significantly transforming the natural landscapes in the past decades, and have gradually become the major driving force and also an indirect reflection of the ecological changes. In comparison with population density, Nighttime Light (NTL) is adopted as the indicator of the pressure of human activities on the natural ecosystems, so in this study we also chose NTL to measure the human activity intensity more accurately and comprehensively (Shi et al., 2018; Zhao et al., 2020).
(1) Land cover. We used the CCI-LC data from the European Space Agency with a spatial resolution of 300 m. We calculated the area proportions of agriculture, forest, grassland, wetland, settlement and other (wilderness), and analyzed their spatial distribution characteristics.
(2) NDVI. We used the MODIS NDVI products released by NASA from 2000 to 2015 with a spatial resolution of 5 km. We extracted the NDVI inside the KBAs in ArcGIS, and calculated the average of 23 images per year. We then used a linear regression method to analyze the temporal variations of NDVI, and compared the distributions of NDVI in 2000 and 2015 to analyze the spatial variations.
(3) NTL. We chose the DMSP-OLS Nighttime Lights data (version 4) from 2000 to 2013 with a spatial resolution of 1 km, and used the NPP/VIRRS data from 2011 to 2015 to supplement the time series. We reclassified the NPP/VIRRS data to the spatial resolution of 1 km, and extracted the relevant data using the mask of the DMSP-OLS data. Then, a pixel-by-pixel regression was performed on the two groups, and based on that, we finally acquired the data of 2014 and 2015. The NTL values are between 0 and 63, and the higher the value, the greater the human activity intensity, which means that the human pressure on the natural ecosystems is higher. The NTL processing is consistent with NDVI, which aims to reveal the overall situation of the human activities in the KBAs.

3 Results

3.1 Land cover

The land cover in the KBAs of the BRI region remained stable in general, and there were no obvious fluctuations for any of the land cover types, except for settlement. Wilderness and forest are the two main land cover types in the KBAs of the BRI region, with proportions of more than 30% (Fig. 2a). Specifically, the forests are located much more in Southeast Asia and the European countries controlled by a Mediterranean climate, tropical rainforest climate or monsoon climate, with abundant precipitation and suitable sunlight (Fig. 2b; Fig. 2c). Central and West Asia and Northwest China are where the wilderness mainly exists, as most of them are typical arid areas with limited precipitation and strong evaporation, making the vegetation coverage very low (Fig. 2d). Grassland and agriculture have similar proportions in the KBAs, and the former is mainly distributed in Qinghai-Tibet Plateau and Central Asia, while the latter is in the European countries and Mesopotamia plain, where there is a rich agricultural production history and excellent basic conditions for agriculture (Fig. 2c; Fig. 2d). The proportions of wetland and settlement in the KBAs are far lower than those of other land cover types, and each of them shows a scattered distribution (Fig. 2a). Therefore, the natural land cover types have obvious advantages in KBAs, which means that the human activity intensity in the KBAs is generally at a low level. In addition, the land cover in KBAs can also effectively reflect the geographical conditions and the main ecosystem types in each sub-region.
Fig. 2 Land cover in the KBAs in (a) the whole BRI region and important sub-regions; (b) Southeast Asia; (c) Central and Eastern Europe; and (d) Central and Western Asia and Northwest China.

3.2 Vegetation coverage (NDVI)

The NDVI in the KBAs of the BRI region showed a significant increase (P < 0.0001), indicating that the vegetation coverage in the KBAs increased during this period (Fig. 3). Vegetation coverage is a direct reflection of ecosystem quality, so its increase means that the ecosystem structure tends to be complete and the function tends to be optimized. The NDVI values of the KBAs in Southeast Asia, Central and Eastern Europe and Eastern China were higher (>0.6), while the values in the Qinghai-Tibet Plateau and Central and Western Asia were lower (<0.4), corresponding to the land cover in the KBAs (Fig. S1). The KBAs with higher NDVI are mainly forests, the highest stage of natural succession, where the vegetation coverage is at a higher level; in comparison, the vegetation coverage in the KBAs dominated by wilderness and grassland was lower. Therefore, the vegetation in the KBAs is closely related to the land cover and ecosystem types they contain.
Fig. 3 Temporal variations of NDVI and NTL of the KBAs in the BRI region
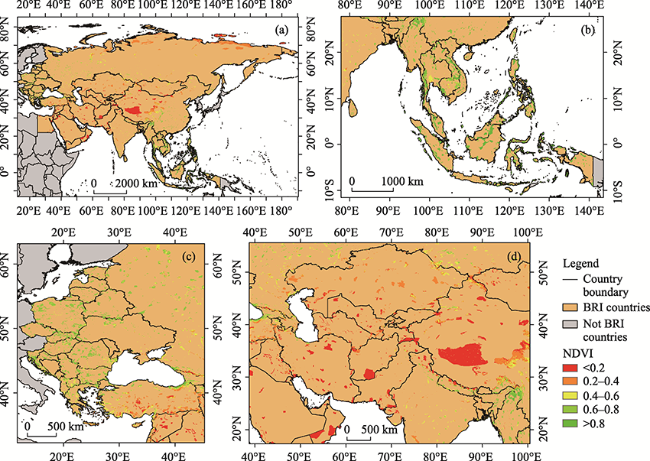
Fig. S1 NDVI in the (a) whole BRI region and important sub-regions: (b) Southeast Asia; (c) Central and Eastern Europe; (d) Central and Western Asia and Northwest China.
The majority of KBAs showed an increase in NDVI, indicating that vegetation improvement is the main trend (Fig. 4a). This is probably because there are not excessive human activities in the KBAs of the BRI region, and some of them have also been designated as PAs, where there are strict management measures to limit human activities in order to maintain the original state of the natural ecosystems. Without human interference, each biome will evolve in the direction of a more intact structure, function and stability, which is the inherent law of nature. Therefore, although the geographical background conditions of the KBAs in the BRI region are different, the vegetation coverage is gradually improving. Moreover, as a land cover type created by human beings, agriculture also contributes to the increase of NDVI. In different sub-regions, however, the NDVI in KBAs showed different trends. Specifically, the NDVI showed an increase in most of the KBAs in European countries, while in some KBAs in the Indochina Peninsula, Qinghai-Tibet Plateau and Central and West Asia, the NDVI showed a decrease, which was mainly due to the unreasonable human activities causing the destruction of vegetation (Fig. 4b; Fig. 4c; Fig. 4d).
Fig. 4 NDVI changes in the KBAs in (a) the whole BRI region and important sub-regions; (b) Southeast Asia; (c) Central and Eastern Europe; and (d) Central and Western Asia and Northwest China.

3.3 Human activities (NTL)

The NTL of the KBAs in the BRI region also showed an increase (P=0.0015), indicating that the human activity intensity in the KBAs increased slightly (Fig. 3). But in general, the human pressure on natural ecosystems in the KBAs is still at a very low level, which is consistent with the result above that the proportion of settlement in the KBAs is very low. In terms of spatial distribution, most KBAs have very low NTL values, and only a few in Central and Eastern Europe, India and the Indochina Peninsula have very high NTL values, where the relevant countries have either a large population, or strong economic power and active social production (Fig. S2). The human activity intensity in the KBAs reflects the overall situation in the sub-region where they are located.
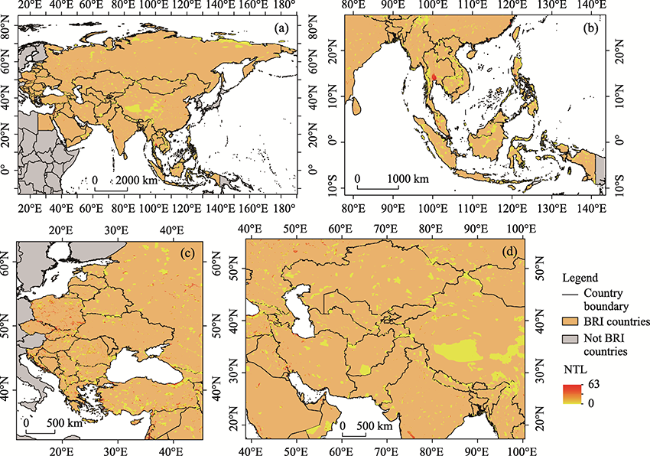
Fig. S2 NTL in the (a) whole BRI region and important sub-regions: (b) Southeast Asia; (c) Central and Eastern Europe; (d) Central and Western Asia and Northwest China.
Temporally, the NTL of most of the KBAs in the BRI region have remained unchanged in this time period, indicating that the human activities are always stable in general (Fig. 5a). The KBAs with increasing NTL are only distributed in India, the Indochina Peninsula and Central and Eastern Europe, where the human activity intensity is always at a high level, which means that the KBAs in the BRI region represent a polarization in human activities (Fig. 5b; Fig. 5c; Fig. 5d). In the future ecological protection in the BRI region, these KBAs with intense human activities are undoubtedly the objects that should be focused on, in order to reduce the possibility of ecosystem destruction caused by unreasonable human activities through the reasonable management of the human activities.
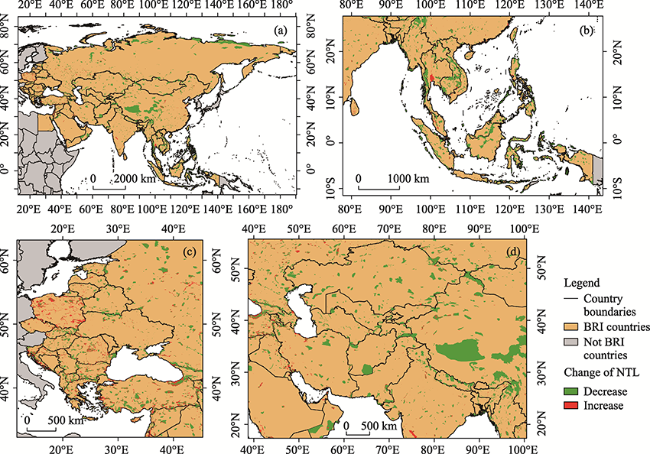
Fig. 5 NTL changes in the KBAs in (a) the whole BRI region and important sub-regions; (b) Southeast Asia; (c) Central and Eastern Europe; and (d) Central and Western Asia and Northwest China.

4 Discussion

There is a wide variety of species and ecosystem types in the BRI region, making it extremely deserving of biodiversity conservation. China’s government put forward the guidance on Green BRI construction in 2017, emphasizing the importance of ecological protection. As a result, ecological protection has become an important theme of cooperation among the various countries in the BRI region. However, most countries in the BRI region are developing countries in the process of rapid industrialization and urbanization, which are bound to cause great pressure on the natural resources and ecosystems. Coordinating the relationship between economic growth and ecological protection is significant for the countries in the BRI region, since industrialization and urbanization should not cause severe damage to the ecosystems and environment, and at the same time, ecological protection should not hinder economic growth. China’s government has proposed to clarify the main functions of each sub-region in the territory, and simultaneously designate and optimize the production, living and ecological spaces, which represents an effective exploration of coordinating socio-economic growth and ecological protection (Fan, 2015; Liu et al., 2017). As a global standard defined by a series of scientific indicators and recognized by the IUCN and most countries, KBAs are the priorities of ecological protection, which provides important guidance for PA designation. Taking conservation and management measures for KBAs can effectively protect biodiversity on the basis of minimum ecological space, so as to provide sufficient space for human production and living activities in order to improve the regional economic and social development. Therefore, the accurate identification and appropriate protection measures for KBAs provide the best way for future ecological protection and PA construction in the countries of the BRI region, and are also the important premise for high-quality and sustainable development.
Additionally, the dominant land cover and ecosystem types in the KBAs will not change easily due to their natural climatic backgrounds. Therefore, the ecological protection for KBAs should be fully based on the geographical background, and making significant changes to the land cover inside KBAs and consequently causing further damage to the ecosystems and environment must be avoided. For example, in the Loess Plateau of China, the local government used to plant many trees for vegetation restoration, but the local temperature and precipitation cannot meet the needs of the growth of such trees, resulting in the serious deterioration of the soil moisture conditions (Zhao et al., 2003; Yang et al., 2012). Therefore, the core of ecological protection for KBAs should be continuously improving and optimizing the structure and function of the dominant ecosystems, which means that we should make full use of biome succession to gradually enhance the ecosystem stability and its capacity to provide services, rather than making adjustments that are not suitable for the local geographical background. Furthermore, for those KBAs with increasing human activities, strict measures must be taken to effectively restrict the human activities, so that the ecological condition can be gradually restored without human interference.

5 Conclusions

There are many KBAs with high ecological protection value in the BRI region, and preserving their good ecological condition is very important for regional sustainable development. Through the analysis of the temporal and spatial variations of land cover, NDVI and NTL in the KBAs of the BRI region, three main conclusions are obtained.
(1) There is generally no significant difference in the land cover of the KBAs, among which forest, wilderness and grassland are the main types. The land cover in the KBAs depends largely on the geographical background of the sub-region they are located in and will not change easily.
(2) The NDVI in the KBAs showed an increase in general, indicating that the vegetation was gradually improving, while the few KBAs presenting vegetation degradation were mainly distributed in the Indochina Peninsula, Qinghai-Tibet Plateau and Western Asia.
(3) The overall NTL in the KBAs was very low, indicating that the human pressure on the natural ecosystems was limited, and only a few KBAs distributed in Central and Eastern Europe, India, the Indochina Peninsula have high human activity intensity which also showed an increase.
[1]
Brooks T M, Mittermeier R A, Fonseca G A B, et al. 2006. Global biodiversity conservation priorities. Science, 313(5783): 58-61.

DOI PMID

[2]
Chen H, Wu J Y. 2019. A global standard for the identification of key biodiversity areas and recommendations on China’s practice. Journal of Ecology and Rural Environment, 35(2): 145-150. (in Chinese)

[3]
Chen X P, Liu Q Y, Fang K, et al. 2020. Tracking national sustainability of critical natural capital and the socioeconomic drivers in the context of the Belt and Road Initiative. Ecological Indicators, 114: 106315. DOI: 10.1016/j.ecolind.2020.106315.

DOI

[4]
Cheng C Y, Ge C Z. 2020. Green development assessment for countries along the Belt and Road. Journal of Environmental Management, 263: 110344. DOI: 10.1016/j.jenvman.2020.110344.

DOI

[5]
China Economic Information Network. 2020. Database for the Belt and Road. https://ydyl.cei.cn2020-06-11]

[6]
de Silva N, Bass D K. 2011. Nesting conservation priorities by geographic scale: Preliminary lessons from the application of percent thresholds to the identification of Key Biodiversity Areas for Marine Turtles in Melanesia. Animal Conservation, 14(1): 16-17.

DOI

[7]
Delinom R M, Assegaf A, Abidin H Z, et al. 2009. The contribution of human activities to subsurface environment degradation in Greater Jakarta Area, Indonesia. Science of the Total Environment, 407(9): 3129-3141.

DOI PMID

[8]
Ding M J, Chen Q, Xin L J, et al. 2015. Spatial and temporal variations of multiple cropping index in China based on SPOT-NDVI during 1999-2013. Acta Geographica Sinica, 70(7): 1080-1090. (in Chinese)

[9]
Donald P F, Buchanan G M, Balmford A, et al. 2019b. The prevalence, characteristics and effectiveness of Aichi Target 11’s “other effective area-based conservation measures” (OECMs) in Key Biodiversity Areas. Conservation Letters, 12(5): e12659. DOI: 10.1111/conl.12659.

DOI

[10]
Donald P F, Fishpool L D C, Ajagbe A, et al. 2019a. Important Bird and Biodiversity Areas (IBAs): The development and characteristics of a global inventory of key sites for biodiversity. Bird Conservation International, 29(2): 177-198.

DOI

[11]
Edgar G J, Brooks T M. 2011. Testing absolute and percentage thresholds in the identification of key biodiversity areas. Animal Conservation, 14(1): 12-13.

DOI

[12]
Eken G, Bennun L, Brooks T M, et al. 2004. Key biodiversity areas as site conservation targets. BioScience, 54(12): 1110-1118.

DOI

[13]
Fan J. 2015. Draft of major function oriented zoning of China. Acta Geographica Sinica, 70(2): 186-201. (in Chinese)

[14]
Fan P F, Yang L, Liu Y, et al. 2020. Build up conservation research capacity in China for biodiversity governance. Nature Ecology & Evolution, 4(9): 1162-1167.

[15]
Fuentes M. 2018. Trends of biodiversity and species richness at local and global scales. Biological Conservation, 222: 286. DOI: 10.1016/j.biocon.2018.03.032.

DOI

[16]
Gosselin F, Callois J M. 2018. Relationships between human activity and biodiversity in Europe at the national scale: Spatial density of human activity as a core driver of biodiversity erosion. Ecological Indicators, 90: 356-365.

DOI

[17]
Hoekstra J M, Boucher T M, Ricketts T H, et al. 2005. Confronting a biome crisis: Global disparities of habitat loss and protection. Ecology Letters, 8(1): 23-29.

DOI

[18]
International Union for Conservation of Nature (IUCN). 2020. A global standard for the identification of key biodiversity areas, Version 1.0. http://www.keybiodiversityareas.org2020-04-10]

[19]
Knight A T, Smith R J, Cowling R M, et al. 2007. Improving the key biodiversity areas approach for effective conservation planning. BioScience, 57(3): 256-261.

DOI

[20]
Li Y Q, Lu C X, Deng O, et al. 2015. Ecological characteristics of China’s key ecological function areas. Journal of Resources and Ecology, 6(6): 427-433.

DOI

[21]
Liu J L, Liu Y S, Li Y R. 2017. Classification evaluation and spatial-temporal analysis of “production-living-ecological” spaces in China. Acta Geographica Sinica, 72(7): 1290-1304. (in Chinese)

[22]
Liu Y X, Zhao W W, Hua T, et al. 2019. Slower vegetation greening faced faster social development on the landscape of the Belt and Road region. Science of the Total Environment, 697:134103. DOI: 10.1016/j.scitotenv.2019.134103.

DOI

[23]
Liu Y, Li C Z, Liu Z H, et al. 2016. Assessment of spatio-temporal variations in vegetation cover in Xinjiang from 1982 to 2013 based on GIMMS-NDVI. Acta Ecologica Sinica, 36(19): 6198-6208. (in Chinese)

[24]
Mallari N A D, Collar N J, McGowan P J K, et al. 2016. Philippine protected areas are not meeting the biodiversity coverage and management effectiveness requirements of Aichi Target 11. AMBIO, 45(3): 313-322.

DOI

[25]
Maxwell J, Allen S, Brooks T, et al. 2018. Engaging end-users to inform the development of the global standard for the identification of key biodiversity areas. Environmental Science & Policy, 89: 273-282.

[26]
Meng H H, Gao X Y. 2019. Global biodiversity and conservation along the Belt and Road Initiative. Bulletin of the Chinese Academy of Sciences, 34(7): 818-826. (in Chinese)

[27]
Ministry of Ecology and Environment of the People’s Republic of China. 2017. Guidance on putting forward the green Belt and Road Initiative. http://www.mee.gov.cn2017-04-26]

[28]
Mittermeier R A, Mittermeier C G, Brooks T M, et al. 2003. Wilderness and biodiversity conservation. Proceedings of the National Academy of Sciences of the USA, 100(18): 10309-10313.

DOI

[29]
Myers N, Mittermeier R A, Mittermeier C G, et al. 2000. Biodiversity hotspots for conservation priorities. Nature, 403(6772): 853-858.

DOI

[30]
Nigel D. 2008. Guidelines for applying protected area management categories. Gland, Switzerland: International Union for Conservation of Nature (IUCN).

[31]
Sanderson E W, Jaiteh M, Levy M A, et al. 2002. The human footprint and the last of the wild. BioScience, 52(10): 891-904.

DOI

[32]
Shi K F, Huang C, Chen Y, et al. 2018. Remotely sensed nighttime lights reveal increasing human activities in protected areas of China mainland. Remote Sensing Letters, 9(5): 468-477.

[33]
Taniguchi M, Burnett W C, Ness G. 2009. Human impacts on urban subsurface environments. Science of the Total Environment, 407(9): 2073-2074.

[34]
Turschwell M P, Brown C J, Pearson R M, et al. 2020. China’s Belt and Road Initiative: Conservation opportunities for threatened marine species and habitats. Marine Policy, 112: 103791. DOI: 10.1016/j.marpol.2019.103791.

DOI

[35]
Wang W J, Zheng H, Xu C, et al. 2014. Spatial correlation and ecological characteristics analysis of management area for biodiversity conservation and relevant regionalization. Chinese Geographical Science, 24(1): 71-82.

DOI

[36]
Wei F W, Nie Y G, Miao H X, et al. 2014. Advancements of the researches on biodiversity loss mechanisms. Science China Bulletin, 59(6): 430-437. (in Chinese)

[37]
Wei H L, Qi Y J. 2016. Analysis of grassland degradation of the Tibet Plateau and human driving forces based on remote sensing. Pratacultural Science, 33(12): 2576-2586. (in Chinese)

[38]
Wu S H, Liu L L, Liu Y H, et al. 2018. Geographical patterns and environmental change risks in terrestrial areas of the Belt and Road. Acta Geographica Sinica, 73(7): 1214-1225. (in Chinese)

[39]
Xu W H, Ouyang Z Y, Zhang L, et al. 2010. Spatial distribution and priority areas analysis for key protection species in Yangtze Basin. Research of Environmental Sciences, 23(2): 312-319. (in Chinese)

[40]
Xu X L, Li J H, Shen Z C, et al. 2020. Vulnerability of farmland ecosystems in countries along the “Belt and Road” and responses to climate change. Journal of Geo-information Science, 22(4): 877-886. (in Chinese)

[41]
Yang L, Wei W, Chen L D, et al. 2012. Soil desiccation in deep soil layers under different vegetation types in the semi-arid loess hilly region. Geographical Research, 31(1): 71-81. (in Chinese)

[42]
Yang Y, Fan M D. 2019a. Analysis of spatial and temporal differences and equity of ecological footprints of provinces along the Silk Road Economic Belt in China. Acta Ecologica Sinica, 39(14): 5040-5050. (in Chinese)

[43]
Yang Y, Fan M D. 2019b. Analysis of the spatial-temporal differences and fairness of the regional energy ecological footprint of the Silk Road Economic Belt (China Section). Journal of Cleaner Production, 215: 1246-1261.

DOI

[44]
Zhang J H, Feng Z M, Jiang L G, et al. 2015. Analysis of the correlation between NDVI and climate factors in the Lancang River Basin. Journal of Natural Resources, 30(9): 1425-1435. (in Chinese)

[45]
Zhang S, Zhang F, Wang C X, et al. 2020. Assessing the resilience of the Belt and Road countries and its spatial heterogeneity: A comprehensive approach. PloS One, 15(9): e0238475. DOI: 10.1371/journal.pone.0238475.

DOI

[46]
Zhang Y, Zhang C B, Wang Z Q, et al. 2017. Quantitative assessment of relative roles of climate change and human activities on grassland net primary productivity in the Three-River Source Region, China. Acta Prataculturae Sinica, 26(5): 1-14. (in Chinese)

[47]
Zhao J B, Hou Y J, Huang C C. 2003. Causes and countermeasures of soil drying under artificial forest on the Loess Plateau in northern Shaanxi. Journal of Desert Research, 6: 9-12. (in Chinese)

[48]
Zhao Z X, Zhang Y J, Pan Y, et al. 2020. Changes in human activity intensity and influence on ecosystem regulating services: A study of Tibet based on night light data. Journal of Geo-information Science, 22(7): 1544-1554. (in Chinese)

[49]
Zhen L, Xu Z R, Zhao Y, et al. 2019. Ecological carrying capacity and green development in the Belt and Road Initiative Region. Journal of Resources and Ecology, 10(6): 569-573.

DOI

[50]
Zuo Q T, Diao Y X, Hao L G, et al. 2020a. Comprehensive evaluation of the human-water harmony relationship in countries along the “Belt and Road”. Water Resources Management, 34(13): 4019-4035.

DOI

[51]
Zuo Q T, Li X, Hao L G, et al. 2020b. Spatiotemporal evolution of land-use and ecosystem services valuation in the Belt and Road Initiative. Sustainability, 12(16): 6583. DOI: 10.3390/su12166583.

DOI

Outlines

/