Urban Ecosystem

Simulating the Impacts of the New-type Urbanization Policy on Rural Settlement Changes: A Case Study in Dingzhou, China

  • GUO Jie , 1, 2 ,
  • SONG Wei , 2, * ,
  • GUO Liyu 1 ,
  • ZHANG Yuling 3
Expand
  • 1. College of Geomatics, Xi’an University of Science and Technology, Xi’an 710054, China
  • 2. Key Laboratory of Land Surface Pattern and Simulation, Institute of Geographic Sciences and Natural Resources Research, Chinese Academy of Sciences, Beijing 100101, China
  • 3. Laoshan District Bureau of Agriculture and Rural Affairs of Qingdao City, Qingdao, Shandong 266061 China
* SONG Wei, E-mail:

GUO Jie, E-mail:

Received date: 2020-12-22

  Accepted date: 2021-06-15

  Online published: 2022-03-09

Supported by

The National Natural Science Foundation of China(41771576)

Abstract

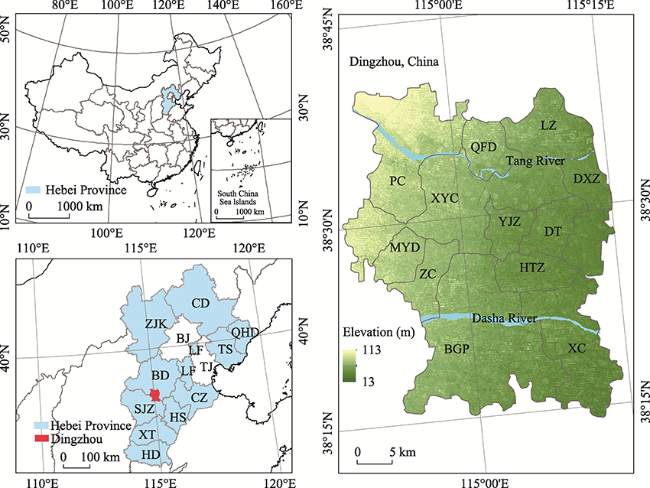
To cope with the difficulties of integrating migrant workers into urban life and inefficient land use caused by conventional urbanization, China has proposed a new type of urbanization policy. This policy may have a significant impact on the spatial patterns of rural settlements in China. Exploring this potential impact is conducive to the proposal of scientific plans for the spatial patterns of rural settlements. Therefore, this paper chooses Dingzhou, one of the pilot cities of this new-type urbanization, as the research area to carry out a simulation study on the impact of the new-type urbanization policy. Dingzhou has invested heavily in the new-type urbanization construction in recent years, but the influence of the policy on rural settlements remains unclear. Based on the theoretical framework of previous studies, this paper set up three scenarios, namely “conventional urbanization”, “new-type urbanization”, and “counter-urbanization”. This paper used FLUS (Future Land Use Simulation) Model and various spatial data to simulate the spatial patterns of rural settlements in Dingzhou in 2030 under the different scenarios. By comparing the different scenarios, the impacts of the new-type urbanization policy on the spatial patterns of rural settlements in Dingzhou were evaluated. The results indicated that: (1) From 2000 to 2015, the area of rural settlements in Dingzhou increased by 11.12%. Spatially, the density of rural settlements around the cities and towns increased, and rural settlement areas were mainly converted from cultivated land. Rural settlements were mainly transformed into urban land and cultivated land. (2) The overall simulation accuracy of FLUS was 0.89, so it can be well applied to the simulation of rural settlements. (3) In all three scenarios, rural settlements expanded along their edges, and the closer they were to towns, the more obvious the expansion was. In the counter-urbanization scenario, the change of rural settlements was most dramatic. (4) The new-type urbanization policy makes the spatial patterns of rural settlements in Dingzhou more stable and more intensive.

Cite this article

GUO Jie , SONG Wei , GUO Liyu , ZHANG Yuling . Simulating the Impacts of the New-type Urbanization Policy on Rural Settlement Changes: A Case Study in Dingzhou, China[J]. Journal of Resources and Ecology, 2022 , 13(2) : 285 -298 . DOI: 10.5814/j.issn.1674-764x.2022.02.011

1 Introduction

Since the reform and opening-up of China in 1978, the country’s urbanization process can be roughly divided into two stages, namely conventional urbanization and new-type urbanization. Under conventional urbanization, heavy industry and large cities were developed mainly under the leading role of the government. In this stage, the rural area greatly contributed to urban development, albeit under strict control. With the promotion of urbanization in China, the country’s national economy, the residents’ living standards and employment conditions, the social structure reform, and other aspects have rapidly developed and gained remarkable achievements. However, at the same time, conventional urbanization has also been linked to issues such as unrea sonable land use, waste of cultivated land resources, unavailability of urban basic public services for rural migrant workers, and a wider gap between urban and rural areas, among others. Of these, the first two are caused by the extensive expansion of construction land, land transfer, and land mortgage. The unavailability of urban basic public services for rural migrant workers can be attributed to the divided urban-rural household registration system of China. The modern household registration system is a legal system for China to collect, confirm and register basic information of the citizens. It can be divided into two categories according to blood inheritance and geographical location, namely urban household registration and rural household registration. The household registration system had played a positive role in the early times of China’s foundation, but because of its hierarchical nature, disputes arose, impeding further social development. In addition, the household registration system prevents rural migrant workers from accessing urban basic public services such as education, employment, medical care, pensions, and housing, which means that their integration into the cities is impeded (XNA, 2014).
In this context, China’s urbanization and household registration system needs to be transformed. Against this background, China put forward the “New-type Urbanization Policy” and published the “National New-type Urbanization Plan (2014-2020)” (hereinafter referred to as the “Plan”) (XNA, 2014). The Plan mainly introduced the background, objectives, planning, and implementation of the new-type urbanization policy in detail, with the aim of promoting the rights of the rural migrant population, optimizing the layout of urban and town areas, improving the sustainable development capacity of cities, promoting the integration of urban development and rural development, and reforming and improving the system of urbanization development (population management, land management, urban housing, ecological environment, etc.). Conventional urbanization mainly focuses on the expansion and construction of large cities, whereas the new-type urbanization focuses on small and medium-sized towns and villages and pays more attention to the quality of urban development. The rapid development of urban and industrial areas in China not only leads to the development and change of various social and economic factors, but also to changes in rural regional spatial patterns, which requires local agents to make active and timely adjustments (Long, 2014). New-type urbanization largely differs from conventional urbanization, and the spatial patterns of rural settlements under the new-type urbanization policy are therefore different from those of conventional urbanization. In this sense, it is necessary to study and forecast the long-term changes and future development of rural settlements.
Since the implementation of the new-type urbanization policy involves the transfer of agricultural population to cities, urban spatial distribution, and other issues, it is bound to have a profound impact on the spatial patterns of rural settlements. There are various types of changes which can occur in the scale of rural settlements, including expansion, merger, reduction, and extinction. One of the main problems facing China’s urbanization is that while the rural population is decreasing, the area of rural settlement is expanding. In recent years, seven regions of China (Northeast China, North China, Central China, East China, South China, Northwest China, and Southwest China) have experienced rural settlement extension (Song and Liu, 2014; Song et al., 2014; Liu et al., 2017; Gong et al., 2019; Zhang et al., 2019; Cui et al., 2020; Ouyang, 2020; Ren and Wu, 2021), including expansion along a certain directional axis (Zhang et al., 2019) and expansion around the edge (Song et al., 2014; Shi et al., 2016). In Tongzhou District, Beijing, China, the rural settlement area increased by 51.54% and 79.91% in the two time periods from 1972 to 1991 and from 1991 to 2015 (Li and Song, 2019). From 1985 to 2010, the settlement area in conventional rural areas in China’s Bohai Rim (including Beijing, Tianjin, Hebei, Shandong, and Liaoning) increased (Yang et al., 2015). From 1990 to 2006, large amounts of cultivated land were occupied by rural settlements in Suzhou, Wuxi, and Changzhou (Su-Xi-Chang area) in Jiangsu Province. During 1990 to 1995, the area of rural settlement of Su-Xi-Chang increased by 41.23% (Long et al., 2009). The spatial evolution of rural settlements in recent years shows certain obvious characteristics (Song and Liu, 2014; Shi et al., 2016; Li et al., 2017; Wang, 2017; Gong et al., 2019; Zhang et al., 2019; Cui et al., 2020; Ouyang, 2020; Ren and Wu, 2021). For example, most rural settlements show clear agglomeration characteristics, including shifting to urban centers (Cui et al., 2020; Ouyang, 2020) and gathering into areas with superior topographical conditions (Zhang et al., 2019). Generally, the rural settlement areas around cities and towns have changed drastically (Ouyang, 2020), and the expansion of some rural settlements and towns occurred at the cost of occupying high-quality and fertile arable land (Gong et al., 2019; Li and Song, 2020).
The simulation of rural settlement development in different periods and under different scenarios is an important direction in rural settlement research, along with the simulation of the impacts of land planning and land protection policies on land use. The CLUE-S (Conversion of Land Use and its Effects at Small Region Extent) software and agent-based models are mainly used for land use simulation. For example, some scholars have used a agent-based model called SimFeodal to simulate European rural settlement in 1200 AD and found that the concentration and level of European rural settlements at that time were quite different, with rural settlements having undergone a change from being scattered to concentrated, and they concluded that population data can increase the accuracy of simulation experiments (Tannier et al., 2020). Some researchers have used CLUE-S for land use change simulation studies in different regions of China (Feng et al., 2015; Han et al., 2015; Li and Song, 2020). Regarding the simulation of impacts of policies on land use, some scholars have used the MASE (Multi-agent System for Environmental Simulation) system to analyze the potential impacts of land use policies in Brazil’s Cerrado region and found it to be an effective model for determining the impacts of policies on land use changes (Abreu et al., 2014). Some scholars have used cellular automation model, combining the characteristics of rural settlement and farmers, the environment, and different policy interventions to simulate various scenarios (Gong et al., 2015). Taking the Deep Creek area (located in Canada) as the research area, some researchers found that CLUE-S can reveal the impact of policy implementation on the ecological environment (Anputhas et al., 2019). The land use simulation software GeoSOS-FLUS has also emerged with the development of new technologies. In 2017, researchers at the Guangdong Key Laboratory of Urbanization and Geographical Environment Spatial Simulation developed the FLUS (Future Land Use Simulation) model (Liu et al., 2017) to simulate different scenarios in land use simulation (Liang et al., 2018a; Liang et al., 2018b; Liang et al., 2020). The FLUS model has been used to explore the impacts of land use changes on ecological functions under different scenarios (Liu et al., 2020), to explore the impacts of urban expansion on primary productivity (Yan et al., 2018), and to determine the impacts of urban expansion on the functional connection of habitat networks (Huang et al., 2018). The FLUS model combines the methods of artificial neural networks and cellular automata and is well suited for solving nonlinear geography problems.
Although numerous studies have investigated the impacts of policies on land use, studies specifically on the impacts of new-type urbanization policies on the spatial patterns of rural settlements are scarce. New-type urbanization emphasizes a “people-oriented” approach, and the reform of the household registration system management will bring about significant changes in the registered population.
Therefore, in our study on the new-type urbanization, the core theory is to use population data to conduct rural settlement simulation research. In the Beijing-Tianjin-Hebei region under new-type urbanization, the floating populations in different regions differ in population source structure and population scale (Chen et al., 2018). Li and Song (2020) have used “Planning” data for this study area and the CLUE-S model to simulate the impacts of new-type urbanization policies on the spatial pattern of rural settlements in Tongzhou District, Beijing, under the following three scenarios: conventional urbanization, new-type urbanization, and counter urbanization. The “Planning” data clearly indicate the number of future urban and rural settlements. This “Plan” provides a definite number for the future urban and rural populations, and the amount of land for urban areas and rural settlements in the future can be estimated by the PID (Principal Index Driver) method (which predicts the amount of land use in the future by using data of land use change and population change in the past under the conditions of obtaining future population data). Subsequently, by calculating the probability of the possible occurrence of each grid land type in the region and other configuration data needed for land conversion (such as cost matrix, neighborhood weight, etc.), the land area is allocated to the region through multiple iterative calculations to complete the simulation of land use under the different sets of parameters (i.e., different scenarios). However, this approach has certain limitations. First, this method requires public or accessible local planning documents for the study area, as future population data are required in the research method. However, such information is not available for some new-type urbanization pilot areas, which means that this method cannot be used to study the parameter setting of future scenarios for those areas. Second, in a study of the Tongzhou District, counter-urbanization significantly differed from the other two scenarios, and there are no studies on the impacts of counter-urbanization under the implementation of the new-type urbanization policy. The research results for Tongzhou District show that under the new-type urbanization policy, the rural settlements in this district will expand significantly by 2030. The pattern changes of rural settlements in different study areas may therefore be different.
The new-type urbanization policy plays a vital role in improving the quality of China's urbanization and may have a significant impact on the spatial distribution patterns of rural settlements. Since the land use for rural settlements is relatively trivial compared with the urban land area (Li et al., 2019), and since it belongs to the second-level land use class, studies are scarce. In relevant studies, population data represent an important parameter for scenario simulation of new-type urbanization. Such studies mainly use the population planning data for 2030, issued by the research area, to predict the future land demand and carry out the simulations. However, the new-type urbanization also includes cities without official future population planning data, such as Dingzhou. As one of the pilot cities of the new-type urbanization, Dingzhou has numerous rural settlements, and the city has recently invested heavily in new-type urbanization construction, with considerable progress in urban development. However, the impact of new-type urbanization policies on the development of rural settlements in Dingzhou remain largely unknown.
Based on the theoretical system of previous studies, this paper uses another parameter-setting method of the new- type urbanization scenario, and applies the GeoSOS-FLUS software to simulate the land use situation of Dingzhou in 2030 under the new-type urbanization policy, which can further supplement relevant studies. Studying the impacts of new-type urbanization on rural settlements can provide a scientific basis for the formulation of a scientific layout of the rural settlements. The FLUS model delivers rapid results and has good potential to simulate and analyze the changes in rural settlements under various scenarios. It can simulate the scenario starting from 2030 (with a step of 15 years). We therefore used the FLUS model to simulate the spatial patterns of land use in Dingzhou in 2030 under different scenarios and analyzed the impacts of the implementation of the new-type urbanization policy on rural settlements in Dingzhou by comparing the future spatial development of rural settlements under different urbanization scenarios, including the conventional urbanization scenario, the new-type urbanization scenario, and the counter-urbanization scenario. Conventional urbanization refers to the type of urbanization before the implementation of the new-type urbanization policy, whereas new-type urbanization refers to the type of urbanization after the implementation of the new-type urbanization policy. Specifically, the conventional urbanization scenario refers to the period of 2015 to 2030, with the development progressing according to the actual urbanization scenario before the implementation of the new-type urbanization policy. The new-type urbanization scenario refers to the development occurring according to the urbanization scenario under the new-type urbanization policy within the same period, and the counter-urbanization scenario refers to development in accordance with the counter-urbanization scenario, also within this period. If Dingzhou does not become a pilot city of the new-type urbanization, it is likely to develop in line with the conventional urbanization model. These two scenarios are the closest to the current situation of urbanization in Dingzhou, and comparing them can provide information about the impacts of the new-type urbanization policy on rural settlements in Dingzhou. Counter-urbanization is a high-level urbanization type which occurs after the urbanization rate has reached a certain level. This phenomenon has been observed for some parts of China. Here, we assume two future development models for Dingzhou under the counter-urbanization scenario. Counter-urbanization is an objective type of urbanization, and the rapid development of Dingzhou in recent years may lead to future counter-urbanization. Therefore, we also include counter-urbanization in the simulation analysis as a type of urbanization scenario.
The research objectives of this paper are three-fold: 1) to reveal changes in the spatial patterns of rural settlements in Dingzhou from 2000 to 2015; 2) to simulate subsequent changes for 2030 under three different urbanization development scenarios: conventional urbanization, new-type urbanization, and counter-urbanization; and 3) to assess the potential impacts of the implementation of the new-type urbanization policy on the spatial patterns of rural settlements in Dingzhou.

2 Research materials and methods

2.1 Overview of the research area

Dingzhou is a county-level city subordinate to Baoding, Hebei, China, with a geographical location of 38°14′- 38°40′N and 114°48′-115°15′E (Fig. 1) and at an average elevation of 43.6 m above sea level. The city covers a total area of 1283 km² and the population of permanent settlers in 2019 was 1.2309 million. The climates of Dingzhou are warm temperate, semi-humid, and semi-arid continental monsoon climates, with hot and dry springs, hot and humid summers, cool autumns, and dry and cold winters. The city has a small inter-annual temperature difference, with an average annual precipitation of 503.2 mm. The terrain is low and flat. The water resources include Tang River, Dasha River, Mengliang River, and about 300 million m3 of exploitable groundwater resources. In February 2015, Dingzhou was selected as the national comprehensive pilot area for new-type urbanization.
Fig. 1 Location of Dingzhou, China

Note: In the lower left corner of the picture, CD: Chengde; ZJK: Zhangjiakou; QHD: Qinhuangdao; BJ: Beijing; LF: Langfang,; TS: Tangshan; TJ: Tianjin; BD: Baoding; CZ: Cangzhou; SJZ: Shijiazhuang; HS: Hengshui; XT: Xingtai; and HD: Handan. On the right, the full names of the abbreviations are as follows: QFD: Qingfengdian; LZ: Liuzao; PC: Pangcun; DXZ: Daxinzhuang; XYC: Xiaoyoucun; YJZ: Yangjiazhuang; DT: Dongting; MYD: Mingyuedian; HTZ: Haotouzhuang Hui; ZC: Zhoucun; BGP: Beigaopeng; and XC: Xicheng.

2.2 Data sources

We obtained land use/land cover data (for the years 2000, 2005, 2010, 2015, 2018), GDP spatial distribution data for 2000 (Xu, 2017a), and population spatial distribution data for 2000 (Xu, 2017b) from the Resource and Environment Science and Data Center (http://www.resdc.cn/) and the Digital Elevation Model (DEM) of Dingzhou from the Geospatial Data Cloud (http://www.gscloud.cn/). Based on Google historical remote sensing data for 2005, the spatial distribution data for the main canals, expressways, and railways in Dingzhou were drawn by visual interpretation of the remote sensing images.
The land type data for “water area”, “urban land”, and “rural settlement” were extracted by using the land use/land cover change data for 2000. We calculated the Euclidean distances between each grid in the above land type data and these land types to obtain the data for “distance to water area”, “distance to urban land”, and “distance to rural settlement”. The slope data for Dingzhou were calculated by using the DEM of Dingzhou.
The types, resolutions, and source information of the research data are shown in Table 1.
Table 1 Details of the research data obtained for Dingzhou
Data Type Resolution (m) Source
Land use/land cover data Raster 30 RESDC
GDP spatial distribution data Raster 1000 RESDC
Population spatial distribution data Raster 1000 RESDC
Digital Elevation Model Raster 30 Geospatial Data Cloud
Distance to water area Raster 30
Distance to urban land Raster 30
Distance to rural settlement Raster 30
Slope data Raster 30
Main canal spatial distribution data Vector
Expressway spatial distribution data Vector
Railway spatial distribution data Vector

Note: RESDC: Resource and Environment Science and Data Center (http://www.resdc.cn/); Blanks indicate that the data were calculated by authors based on relevant data.

2.3 Research framework

Our study can roughly be divided into the four steps: “Analysis of the characteristics of land use changes from 2000 to 2015”, “Configuration of land demand and spatial allocation parameters under different scenarios”, “Simulation accuracy assessment”, and “Future land use simulation in Dingzhou under different scenarios” (Fig. 2). First, we used historical land use data to characterize the land use changes in Dingzhou. For this, we used 2015 Google historical remote sensing images to generate road data, canal data, and water conservancy project data in Dingzhou. The 2000 land use data were used to extract water area, rural settlement, and urban land data. We applied the Euclidean distances to calculate the distance data in raster format, including “distance from water area”, “distance from urban land”, “distance from rural settlement area”, “distance from railway”, and “distance from expressway”. Data for water areas, canals, and water conservancy projects were used to configure the restricted area data. Distance data, DEM data, elevation data, GDP spatial distribution data, and population spatial distribution data were added to the Artificial Neural Network (ANN) land probability-of-occurrence calculation. The GeoSOS-FLUS software was used to calculate the non-spatial demand for land under the various scenarios (conventional urbanization scenarios, new-type urbanization scenarios, and counter-urbanization scenarios) and to configure the cost matrix and neighborhood weights for future spatial land distribution. The 2000 land use data were used to predict 2015 Dingzhou land use data and to evaluate the accuracy of the prediction results. In the case of a good assessment, we used the non-spatial land demand and spatial allocation data to simulate the land use situation of Dingzhou in 2030 under the three scenarios. Finally, the impacts of the new-type urbanization policy on the patterns of rural settlements in Dingzhou were determined based on the simulation results.
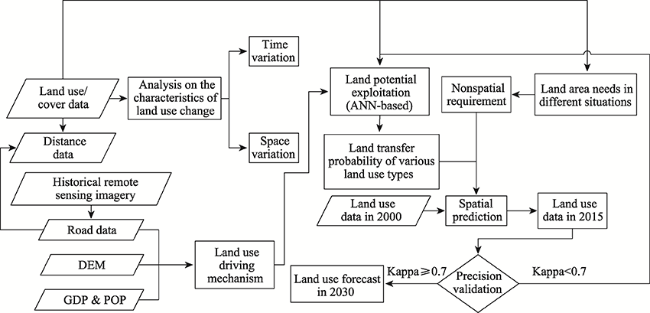
Fig. 2 Schematic illustration of the research framework

2.4 Characteristics of temporal and spatial changes in rural settlements in Dingzhou, China

The Land Use Transfer Matrix (LUTM) method is derived from the quantitative description of the system state and the state transition in system analysis (Yu et al., 2018), with the purpose of revealing the direction of regional land use changes during the research period. The land use transfer matrix can be used to intuitively recognize the area transferred between various land use types. The diagonal of the matrix is the area of the land type without a land type change. Generally, the rows of the LUTM represent the initial year of the study period and the columns the final year of the study period. The mathematical expression of the land use transfer matrix Sij is as follows:
${S_{ij}} = \left[ {\begin{array}{*{20}{c}}{{s_{11}}}& \cdots &{{s_{1n}}}\\ \vdots & \vdots & \vdots \\{{s_{n1}}}& \cdots &{{s_{nn}}}\end{array}} \right]$
where “s” is the area, “n” is the number of land use types, and “i” and “j” represent the land use type at the beginning and end of the study, respectively.

2.5 GeoSOS-FLUS software

GeoSOS-FLUS software has been used in this paper for future land use simulaion. It is composed of FLUS model, precision validation, and land use demand calculation. The land use demand calculation can be completed by using a Markov chain. Land use change simulation can be completed by cellular automata (CA). In principle, FLUS improves on the conventional CA. Because of error transmission in multi-period land use change data, the “allocation module” of FLUS only considers recent land use conditions instead of land use changes. The FLUS uses ANN technology to analyze complex driving force systems, while simultaneously taking into account natural and human factors. The FLUS features a set of adaptive inertia and competition mechanisms to solve problems such as land competition; and the randomness under the mechanism can reflect the uncertainty in the real situation. The FLUS model is composed by two parts, one is probability-of-occurrence estimation, while the other is self-adaptive inertia and competition mechanism. These two parts can eventually form a combined probability, as the basis for allocation of land types and finally complete the configuration of land use types.
The simulation mainly requires two types of data: non- spatial land use quantity forecast data and future land spatial allocation data (including land probability-of-occurrence, cost matrix, neighborhood weight, restricted area, etc.). The software has a built-in accuracy evaluation module.

2.5.1 Prediction of land-use structural changes

The non-spatial land use quantity forecast can predict the future land area required by the various types of land use, although the quantity of non-spatial land use varies under different development scenarios. Here, we set three land use scenarios, namely conventional urbanization, new-type urbanization, and counter-urbanization.
Under the conventional urbanization scenario, Dingzhou will evolve in the future in accordance with historical laws, and the future area of each land type can be calculated by the Markov chain in the GeoSOS-FLUS software (Table 1), using the following equation:
$S(t + 1) = S(t) \times {P_{ij}}$
Where, S(t) and S(t+1) represent the land use states at time “t” and “t+1”, respectively, and “Pij” is the state transition probability matrix. The Markov chain assumes that the land use state at time “t+1” is only related to the land use at time “t”.
Since there is no official population or urban-rural plan information about Dingzhou, the demand for non-spatial land under the new-type urbanization policy is mainly based on the national new-type urbanization construction priorities, the ecological environment plan of Dingzhou, and historical land use changes. In this scenario, this paper sets a forbidden and restricted area (i.e., areas where construction is prohibited or restricted), fully considering ecological factors as the “Plan” indicates that the urban development boundary must be reasonably controlled, and the internal structure of the town should be adjusted. The infrastructure needs to be improved and the ecological environment conserved in order to reduce the damage to the natural environment. At the same time, the “Plan” has set a forbidden and restricted area in the three areas and four lines in the city, including a nature reserves area, basic farmland area, water sources area, road redlines, etc. The “three areas and four lines” of the city include prohibited areas, restricted areas, suitable areas, green line, blue line, purple line, and yellow line. The green line is the control line of the urban green space. The blue line is the water control line. The purple line is a conservation line for historic buildings. The yellow line is the control line of infrastructure land in the city. Construction-prohibited areas are areas where urban construction and development activities are banned, whereas in restricted areas, urban construction and development activities are merely restricted. The suitable areas are areas that have been designated as urban built-up areas, and reasonable land use could be considered. The green line is the control line that delimits the green area, and the blue line is the geographical boundary that delimits various surface water bodies. The purple line is the boundary of the historical and cultural block, and the yellow line is the control line for urban infrastructure (XNA, 2014). Dingzhou was included as a pilot city in February 2015. Therefore, the non-spatial demand data under the new-type urbanization scenario are mainly based on the changes that occurred in 2015-2018, and Markov Chain was used for forecasting (Table 2).
Table 2 Demands for land area under different development scenarios in Dingzhou, China, in 2030. (Unit: %)
Land use type Conventional urbanization New-type urbanization Counter-
urbanization
Cultivated land 73.76 72.62 68.92
Forest 0.09 3.31 3.31
Water area 2.55 3.05 3.05
Urban land 5.67 3.79 3.80
Rural settlement 16.64 15.65 19.35
Other construction 1.29 1.57 1.57
The counter-urbanization scenario lacks reference material, and therefore, we based this study on the land use data from 2000 to 2018. Dingzhou has issued the “Dingzhou’s 2020 Land Greening Implementation Plan” (hereinafter referred to as the “Plan”) (People’s Government of Dingzhou, 2020), which stipulates the following: Ecological construction projects are carried out in the town and rural areas, outside the red line of the main road and the riverside areas. We therefore assume that the basic characteristics of the counter-urbanization scenario are as follows: people have a higher sense of the protection of forest, grass, and water areas, the transfer of rural settlement increases, and the transfer of cultivated land increases (Table 2).
There is less forest and grassland in Dingzhou. There are no grassland types in the land use/cover data for Dingzhou in 2000, 2005, 2010, and 2015. However, in 2018, large areas of grassland appeared near the Dasha River. In the simulation research, if a certain type of land is not included in the original data, this type will not show up in the simulation results. Considering this situation, We integrated the grassland category into the forest category; in this sense, the forest category in the land use simulation results of Dingzhou in 2030 represents both forest and grassland.

2.5.2 Probability-of-occurrence estimation

In the FLUS model, the future probability-of-occurrence calculation for each category is located in the “ANN-based probability-of-occurrence Estimation” module. The method used in this module is ANN, which simulates a biological neural network that learns and fits the relationship between the input layer and the target through multiple “learning-recall” methods; and it has good applicability in complex nonlinear geographic problems. Assuming that the land use data set in the input data have M effective land classes, a file with M bands (Band 1-Band M) was generated after running the module. The value of each band is the occurrence probability value. The calculation formula (Liu et al., 2017) is as follows:
$\begin{array}{l}P(p,k,t) = \mathop \sum \limits_j {w_{j,k}} \times {\rm{sigmoid}}(ne{t_j}(p,t)) = \\\;\;\;\;\;\;\;\;\;\;\;\;\;\;\;\;\;\mathop \sum \limits_j {w_{j,k}} \times \frac{1}{{1 + {{\rm{e}}^{ - ne{t_j}(p,t)}}}}\end{array}$
Where P(p, k, t) represents the probability-of-occurrence value of the land use type k on the grid cell p at the training time t; wj,k represents the adaptive weight between the hidden layer and the output layer, and netj(p,t) represents the signal received by neuron j in the hidden layer.
We selected the default ANN training parameters, with the following nine driving factors: elevation, slope, annual GDP spatial distribution in 2000, population spatial distribution in 2000, distance to town, distance to rural settlement, distance to water area, distance to the railway, and distance to the expressway. All driving factor data were in TIFF file format, using a unified coordinate system, and all were resampled to a 30-m resolution, with the same row and column numbers. After importing the driving factor data, we selected the “Normalization” option (indicating that the normalization operation is required).

2.5.3 Cost matrix and neighborhood effects

The cost matrix represents whether the land type can be directly converted. In the cost matrix, a value of 0 means no conversion is allowed, and a value of 1 indicates that conversion is allowed; all values on the diagonal of the matrix are 1. The rows of the matrix represent the land types in the beginning period, and the columns of the matrix represent the future land types.
The value of the cost matrix under the conventional urbanization scenario was set according to the historical land use changes. Cultivated land, forest, grassland, water area, and rural settlement can each be converted to other land types. Urban land has not been transferred to either forest, grassland, water area, rural settlements, or other construction. Other constructions have not been converted to either forest or grassland, water area, or rural settlements (Table 3).
Table 3 Future land use cost matrix under the three urbanization scenarios
Land use type Cultivated land Forest Water area Urban land Rural settlement Other constructions
Cultivated land a1/b1/c1 a1/b1/c1 a1/b1/c1 a1/b1/c1 a1/b1/c1 a1/b1/c1
Forest a1/b1/c1 a1/b1/c1 a1/b1/c1 a1/b1/c0 a1/b1/c0 a1/b1/c0
Water area a1/b1/c1 a1/b1/c1 a1/b1/c1 a1/b1/c0 a1/b1/c0 a1/b1/c0
Urban land a1/b1/c1 a0/b1/c1 a0/b1/c1 a0/b1/c1 a0/b1/c1 a0/b1/c1
Rural settlement a1/b1/c1 a1/b1/c1 a1/b1/c1 a1/b1/c1 a1/b1/c1 a1/b1/c1
Other construction a1/b1/c1 a0/b1/c1 a0/b1/c1 a1/b1/c1 a0/b1/c1 a1/b1/c1

Note: “a” represents the conventional urbanization scenario, “b” represents the new-type urbanization scenario, and “c” represents the counter-urbanization scenario. “0” represents that land type conversion is not allowed, and “1” represents that land type conversion is allowed. For example, “a1/b1/c1” means that in the three urbanization scenarios, the corresponding two land types can be converted; “a1/b1/c0” means that in the “a” and “b” scenarios, the corresponding two land types can be converted, whereas conversion is not possible in the “c” scenario.

For the setting of limited construction areas in the new- type urbanization scenario, the restricted construction area data already includes the settings of forest land, grassland, water area, protected areas, roads, and their buffer zones. Except for the restricted area, there are no restrictions in other areas, which means that the values are 1 (Table 3).
In the counter-urbanization scenario, based on the existing greening implementation plan, this paper assumes in this scenario that Dingzhou still protects its existing forest land, grassland, and water areas, and there are no restrictions on the conversion of other land types (Table 3).
The range of the neighborhood weight is 0-1, and the larger the value, the stronger the expansion ability of the land use type. In the setting of this value, the expansion capacity of urban land is set to 1, and the value for each of the other land types was a relative value set based on historical land use changes. Compared with urban land, other land types have lower expansion capabilities. This study used the land use transfer matrix and expert consultation to determine the weight values (Table 4).
Table 4 Neighborhood weights of the different land use types
Land use type Cultivated land Forest Water area Urban land Rural settlement Other construction land
Neighborhood weight 0.5 0.4 0.5 1 0.8 0.9
Neighborhood development density is a parameter in the combined probability calculation. The calculation formula is as follows (Liu et al., 2017):
$\Omega _{p,k}^t = \frac{{\sum\limits_{N \times N} {{\rm{con}}\left( {c_p^{t - 1} = k} \right)} }}{{N \times N - 1}} \times {w_k}$
where $\Omega _{p,k}^t$ is the neighborhood effect of the land class k on the cell p at the t iteration, and $\mathop \sum \limits_{N \times N} {\rm{con}}\left( {c_p^{t - 1} = k} \right)$ is the number of land use type k in the Moore neighborhood window of N×N in the t-1 iteration. In this study, N was set to 3; wk is the variable weight between different land use types.
Table 4 shows the neighborhood weight values.

2.5.4 Restricted area setting

The “Plan” is a programmatic document for the implementation of new-type urbanization. It clearly specifies the restricted areas in the future Plan, whereas the other two scenarios have no relevant reference documents. Since the counter-urbanization set in this study is assumed to occur under the new-type urbanization policy, data for restricted areas were used in both the new-type urbanization scenario and the counter-urbanization scenario. In this paper, the limited construction data for Dingzhou (including main water conservancy canals and buffer protection areas, rivers and buffer protection areas) were obtained through visual interpretation of remote sensing images. Due to the lack of a clear buffer setting value, the buffer could not be set.

2.5.5 Self-adaptive inertia coefficient and combined probability calculation

In the FLUS model, to develop the simulation according to the actual needs, the self-adaptive inertia coefficient is used to adjust the current land use quantity. When the land amount of k land use type in the t-th iteration has considerable gaps relative to the expected number, the raster variable of k land use type in the t+1 iteration increases (Liu et al., 2017; Zhang et al., 2020), and the calculation formula is as follows:
$Inertia_k^t = \left\{ {\begin{array}{*{20}{c}}{Inertia_k^{t - 1}\;\;\;\;\;\;\;\;\;\;\;\;\;\;\;\;\;\;{\rm{if}}\;\;\left| {D_k^{t - 1}} \right| \le \left| {D_k^{t - 2}} \right|}\\{Inertia_k^{t - 1} \times \frac{{D_k^{t - 2}}}{{D_k^{t - 1}}}\;\;\;{\rm{if}}\;D_k^{t - 1} < D_k^{t - 2} < 0}\\{Inertia_k^{t - 1} \times \frac{{D_k^{t - 1}}}{{D_k^{t - 2}}}\;\;{\rm{\;if}}\;0 < D_k^{t - 2} < D_k^{t - 1}}\end{array}} \right.$
where $Inertia_k^t$ is the inertia coefficient of the land use type k at the t iteration, and $D_k^{t - 1}$ is the difference between the macro demand and the allocated amount of land use type k until iteration time t–1.
Combining the calculations of land use type occurrence probability, cost matrix, neighborhood weight, and adaptive inertia coefficient, a combined land use conversion probability can be obtained using the following equation:
$TP_{p,k}^t = {P_{p,k}} \times \Omega _{p,k}^t \times Inertia_k^t \times (1 - s{c_{c \to k}})$
where $TP_{p,k}^t$ is the combined probability of transforming from the initial land use type to k land use type on the t iteration cell P, ${P_{p,k}}$ is the occurrence probability of k land use type on cell P, $\Omega _{p,k}^t$ is the neighborhood effect of the land use type k on the cell P at the t iteration, and $s{c_{c \to k}}$ is the cost of converting land use type c to land use type k.
Subsequently, the FLUS model combines the occurrence probability of each category, neighborhood weight, cost matrix calculated by ANN and uses the roulette mechanism to determine the conversion relationship between land categories and land use distribution.

2.5.6 Accuracy assessment

The accuracy assessment link of the GeoSOS-FLUS software running simulation results mainly includes two methods: the Kappa coefficient and the FOM coefficient. In this paper, we used the Kappa coefficient for accuracy assessment, using the following equation:
$Kappa = \frac{{{P_0} - {P_e}}}{{1 - {P_e}}}$
where ${P_0}$ is the sum of diagonal elements of the matrix divided by the total number of samples and ${P_e}$ is the product of the actual number and the predicted number divided by the square of the total number of samples.
A Kappa coefficient value between 0.41 and 0.60 means that the model simulation result is feasible and the degree of consistency of the simulation is moderate. Values between 0.61 and 0.80 indicate that the model simulation result is very good, and the degree of simulation consistency is good.

3 Results

3.1 Characteristics of land use changes in Dingzhou from 2000 to 2015

Based on the statistical results of the land use areas of Dingzhou in 2000 and 2015 (Table 5), the main land use type of Dingzhou is cultivated land, followed by rural settlements, with lower values for forests, grasslands, and water area. The area of rural settlement increased significantly from 2010 to 2015 (by 11.12%).
Table 5 Area of each land use type in Dingzhou, China, in different years (Unit: km²)
Land use type 2000 2005 2010 2015
Cultivated land 1059.54 1058.49 1056.25 997.10
Forest 1.46 1.41 1.46 1.20
Water area 25.94 25.87 25.94 29.62
Urban land 16.80 18.02 18.85 40.40
Rural settlement 174.32 174.27 174.80 196.13
Other construction land 1.76 1.76 2.53 15.38
Total 1279.82 1279.82 1279.82 1279.82
From 2000 to 2015, the areas of urban land, rural settlements, and other construction land in Dingzhou significantly expanded (Fig. 3). The original urban land spread to the surrounding area, and the surrounding villages merged. A second urban land area was developed in the southern part of the “Dasha River” from 2010 to 2015. Changes in the number of rural settlements can be described as either increased, unchanged, decreased, and disappeared. The density of rural settlements around towns has increased, and the original other construction area was swallowed up by urban land. The newly generated other construction areas were only small and sporadically distributed. Large-scale other construction areas were mainly established and developed adjacent to the Tang River and the Dasha River. The area of forest land in Dingzhou is small, and its total area has decreased over the years; most of it was converted into cultivated land, water areas, and land for rural settlements.
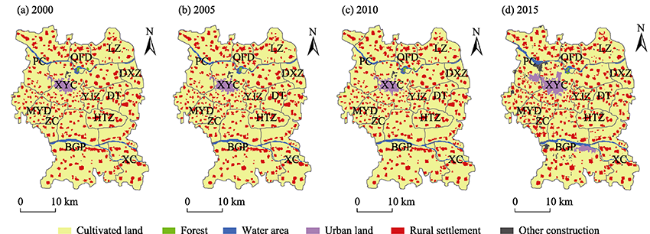
Fig. 3 Land use status of Dingzhou, China in 2000 (a), 2005 (b), 2010 (c), and 2015 (d).

Note: QFD: Qingfengdian; LZ: Liuzao; PC: Pangcun; DXZ: Daxinzhuang; XYC: Xiaoyoucun; YJZ: Yangjiazhuang; DT: Dongting; MYD: Mingyuedian; HTZ: Haotouzhuang Hui; ZC: Zhoucun; BGP: Beigaapeng; and XC: Xicheng.

3.2 Simulation of rural settlement evolution

3.2.1 Simulation accuracy assessment

To assess the accuracy of the land use simulation results for Dingzhou under the different scenarios, the GeoSOS-FLUS software was used to simulate the land use situation of Dingzhou in 2015, and the simulation results were compared with the actual land use distribution in 2015 (Fig. 4a- 4b). The Kappa coefficient was 0.72, and the simulation overall accuracy (OA) was 0.89. Among the individual components, the producer accuracy of rural settlements was 0.81, and the user accuracy was 0.83. The simulation effect was good, and the simulation error was mainly due to the ambiguity in distinguishing between rural settlements, other construction areas, and urban land. These two land types are greatly affected by human factors in actual situations, and the data types involved are numerous and difficult to obtain, potentially resulting in a low simulation accuracy.
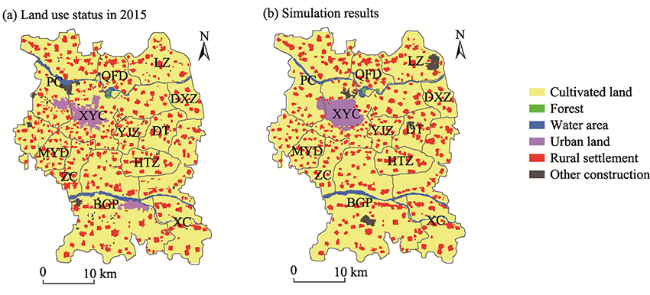
Fig. 4 Land use status in Dingzhou, China, in 2015 (a) and simulation results (b).

Note: QFD: Qingfengdian; LZ: Liuzao; PC: Pangcun; DXZ: Daxinzhuang; XYC: Xiaoyoucun; YJZ: Yangjiazhuang; DT: Dongting; MYD: Mingyuedian; HTZ: Haotouzhuang Hui; ZC: Zhoucun; BGP: Beigaapeng; and XC: Xicheng.

3.2.2 Changes in rural settlements under the three different scenarios

The calculation results of the probability-of-occurrence based on ANN (Fig. 5) show that most rural settlements have a high probability-of-occurrence up to and around their original locations, with only a small number of rural settlements having a zero probability-of-occurrence. The patchy area in the southeastern part of the urban land has a higher probability-of-occurrence. The rural settlement in Beigaopeng has a relatively low probability-of-occurrence as it has been transformed into a second urban area.
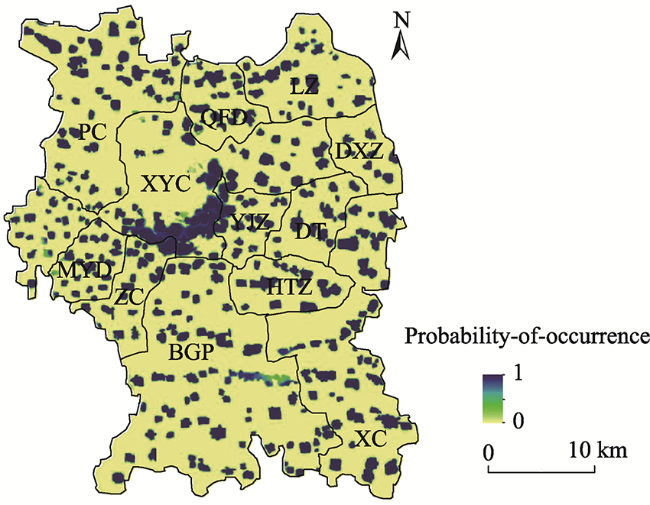
Fig. 5 Spatial distribution of the probability-of-occurrence of rural settlements in Dingzhou, China

Note: QFD: Qingfengdian; LZ: Liuzao; PC: Pangcun; DXZ: Daxinzhuang; XYC: Xiaoyoucun; YJZ: Yangjiazhuang; DT: Dongting; MYD: Mingyuedian; HTZ: Haotouzhuang Hui; ZC: Zhoucun; BGP: Beigaapeng; and XC: Xicheng.

Based on the changes in the patterns of historical rural settlements, the simulation results for the different scenarios, and the calculation results of the probability-of-occurrence of rural settlement in Dingzhou by ANN, we believe that the spatial patterns of rural settlements in Dingzhou have the following two basic characteristics: a strong stability and expansion towards the northwest in the three models. Under the different scenarios, the land use situation of Dingzhou in 2030 differs considerably, along with the patterns and areas of rural settlements (Fig. 6).
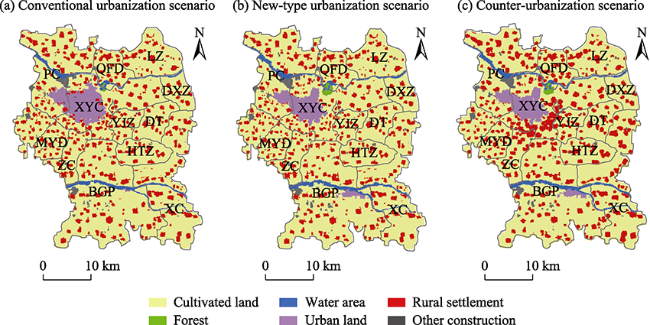
Fig. 6 Land use in Dingzhou, China, in 2030 under the conventional urbanization scenario (a), the new-type urbanization scenario (b), and the counter-urbanization scenario (c).

Note: QFD: Qingfengdian; LZ: Liuzao; PC: Pangcun; DXZ: Daxinzhuang; XYC: Xiaoyoucun; YJZ: Yangjiazhuang; DT: Dongting; MYD: Mingyuedian; HTZ: Haotouzhuang Hui; ZC: Zhoucun; BGP: Beigaapeng; and XC: Xicheng.

Under the conventional urbanization scenario (Fig. 6a), the spatial distribution patterns of rural settlements developed in a stable way, without an increase or decrease in the number of rural settlements. The stability of rural settlements is strong, and urban encroachment on rural settlements is absent. Almost every rural settlement area has undergone marginal expansion from the original basis, and the overall direction of expansion tends toward the northwest, where urban land is located. In this scenario, expansion of rural settlements is more obvious than contraction.
Under the new-type urbanization scenario (Fig. 6b), the spatial distribution patterns of rural settlements developed in a relatively stable way, without an increase or decrease in the number of rural settlements. The stability of rural settlements is strong, without urban encroachment. The shape of most rural settlements has changed, with marginal expansion, marginal contraction, and half-contraction with half-expansion. The overall direction of expansion tends toward the northwest. For rural settlements in the east and south of the town in XYC, expansion can be regarded as tending towards the town. Rural settlements in the western and northern regions of the towns mostly expand to the west. Compared with the conventional urbanization scenario, expansion is less obvious in this scenario.
Under the counter-urbanization scenario (Fig. 6c), the spatial distribution patterns of rural settlements changed significantly. The number of rural settlements has changed, whereas the number of rural settlements near Dasha River has decreased, and rural settlements in other areas have merged or separated. Urban encroachment on rural settlements is absent. On the whole, rural settlements have expanded largely through the occupation of cultivated land, mainly in the southeastern part of the town.

3.2.3 Impacts of new-type urbanization on rural settlement patterns

Under conventional urbanization, rural settlements of Ding zhou will expand along their edges across a small range by 2030 (Fig. 7). Under the development scenario of new-type urbanization, rural settlements of Dingzhou will also expand across a small range by 2030, albeit to a lower extent. However, under the development scenario of counter-urbanization, the rural settlements of Dingzhou will change dramatically by 2030. In the southeastern part of the town, the increase will be significant. The original rural settlements will expand significantly along their own edges. In all three cases, the contraction of rural settlements also occurs mainly in their edges, following the order counter-urbanization > conventional urbanization > new-type urbanization. Under the three scenarios, the degrees of change in the rural settlements are basically inversely proportional to the distance from the town, that is, the closer the rural settlements are to the town, the more dramatic the changes.
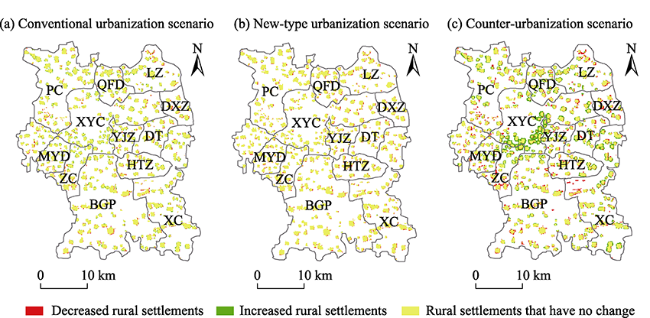
Fig. 7 Spatial changes of rural settlements from 2015 to 2030 under conventional urbanization (a), new-type urbanization, (b) and counter-urbanization (c) in Dingzhou, China.

Note: QFD: Qingfengdian; LZ: Liuzao; PC: Pangcun; DXZ: Daxinzhuang; XYC: Xiaoyoucun; YJZ: Yangjiazhuang; DT: Dongting; MYD: Mingyuedian; HTZ: Haotouzhuang Hui; ZC: Zhoucun; BGP: Beigaapeng; and XC: Xicheng.

4 Discussion

Based on our results, the new-type urbanization policy restricts rural settlement expansion. This policy can effectively control the disorderly development of cultivated land, which is in agreement with previous findings (Li and Song, 2020). The transformations in Dingzhou, Hebei, mainly occur between rural settlements and cultivated land. The transformations in Tongzhou, Beijing, are mainly between rural settlements and forest and grassland. These are the results of the “Dingzhou’s 2020 Land Greening Implementation Plan”, a new-type urbanization policy to “accelerate the construction of a green city” and other documents related to ecological protection. Therefore, future development areas of Dingzhou will not occupy areas that are now forest, grassland, and water areas significantly.
With counter-urbanization in the implementation of the new-type urbanization policy, the rural settlement patterns in the future may largely differ from the current patterns, especially in the southeastern part of the town’s periphery, and the expansion of rural settlements is likely to occur with significant characteristics.
Our research is mainly based on the theoretical framework of previous studies. In the previous research framework, the population data of the study area in 2030 was obtained from regional planning documents, and the PID method was used to further calculate the amount of land needed for the future population. However, due to the lack of regional planning documents for Dingzhou, the amount of land under conventional urbanization can only be provided for 2000 and 2015, using the Markov chain. The amount of land under the new-type urbanization policy can be calculated based on land use/land cover data from the data after the policy implementation in 2015-2018. To compare the new-type urbanization scenario with the counter-urbanization scenario, the amount of land under the counter-urbanization scenario is obtained based on the amount under the new-type urbanization scenario. The only change is the transformation between rural settlements and cultivated land. In both CLUE-S and GeoSOS-FLUS, parameters such as cost matrix, neighborhood weight, and restricted area should be set. Therefore, for other parameter settings (except land amount), the method is basically the same as that used in the previous study. Some policy factors are difficult to quantify, and they were not included in the simulation because it is greatly affected by the policy.
Our study shows that the new-type urbanization has a better control effect on the disorderly development of rural settlements in the experimental area and achieves the purpose of intensive land use, which is consistent with the goal of the new-type urbanization. However, the results for the counter-urbanization scenario show that the emergence of counter-urbanization will break the current spatial pattern of rural settlement, causing changes in various other social and economic factors. Therefore, it is necessary to strengthen the monitoring for the counter-urbanization and improve the related management and planning under counter-urbanization conditions.
Against the background of a developing urbanization, rural areas face the following issues (Li et al., 2018):
(1) Under the new-type urbanization policy, migrant workers are required to have access to public services when they move to cities and towns. However, this requires local financial support, and this expenditure would be huge. In this case, there may be low taxes, low land prices, and environmental requirements to attract foreign investment and increase the burden of rural environmental problems. Dingzhou is sparsely vegetated, and therefore, afforestation and ecological protection should be carried out continuously.
(2) New-type urbanization lacks the level of cultural protection. Due to people feeling “misplaced” or “homesick”, we should pay attention to the protection of objects with symbolic significance in the rural areas and strengthen the protection and inheritance of the rural culture.
(3) Rural settlements under the new-type urbanization have a tendency to expand, which may have an impact on food security. There may also be issues such as idle house sites, a large amount of land per capita, and a lack of scientific planning of the rural settlements. Therefore, local actors should strengthen the planning of rural settlement construction.

5 Conclusions

Against the backgrounds of conventional urbanization, new-type urbanization, and counter-urbanization, we analyzed three kinds of land use scenarios in the future, using land use/land cover data, social and economic data, and the GeoSOS-FLUS software, for the period of 2000-2015 in Dingzhou. The spatial patterns of Dingzhou’s rural settlement in 2030 were derived under the different scenarios, and the new-type urbanization policy’s impact on rural settlements was determined.
The area of rural settlements in Dingzhou is expanding from 2000 to 2030, mainly around the original edges. When comparing the three scenarios, the pattern of rural settlements in the new-type urbanization scenario without counter-urbanization is more stable, the expansion area is smaller, and the land use is more intensive. Under the counter-urbanization scenario, a large number of rural settlements may be added to the southeastern area outside the town of Dingzhou. The implementation of the new-type urbanization policy is of great significance to the intensive and stable use of rural land resources. The software parameter setting method used in this paper can also be used as a reference for subsequent research.
[1]
Abreu C G, Coelho C G C, Ralha C G, et al. 2014. A model and simulation framework for exploring potential impacts of land use policies: The Brazilian Cerrado case. 2014 47th Hawaii International Conference on System Sciences. Hawaii, USA: IEEE. DOI: 10.1109/HICSS.2014.113.

DOI

[2]
Anputhas M, Janmaat J, Nichol C, et al. 2019. If they come, where will we build it? Land-use implications of two forest conservation policies in the Deep Creek Watershed. Forests, 10(7): 581. DOI: 10.3390/f10070581.

DOI

[3]
Chen M X, Guo S S, Lu D D. 2018. Characteristics and spatial patterns of floating population in the Beijing-Tianjin-Hebei urban agglomeration under the background of new urbanization. Progress in Geography, 37(3): 363-372. (in Chinese)

[4]
Cui X, Wang Y C, Zhang B L, et al. 2020. Spatiotemporal evolution of rural settlements and influencing factors in Baoding City. Research of Soil and Water Conservation, 27(5): 265-272, 262. (in Chinese)

[5]
Feng Z, Wu J S, Gao Y, et al. 2015. Environmental policy simulation and assessment under rapid urbanization: Case study of essential area policy in Shenzhen, China. Journal of Urban Planning and Development, 141(4): 05014030. DOI: 10.1061/(asce)up.1943-5444.0000259.

DOI

[6]
Gong J, Yang J, Li Y F. 2015. A case-based cellular automation model for simulating changes in rural residential areas. Resources Science, 37(9): 1797-1806. (in Chinese)

[7]
Gong J Z, Jian Y Q, Chen W L, et al. 2019. Transitions in rural settlements and implications for rural revitalization in Guangdong Province. Journal of Rural Studies. DOI: 10.1016/j.jrurstud.2019.10.037.

DOI

[8]
Han H R, Yang C F, Song J P. 2015. Simulation and projection of land-use change in Beijing under different scenarios. Progress in Geography, 34(8): 976-986. (in Chinese)

[9]
Huang Y, Huang J L, Liao T J, et al. 2018. Simulating urban expansion and its impact on functional connectivity in the Three Gorges Reservoir Area. Science of the Total Environment, 643: 1553-1561.

DOI

[10]
Li H H, Song W. 2019. Expansion of rural settlements on high-quality arable land in Tongzhou District in Beijing, China. Sustainability, 11(19): 5153. DOI: 10.3390/su11195153.

DOI

[11]
Li H H, Song W. 2020. Evolution of rural settlements in the Tongzhou District of Beijing under the new-type urbanization policies. Habitat International, 101: 102198. DOI: 10.1016/j.habitatint.2020.102198.

DOI

[12]
Li H H, Song W, Chen B M, et al. 2019. Review of the research on the evolution simulation of spatical-temporal patterns in rural settlements. Journal of China Agricultural Resources and Regional Planning, 40(1): 79-88. (in Chinese)

[13]
Li D M, Wang D Y, Li H, et al. 2017. The effects of rural settlement evolution on the surrounding land ecosystem service values: A case study in the eco-fragile areas, China. ISPRS International Journal of Geo-info rmation, 6(2): 49. DOI: 10.3390/ijgi6020049.

DOI

[14]
Li Y H, Jia L R, Wu W H, et al. 2018. Urbanization for rural sustainability -Rethinking China’s urbanization strategy. Journal of Cleaner Production, 178: 580-586.

DOI

[15]
Liang X, Liu X P, Li D, et al. 2018a. Urban growth simulation by incorporating planning policies into a CA-based future land-use simulation model. International Journal of Geographical Information Science, 32(11̶12): 2294-2316.

DOI

[16]
Liang X, Liu X P, Chen G L, et al. 2020. Coupling fuzzy clustering and cellular automata based on local maxima of development potential to model urban emergence and expansion in economic development zones. International Journal of Geographical Information Science, 34(10): 1930-1952.

DOI

[17]
Liang X, Liu X P, Li X, et al. 2018b. Delineating multi-scenario urban growth boundaries with a CA-based FLUS model and morphological method. Landscape and Urban Planning, 177: 47-63.

DOI

[18]
Liu Y B, Hou X Y, Li X W, et al. 2020. Assessing and predicting changes in ecosystem service values based on land use/cover change in the Bohai Rim coastal zone. Ecological Indicators, 111: 106004. DOI: 10.1016/j.ecolind.2019.106004.

DOI

[19]
Liu X P, Liang X, Li X, et al. 2017. A future land use simulation model (FLUS) for simulating multiple land use scenarios by coupling human and natural effects. Landscape and Urban Planning, 168: 94-116.

DOI

[20]
Long H L. 2014. Land consolidation: An indispensable way of spatial restructuring in rural China. Journal of Geographical Sciences, 24(2): 211-225.

DOI

[21]
Long H L, Liu Y S, Wu X Q, et al. 2009. Spatio-temporal dynamic patterns of farmland and rural settlements in Su-Xi-Chang region: Implications for building a new countryside in coastal China. Land Use Policy, 26(2): 322-333.

DOI

[22]
Ouyang G H. 2020. Spatial pattern evolution and mechanism of rural residential areas around big cities: Taking Jiangxia District of Wuhan as an example. Urban Problems, 2020(2): 13-21. (in Chinese)

[23]
Ren Y Q, Wu Y. 2021. Spatial pattern of rural settlements in Langzhong City and its influencing factors. Journal of China West Normal University (Natural Sciences), 42(2): 181-187. (in Chinese)

[24]
Shi M J, Xie Y W, Cao Q. 2016. Spatiotemporal changes in rural settlement land and rural population in the middle basin of the Heihe River, China. Sustainability, 8(7): 614. DOI: 10.3390/su8070614.

DOI

[25]
Song W, Liu M L. 2014. Assessment of decoupling between rural settlement area and rural population in China. Land Use Policy, 39: 331-341.

DOI

[26]
Song W, Chen B M, Zhang Y. 2014. Land-use change and socio-economic driving forces of rural settlement in China from 1996 to 2005. Chinese Geographical Science, 24(5): 511-524.

DOI

[27]
Tannier C, Cura R, Leturcq S, et al. 2020. An agent-based model for exploring the combined effects of social and demographic changes on the concentration and hierarchy of rural settlement patterns in north-western Europe during the middle ages (800-1200 CE). Journal of Anthropo logical Archaeology, 59: 101204. DOI: 10.1016/j.jaa.2020.101204.

DOI

[28]
Wang X W. 2017. Study on the development of the green eco-city under the background of new-type urbanization. Agro Food Industry Hi-Tech, 28(3): 1410-1412.

[29]
XNA (Xinhua News Agency). 2014. National new-type urbanization plan (2014-2020). http://www.gov.cn/zhengce/2014-03/16/content_2640075.htmViewed 2 Feb 2020.

[30]
Xu X L. 2017a. China’s GDP spatial distribution on kilometer grid data set. Data Registration and Publication System of Data Center for Resources and Environmental Sciences, Chinese Academy of Sciences. DOI: 10.12078/2017121102.

DOI

[31]
Xu X L. 2017b. Spatial distribution of population in China based on kilometer grid data set. Data Registration and Publication System of Data Center for Resources and Environmental Sciences, Chinese Academy of Sciences. DOI: 10.12078/2017121101.

DOI

[32]
Yan Y C, Liu X P, Wang F Y, et al. 2018. Assessing the impacts of urban sprawl on net primary productivity using fusion of Landsat and MODIS data. Science of the Total Environment, 613-614: 1417-1429.

DOI

[33]
Yang R, Liu Y S, Long H L, et al. 2015. Spatio-temporal characteristics of rural settlements and land use in the Bohai Rim of China. Journal of Geographical Sciences, 25(5): 559-572.

DOI

[34]
Yu Z W, Guo X Y, Zeng Y X, et al. 2018. Variations in land surface temperature and cooling efficiency of green space in rapid urbanization: The case of Fuzhou City, China. Urban Forestry & Urban Greening, 29: 113-121.

[35]
Zhang T Z, Zhang F R, Xie Z, et al. 2019. Spatial pattern evolution of rural settlements in mountainous areas of ethnic minorities in Yunnan Province under background of precise poverty alleviation. Transactions of the Chinese Society of Agricultural Engineering, 35(9): 246-254. (in Chinese)

[36]
Zhang J D, Mei Z X, Lv J H, et al. 2020. Simulating multiple land use scenarios based on the FLUS model considering spatial autocorrelation. Journal of Geo-information Science, 22(3): 531-542. (in Chinese)

Outlines

/