Urban Ecosystem

The Evolution Pattern and Simulation of Land Use in the Beijing Municipal Administrative Center (Tongzhou District)

  • LIU Yujie ,
  • SHI Jinlian ,
  • ZHENG Yaomin ,
  • HUANG Xiankai , *
Expand
  • School of International Economics and Management, Beijing Technology and Business University, Beijing 100048, China
* HUANG Xiankai, E-mail:

LIU Yujie, E-mail:

Received date: 2021-09-07

  Accepted date: 2021-11-23

  Online published: 2022-03-09

Supported by

The National Natural Science Foundation of China(31470518)

Institute of Culture and Tourism Development of Beijing Technology and Business University(202106104)

Abstract

Beijing Municipal Administrative Center (Beijing MC) in Tongzhou District has inherited the non-capital core functions of Beijing’s central urban area, and its rapid construction and development urgently require a scientific understanding of the pattern of land use evolution in the region. This paper analyzes the pattern of land use evolution in Tongzhou District over the past 40 years, from 1980 to 2020. According to the historical evolutionary characteristics of land use and urban development planning goals, combined with the driving factors of cultural tourism development, the Future Land-use Simulation (FLUS) model is used to simulate the spatial distribution of land use in Beijing MC (Tongzhou District) in 2035 under three scenarios of urbanization acceleration, deceleration and sustainable development. The results show three major trends. (1) Beijing MC (Tongzhou District) is dominated by urban development and construction. During the high-speed urbanization stage from 1980 to 2010, the urban expansion pattern of “along the Sixth Ring Road and along the Grand Canal” was formed. During the low-speed urbanization stage from 2010 to 2020, the land distribution was stable, and Tongzhou District formed a pattern of urban-rural differentiation and land intensification from northwest to southeast. As a typical area of ​​Tongzhou District’s urbanization, Beijing MC has the same characteristics of the temporal and spatial evolution as Tongzhou as a whole. (2) By 2035, there are significant differences in land use among the three scenarios with respect to the magnitude of change and spatial distribution. The area and distribution of ecological land under the urban sustainable development scenario are optimal, which is conducive to the realization of sustainable urban development. In analyzing the degree of conformity with the three Beijing MC zoning plans, the prediction simulation under the sustainable development scenario is highly consistent with the land use of the “Beijing Municipal Administrative Center Regulatory Detailed Planning (Block Level) (2016-2035)” (hereinafter referred to as “Planning”) issued by the municipal government. However, there are certain deviations between the simulation predictions in the cultural tourism function area and the livable living scenery area and the corresponding “Planning” expectations. During the urban construction process, the internal ecological land area still needs to be increased. (3) Tongzhou District may lack a close connection between the urban and rural areas in the southeast. Potential risks such as the imbalance in the development of northern and southern townships require further attention in the development process. The prediction and simulation results of the model can provide certain data and methodological support for the construction of a harmonious and livable city in Beijing MC (Tongzhou District).

Cite this article

LIU Yujie , SHI Jinlian , ZHENG Yaomin , HUANG Xiankai . The Evolution Pattern and Simulation of Land Use in the Beijing Municipal Administrative Center (Tongzhou District)[J]. Journal of Resources and Ecology, 2022 , 13(2) : 270 -284 . DOI: 10.5814/j.issn.1674-764x.2022.02.010

1 Introduction

Since the reform and opening up in 1978, China has made great achievements in industrialization and urbanization, but the rapid economic growth and rapid social transformation have also led to a series of problems, such as chaotic land and resource development and heavy environmental costs (Huang et al., 2017a). As the most direct form of interaction between human activities and the natural environment (Liu et al, 2014), Land Use/Cover Change (LUCC) is regarded as an important basis for assessing the rationality of land resource allocation and maintaining land ecological security (Li and Yang, 2007; Kuang, 2019). Employing a rational layout and optimal allocation of land resources can not only improve regional economic efficiency, adjust industrial structure and restrain population urbanization, but is also one of the important ways to achieve sustainable urban development under the background of new urbanization (Yang et al., 2015; Liu et al., 2017a; Qian, 2019).
Model simulation and scenario change analysis are important tools for realizing the optimal allocation of land use (Ma et al., 2019), as well as important methods for obtaining the prior evaluation of land use planning and testing the effectiveness of spatial planning (Tobias and Price, 2020). In recent years, domestic and foreign scholars have carried out extensive studies on the quantitative prediction, spatial simulation and driving mechanisms of land resources (Li et al., 2020; Sun et al., 2021). Currently, the most commonly used simulation models of land use change are divided into quantitative prediction models, spatial prediction models and coupling models (Liu et al., 2017b). Quantitative prediction models include MARKOV model (Meng et al., 2015), system dynamics (SD) model (Portela and Rademacher, 2001) and multi-objective genetic algorithm (Yang et al., 2020). Common models for spatial prediction include cellular automata (CA) model (Yang et al., 2019; Yue et al., 2019), multi-agent system (MAS) (Liu et al., 2006), BP neural network (Fu et al., 2016), CLUE-S model (Zhao et al., 2019), etc. Coupling models include CA-Markov model (Luo et al., 2020) and SD-CA model (Li et al., 2021).
Compared with the traditional Land Use Simulation model, the Future Land Use Simulation (FLUS) model proposed by Liu Xiaoping’s team is formed by coupling the “top-down” SD model and the “bottom-up” CA model (Liu et al., 2017c; Liang et al., 2018a). The CA model is improved and an adaptive inertial competition mechanism based on roulette selection is proposed, which can effectively deal with the uncertainty and complexity of the mutual transformations of various land use types (Huang et al., 2020; Lin et al., 2020), thus improving the accuracy of land use change simulation. The FLUS model has been widely used in various research fields, such as land use scenario simulation and urban growth boundary demarcation (Chen et al., 2020; Zhang et al., 2020). However, the SD model used for predicting future urban demand is complex in structure and requires a large amount of socioeconomic data to fit the relationships between each component and sub-module (Liang et al., 2018a). Due to the limitations of data availability, this study uses the MARKOV chain model as the “top-down” demand prediction model of the FLUS framework, and determines the probability of transferring one type of land use to another type of land use according to the land use data of two periods, in order to realize the quantitative prediction. This adjustment has been successfully applied in many simulation studies (Liang et al., 2018b; Jiao et al., 2019; Sun and Liang, 2021).
In previous scenario simulations, the selection of the LUCC driving factors mostly focused on the static factors in society, the economy and nature. However, many studies have shown that dynamic factors such as policy planning, residents’ daily activities and regional industrial structure also have an important impact on land use change (Huang et al., 2017b; Jia et al., 2019; Wang et al., 2019). In world-class tourist destinations, the increase of daily dynamic human activities, by both tourists and local residents, will promote transportation and consumption activities, thereby stimulating the demand for construction land (Yang et al., 2014; Jiang, 2015; Tang et al., 2016). After Wang et al. (2020) included the Point of Interest (POI) data as the daily dynamic activity data of residents, the accuracy of the prediction model was improved.
Therefore, this paper explores the spatial layout and evolutionary characteristics of Beijing Municipal Administrative Center (Beijing MC) and Tongzhou District from the perspective of land use, introduces the dynamic data POI related to residents’ activities and tourism-related data as the driving factors of LUCC, and analyzes the spatial and temporal evolution pattern of LUCC in Tongzhou District, which has an important strategic position and tourism resources. The FLUS model was used to simulate the spatial distribution pattern of Beijing MC (Tongzhou District) in 2035 under multiple scenarios, to reveal the changes in land use under the influence of different human activities, and to assess the potential risks, which could provide reference for the decision-making related to sustainable land use and planning management in the region.

2 Methods

2.1 Study area

In 2015, the former Tongzhou District New Town planning and construction area was officially confirmed as Beijing MC, to serve as a concentrated carrier of Beijing’s non-capital functions. The whole Tongzhou District, including Beijing MC Region, is an important peripheral control area for the construction of a new type of urbanized city with sustainable development and connection with the coordinated development of Beijing, Tianjin and Hebei. In 2019, the Beijing Municipal Government issued the “Beijing Municipal Administrative Center Regulatory Detailed Planning (Block Level) (2016-2035)” (hereinafter referred to as “Planning”), which clearly requires the coordination of the three major spaces of “production, life, and ecology”. Relying on the Grand Canal Cultural Belt, the goal is to construct a harmonious, livable and sustainable new urbanized city with the capital as the core. Beijing MC (Tongzhou District) has world-class cultural and tourism resources such as the Grand Canal, Universal Studios and Zhangjiawan Wharf site. It shoulders the function of capital relocation in central Beijing and is undergoing historic transformations of land resource reallocation and land spatial layout optimization.
Tongzhou District is located in the southeast of Beijing, at the northern end of the Beijing-Hangzhou Grand Canal. Adjacent to Hebei province in the east, Tianjin in the south, Beijing Chaoyang District in the west, and Beijing Shunyi District in the north, it is an important hub connecting the Beijing-Tianjin-Hebei region and promoting coordinated development. The total area of Tongzhou District is 884.22 km2, excluding the area of Yizhuang New Town (Fig. 1a). The whole area is located in the alluvial plain of the Yongding River and the Chaobai River, and has flat terrain. It has the north Canal and Chaobai River as two major water systems, as well as the North Grand Canal, Chaobai River, Liangshui River, Wenyu River and Yunchaojian River and other major rivers running through the whole Tongzhou District.
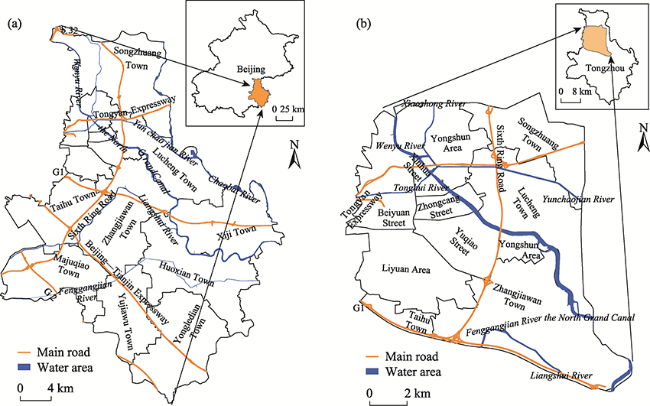
Fig. 1 Skematic Map of Tongzhou District (a) and Beijing Municipal Administrative Center (b)
Beijing MC (Tongzhou District) is situated in the northwest of Tongzhou District, covering an area of about 158 km2 (Fig. 1b). It is adjacent to the Urban area of Beijing, and has a high degree of urbanization, dense road networks and developed water systems. Five rivers converge here, forming an ecological green space around the canal system. The establishment of Beijing MC (Tongzhou District) is the key for taking over the function of the Beijing urban area and driving the development of the surrounding areas, and it is conducive to promoting the development of international business, green finance and cultural tourism industries based on the two major water systems.

2.2 Data sources

This study adopted the land use classification products of the Institute of Geographic Sciences and Natural Resources Research of the Chinese Academy of Sciences from 1980 to 2020, spanning 40 years and 5 periods. The land use types were divided into six categories: cultivated land, forest land, grassland, water area, residential land and unused land. The administrative divisions of towns and townships in Tongzhou District of Beijing were obtained from the government website, and the spatial distribution data of Beijing MC were accessed through the Planning (Table 1). Digital elevation model (DEM) data were obtained from the NASA Geographic Science database, and slope was calculated from DEM. Location traffic data came from Baidu Map. Proximity variables were measured by calculating the Euclidean distances between grids and adjacent road networks. The road networks include railways and first, second and third level roads. The density factor of POI data was calculated by an ArcGIS kernel density module and normalized, including access facilities (bus and subway stations, parking lots), convenience facilities (accommodation, catering and convenience stores) and auxiliary service facilities (banks, post offices and hospitals). Social and economic data were obtained from “Beijing Tongzhou Statistical Yearbook”. The specific values were entered into the vector attribute table of each administrative unit and used to calculate the unit area value, select the unit area social and economic attribute fields and the default pixel allocation type to realize the vector to raster transformation, and the linear function classification value method of the fuzzy membership tool was used to complete the normalization. All the above data were converted into raster data in the same projection coordinate system, and images with a cell size of 90 m×90 m were adopted.
Table 1 Data sources
Elements Types Name Year Source
Essential data Administrative
boundary
Administrative boundary of Tongzhou District, Beijing 2020 www.bjtzh.gov.cn
Beijing Municipal Administrative Center Planning District 2020 “Beijing Municipal Administrative Center Regulatory Detailed Planning (Block Level) (2016-2035)”
Land use data Land use data of Tongzhou District from 1980 to 2020 1980, 1990, 2000, 2010, 2020 Land use classification products from the Institute of Geographic Sciences and Natural Resources Research, Chinese Academy of Sciences
Driving factors Natural environment DEM 2008 https://earthdata.nasa.gov/
Slope Obtained from DEM calculation
Social and economic GDP 2018 “2019 Beijing Tongzhou Statistical Yearbook”
Population density Same as above
Location and
transportation
Road network 2020 Baidu Map
POI 2020 Same as above
Tourism Tourist attractions 2020 Same as above
Tourist capacity 2020 www.bjtzh.gov.cn
Restriction
factors
Ecological land Natural ecological land The “Planning”
Historical sites Tongzhou Ancient Building Protection Zone Same as above

2.3 Beijing MC (Tongzhou District) urban development scenario setting

According to the characteristics of the historical LUCC evolution and the goals of urban development planning, three scenarios were set up to simulate the spatial and temporal distribution of land use in Beijing MC (Tongzhou District) in the future.

2.3.1 Urbanization acceleration scenario

The urbanization acceleration scenario is mainly based on the characteristics of land use change during 1980-2010. Under this scenario, the socio-economic development is extensive, with high traffic accessibility and rapid urbanization, and farmland is greatly reduced. Construction land such as cities, roads and storage are the main components of living space, and its transfers and changes to production and ecological spaces are restricted. The main manifestations are the rapid increase of residential land, the rapid expansion of urban boundaries, and the rapid decrease of cultivated land. The four types of ecological land, forest land, grassland, water area and unused land, increased slightly.

2.3.2 Urbanization deceleration scenario

The scenario of urbanization deceleration is mainly based on the reference model of the characteristics of land use change during 2010-2020. In this scenario, urban expansion still dominates, but the speed of urbanization has slowed down, land use efficiency has improved, policies related to economic, industrial and land intensification, as well as ecological protection have been introduced, and society, economy, and the environment have gradually shown coordinated development. Land conversion in this scenario is the same as that in the urbanization acceleration scenario, but the conversion rates and proportions are different.

2.3.3 Sustainable urban development scenario

In this scenario, the economy, industry and land develop in coordination, urban land is restricted, ecological space is not occupied, other land types are transformed into ecological land, the tertiary industry and high and new technology are the main industries in the region, society, economy and the environment achieve green coordinated development, and the city as a whole realizes sustainable development. The main manifestations are that the increase in residential land is limited or even reduced, some cultivated land is converted into forest land and grassland, and the water area and forest land are greatly increased.
Combined with the characteristics of the natural evolution of land use and urban development planning of Tongzhou District, MARKOV chain was used to predict the land demand in 2035 (Table 2), and two sets of land use conversion cost matrices were designed (Table 3) that are consistent with the actual situation and future planning of Tongzhou District.
Table 2 Demand forecast of Markov chain in 2035 under multiple scenarios (Unit: cell)
Scenarios Cultivated land Forest land Grassland Water area Residential land Unused land
2020 57473 3316 1241 3283 43152 97
UA 46661 3656 1191 3226 53729 99
UD 56226 3801 1400 3273 43764 98
USD 25078 43425 1400 4907 33654 98

Note: UA is urbanization acceleration scenario; UD is urbanization deceleration scenario; and USD is urban sustainable development scenario; 1 cell = 90 m×90 m.

Table 3 Conversion cost matrix of LUCC under multiple scenarios
UA and UD scenario USD scenario
Cultivated land Forest land Grassland Water area Residential land Unused land Cultivated land Forest land Grassland Water area Residential land Unused land
1 1 1 1 1 0 1 1 1 1 0 0
0 1 0 0 1 0 0 1 0 0 0 0
0 0 1 0 0 0 0 0 1 0 0 0
1 0 0 1 1 0 0 0 0 1 0 0
0 0 0 0 1 0 1 1 0 0 1 0
0 0 0 0 0 1 0 0 0 0 0 1

Note: UA is urbanization acceleration scenario; UD is urbanization deceleration scenario; and USD is urban sustainable development scenario.

2.4 FLUS model

The FLUS model was improved and developed by Liu et al. (2017c) based on the CA principle. This principle involves estimating the development probability of each land use type in a region on the basis of calculating the land use data in the base period and the data of each driving factor that will influence it by using the artificial neural network model algorithm (ANN). Then, the development probability is combined with the neighborhood influence factor, adaptive inertia coefficient and conversion cost to derive the overall conversion probability of each cell, and finally the simulation results are obtained through the roulette competition mechanism. The simulation flow chart for the FLUS model adopted in this paper is shown in Fig. 2.
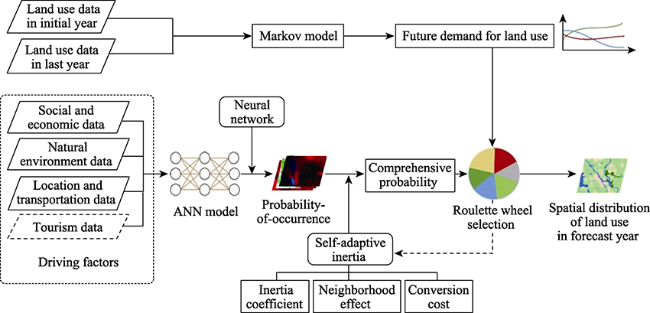
Fig. 2 FLUS model simulation flow chart
The land demand in 2035 is predicted by the Markov chain, and the formula is as follows:
$\begin{array}{*{20}{c}}{S(t + 1) = S(t) \times {P_{ij}}}\end{array}$
where S(t) and S(t+1) respectively represent the number of plaques at t and t+1; and Pij is the matrix of the transition probability.
The ANN with multiple input and output neurons consists of three types: input layer, hidden layer, and output layer, which can be used to estimate the probability-of- occurrence for each type of land use in a particular raster:
$\begin{array}{*{20}{c}}\begin{array}{l}P\left( {p,k,t} \right) = \mathop \sum \limits_j {\omega _{j,k}} \times {\rm{sigmoid}}\left( {ne{t_j}\left( {p,t} \right)} \right) = \\\;\;\;\;\;\;\;\;\;\;\;\;\;\;\;\;\mathop \sum \limits_j {\omega _{j,k}} \times \frac{1}{{1 + {{\rm{e}}^{ - ne{t_j}\left( {p,t} \right)}}}}\end{array}\end{array}$
where $P\left( {p,k,t} \right)$ is the probability-of-occurrence of land use type k in grid cell p at training time t; ωj,k is the adaptive weight between the hidden layer and the output layer; sigmoid is the activation function which is effective for building the connection between the hidden layer and the output layer; and $ne{t_j}(p,t)$ is the signal received by neuron j from all the input neurons on grid cell p at time t.
The core of the adaptive inertia competition mechanism in the FLUS model is adaptive inertia. Specifically, the inertia coefficient of each type of land is determined by the difference between the existing land quantity and the land demand, and it is adjusted adaptively in an iterative process, so as to make the quantity of each type of land develop towards the predetermined goal. The inertia coefficient of land type k at iteration time t is:
$Intertia_k^t = \left\{ \begin{array}{l}Intertia_k^{t - 1}{\rm{\;\;\;\;\;\;\;\;if }}\left| {D_k^{t - 1}} \right| \le \left| {D_k^{t - 2}} \right|\\Intertia_k^{t - 1} \times \frac{{D_k^{t - 2}}}{{D_k^{t - 1}}}{\rm{\;\;\;}}if\;D_k^{t - 1} < D_k^{t - 2} < 0\\Intertia_k^{t - 1} \times \frac{{D_k^{t - 1}}}{{D_k^{t - 2}}}{\rm{\;\;\;}}if\;0 < D_k^{t - 2} < D_k^{t - 1}\end{array} \right.$
Where ${\rm{\;}}D_k^{t - 1}$ denotes the difference between the macro demand and the allocated amount of land use type k until iteration time t-1.
By considering the probability-of-occurrence, neighborhood effect, inertia coefficient and conversion cost, the combined probability of a cell being occupied by a specific land use type is estimated using the following equation:
$TP_{p,k}^t = P\left( {p,k,t} \right) \times \Omega _{p,k}^t \times Intertia_k^t \times (1 - s{c_{c \to k}})$
where $s{c_{c \to k}}$ denotes the conversion cost from the original land use type c to the target type k; and $\Omega _{p,k}^t$ denotes the neighborhood effect of land use type k on grid cell p at iteration time t, which is calculated by the following formula:
$\Omega _{p,k}^t = \frac{{\sum\limits_{N \times N} {{\rm{con}}\left( {c_p^{t - 1} = k} \right)} }}{{N \times N - 1}} \times {\omega _k}$
where $\mathop \sum \limits_{N \times N} {\rm{con}}\left( {c_p^{t - 1} = k} \right)$ represents the total number of grid cells occupied by the land use type k at the last iteration time t–1 within the N × N window; and ${\omega _k}$ is the neighborhood effect of various land use types.

3 Results

3.1 Spatial and temporal evolution patterns of LUCC in Beijing MC (Tongzhou District)

3.1.1 LUCC macro structure of Tongzhou District from 1980 to 2020

The spatial and temporal changes of land use in Tongzhou District were analyzed by using 1980 as the base year and every 10 year period as the evaluation cycle.
During the 30 years from 1980 to 2010, the urbanization process in Tongzhou District was constantly accelerating, with the large area of residential land increasing, and the urban expansion concentrated in Beijing MC area, Taihu Town and Majuqiao Town. Tongzhou District gradually formed a linear urban expansion pattern “along the Grand Canal along the Sixth Ring Road” (Fig. 3). During this period, the cultivated land which included paddy field and dry land decreased, while the paddy fields disappeared in Taihu Town and Zhangjiawan Town, and the forest land increased but was scattered in a small area. The unused land in the northwest was fully developed, and the grassland was scattered. The land use type evolved from mainly cultivated land in 1980 to a situation where the proportions of cultivated land and residential land were gradually converging (Fig. 4). After 2010, all the different kinds of land use except forest land tended to be stable, the cultivated land remaining was only dry land, the urban expansion slowed down significantly, and the urban boundary was relatively fixed. The effect of “returning farmland to forest and grassland” in Taihu Town and Zhangjiawan was apparent, and the forest land around the North Grand Canal had increased in concentration and scale, gradually forming a pattern of urban-rural differentiation and land intensive development from the northwest to the southeast.
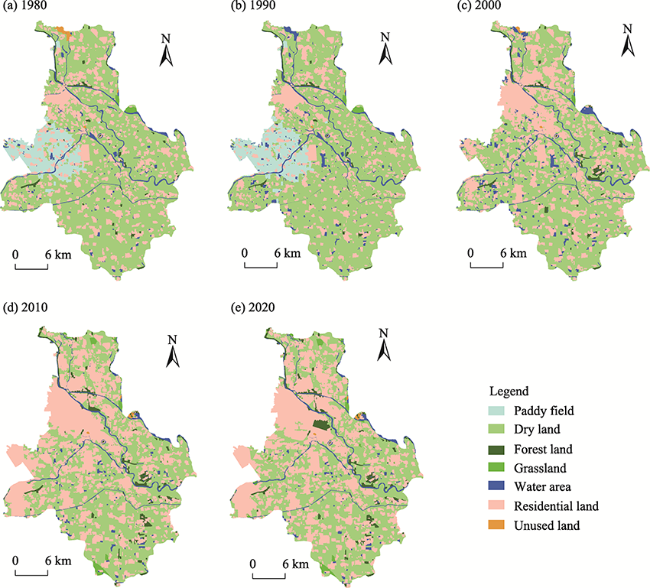
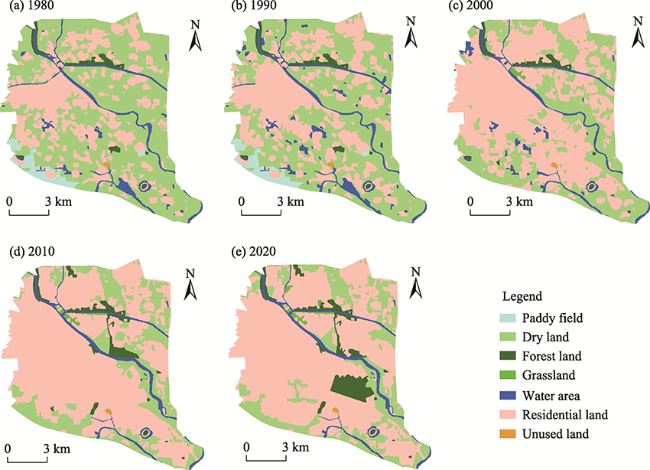
Fig. 3 Spatial and temporal distributions of LUCC in Tongzhou District from 1980 to 2020
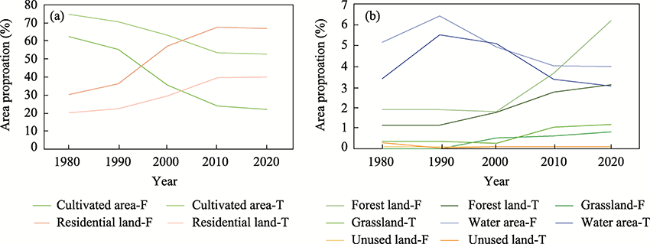
Fig. 4 The proportions of land use area in the five periods in Beijing Municipal Administrative Center (Tongzhou District)

Note: F is Beijing MC; T is Tongzhou District.

3.1.2 LUCC macro structure of Beijing MC from 1980 to 2020

As the most typical area of urbanization in Tongzhou District, Beijing MC’s land use change shows characteristics of spatial and temporal evolution that are similar to Tongzhou District (Fig. 5). From 1980 to 2010, the urban sprawl was obvious. Residential land expanded outward along the North Grand Canal and became concentrated along the Sixth Ring Road. The forest land increased slightly, and the water area decreased. From 2010 to 2020, the land use in the region remained stable, the urban expansion rate slowed down significantly, and a large area of forest land became concentrated, while the grassland and unused land were still sparsely distributed. However, due to the high degree of urbanization, Beijing MC did not show the pattern of urban-rural differentiation.
Fig. 5 Spatial and temporal distributions of LUCC in Beijing Municipal Administrative Center from 1980 to 2020
From the perspectives of temporal characteristics, spatial distribution and area changes, Beijing MC has characteristics of temporal and spatial evolution that are similar to Tongzhou District, with the reduction of cultivated land and urban expansion as the main points. The year 2010 was the time node, after which the urban expansion slowed down significantly, the land use for residential areas was concentrated around the Sixth Ring Road and the North Grand Canal, and the areas of unused land and grassland were small and scattered.
In conclusion, the macro structure of LUCC in Beijing MC (Tongzhou District) presents four main characteristics. 1) The land use change in the past 40 years from reform and opening up is mainly an urbanization process, which is divided into the urbanization acceleration stage from 1980 to 2010 and the urbanization deceleration stage from 2010 to 2020. Beijing MC area is the typical representative region of the urbanization process in Tongzhou District, which has characteristics of spatial and temporal evolution similar to those of Tongzhou District. 2) Before 2010, the area of Beijing MC (Tongzhou District) changed greatly, but after 2010, the areas and spatial distributions of the land types tended to be stable, and the ranges of change decreased. In the process of land use evolution, the types of land use changed from more to less, the ranges of areas changed from large to small, and the boundary of land use changed from fuzzy to clear. A certain degree of land zoning has appeared in Tongzhou District. 3) Before 2010, Beijing MC (Tongzhou District) mainly realized urban expansion through the development of cultivated land. The decrease of cultivated land is the same as the increase of residential land. In the past 40 years, the proportion of ecological land was small and the change was small, in which the water area and unused land decreased, while forest and grassland increased. Grassland and unused land were small and unstable, and their distributions were not regular.

3.2 Simulation results and analysis

3.2.1 Accuracy test

The FLUS model was used to simulate the land use distribution in 2010 under the accelerating urbanization scenario and in 2020 under the decelerating urbanization scenario (Fig. 6 and Fig. 7). The test Kappa coefficients of the two scenario simulations are 0.757 and 0.753, and the overall prediction accuracy is 0.86. A Kappa value between 0 and 1 and greater than 0.7 indicates that the simulation results can be accepted (Luo et al., 2010), that is, the model is suitable for the simulation of future land use space in Tongzhou District.
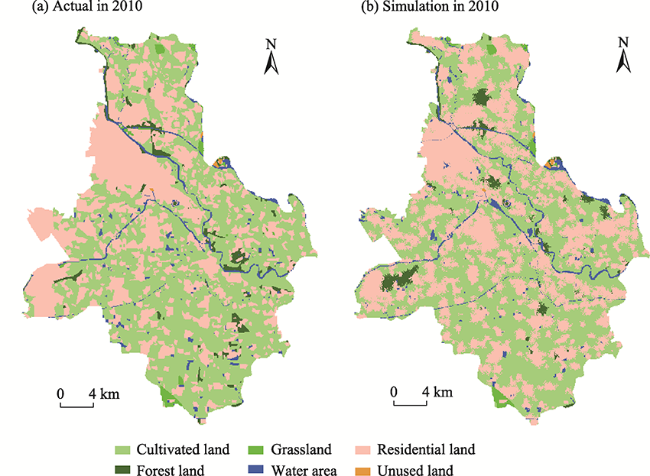
Fig. 6 Real and simulated distributions of LUCC in 2010 under the scenario of urbanization acceleration
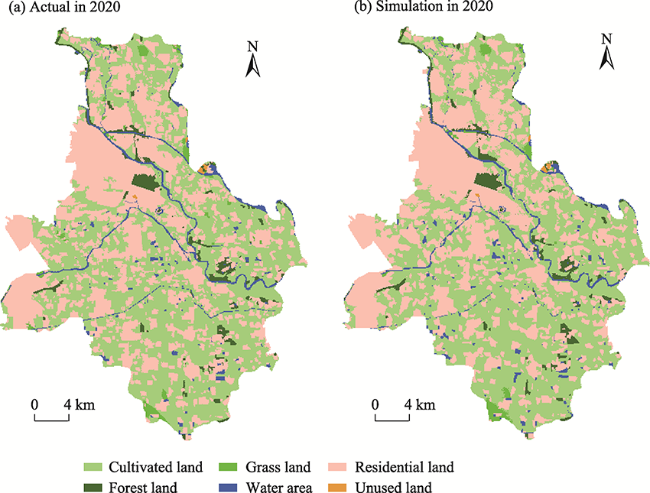
Fig. 7 Real and simulated distributions of LUCC in 2020 under the scenario of urbanization deceleration

3.2.2 Results of multi-scenario simulation

The land use change in Tongzhou District in 2035 was simulated based on three scenarios of urbanization acceleration, deceleration and sustainable development (Fig. 8). In the three scenarios, the cultivated land decreased and the forest land increased, but there are large differences in the ranges and spatial distributions of the changes.
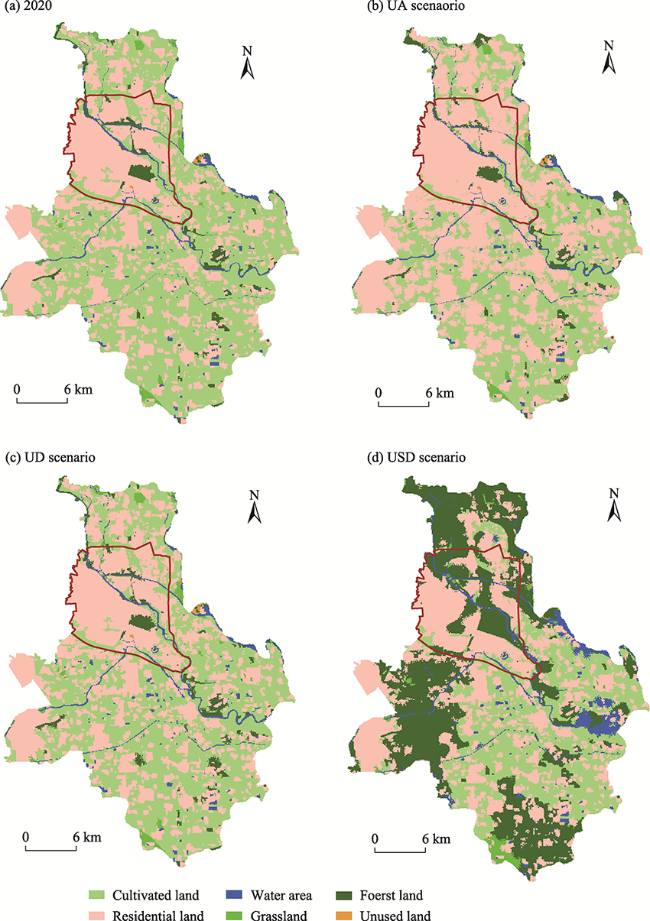
Fig. 8 LUCC simulation distributions in 2035 under multiple scenarios

Note: UA is urbanization acceleration scenario; UD is urbanization deceleration scenario; USD is urban sustainable development scenario.

(1) Under the scenario of urbanization acceleration, the residential land will increase by nearly 10% compared with 2020, and the urban boundary will expand, forming a radial city pattern with the Beijing MC as the core, surrounded by small towns such as Songzhuang, Taihu, Majuqiao and Zhangjiawan. The overall change of ecological land use is small, in which the forest land increased in a small area around the Tongzhou water system, while the water area and grassland decreased in a small area, and the unused land remained unchanged.
(2) Under the scenario of urbanization deceleration, the six types of land use are basically the same as in 2020, and the land area and spatial layout are basically stable. The areas of forest land, grassland and residential land increase slightly, the urban boundary is stable, the forest land expands from the original forest land to the surrounding area, and is increased around the water area. The small areas of cultivated land and water area decreased, while the unused land remained unchanged.
(3) Under the urban sustainable development scenario, the numbers and spatial distributions of land use types are obviously different from the first two scenarios. Large-scale forest land appears, forming a one-belt and three-point forest land distribution pattern. That is, it is surrounded by Songzhuang in the north, connected with Taihu Park and Majuqiao Wetland Park in the west, linked with Yongledian Town in the south, and extended along the North Canal River System in the middle. The residential land is concentrated in the west and northwest of Tongzhou, and the water and cultivated land are concentrated in the east and southeast of Tongzhou. There are great differences in land types in the upper and lower reaches of the North Grand Canal.
A comprehensive comparison of the spatial distributions and numerical characteristics of the three scenarios shows three main trends (Table 4). 1) Under the urbanization acceleration scenario, the cultivated land decreases and the residential land occupies 50% of the total area, while the ecological land occupies the lowest proportion. The overall spatial distribution of the land is scattered and random. 2) The urbanization deceleration scenario is slightly better than the urbanization acceleration scenario. The expansion of residential land and the occupation of cultivated land are limited, and the ecological land increases slightly. The land use patterns are formed and tend to be stable. 3) The urban sustainable development scenario is optimal, with more ecological land and less residential land, and the land use space is reasonably distributed with respect to zoning and classification. Under this scenario, not only can the ecological environment be optimized, the land use be intensive, and the rational distribution and optimization of land resources be realized, but the improvement of regional economic efficiency and the adjustment of industrial structure can also be promoted to realize the sustainable development of the city.
Table 4 The proportions of land use types in 2020 and 2035 under multiple scenarios
Scenarios Cultivated land (%) Forest land (%) Grassland (%) Water area (%) Residential land (%) Unused land (%)
2020 52.85 3.08 1.17 3.03 39.77 0.09
2035-UA scenario 43.09 3.36 1.16 2.96 49.34 0.09
2035-UD scenario 51.94 3.49 1.29 3.01 40.18 0.09
2035-USD scenario 28.95 34.34 1.29 4.51 30.90 0.02

Note: UA is urbanization acceleration scenario; UD is urbanization deceleration scenario; and USD is urban sustainable development scenario.

3.3 Analysis of the consisitency between multi-scenario simulation and Beijing MC planning

In 2019, Beijing Municipal Government issued the Plan (2016-2035) to highlight the urban characteristics of a water city, blue and green interweaving, and cultural inheritance, and identified six scenery zones: riverside, cultural creativity, administrative, livable life, historical culture and Universal theme park. In order to give full play to the function of Beijing MC in undertaking the function of the central city, six functional zones were defined, which are dominated by administrative, business service and cultural tourism. In order to highlight the role of the “one belt, one axis and one ring” framework in guiding the urban spatial pattern and strengthen the hierarchical management and control of the urban landscape features, the key areas were designated as the primary and secondary control areas, and other areas as the tertiary control areas. This study analyzed the compatibility of the simulated land use distribution under the three scenarios of Beijing MC with the three zoning plans of scenery area, functional area and control area, and thus verified the rationality of the planned land use.

3.3.1 Analysis of functional areas

Among the functional areas, the three main functions of Beijing MC are business services, administrative and cultural tourism. The land use types and distribution of the business service area and the administrative scenery area are similar, and the proportions of residential land are high under the three scenarios. Under the sustainable scenario, the forest land increases, and the inner ecological environment of the town improves. In the three scenarios of the cultural tourism area, residential land is the main land type, while ecological land did not increase in the sustainable scenario. The urban integrated service (civic center) in the “Planning” is quite different from the results under the scenarios of urbanization acceleration and deceleration. As the urban green center, there is still a large area of residential land, and the ecological construction land is not reasonable. In the scenario of urban sustainable development, the types of land used in each planning area are more diversified and the layout is more reasonable, both of which are conducive to promoting the multi-functional integration of business, administration, culture, tourism and residence at the regional level. Therefore, in the scenario of sustainable development, the 2035 LUCC forecast simulation of Beijing MC is highly consistent with the land use in the Planning (Fig. 9A1-A3), but the ecological land use area in the cultural tourism area is small, which is a notable deviation from the expectation in the Planning.
Fig. 9 Comparison of multi-scenario simulation results and zoning planning for land use in Beijing Municipal Administrative Center in 2035

Note: A is Functional Planning Area; B is Control Planning area; C is Scenery Planning Area. Number one is the scenario of urbanization acceleration, number two is the scenario of urbanization deceleration, and number three is the scenario of urban sustainable development.

3.3.2 Analysis of control area

The primary control area includes the administrative scenery area, the intersection of five rivers, the urban green center and other key functional areas, and has more ecological land. Under the scenarios of urbanization acceleration and deceleration, this area has more residential land, but less ecological land. Under the scenario of urban sustainable development, the area of forest land increases greatly. The secondary control area mainly includes one belt and one axis, the ecological civilization belt with the North Grand Canal as the core and the innovative development axis relying on the sixth ring road. Under the scenario of urban sustainable development, the arrangement of “greenbelt becomes a belt and section becomes an axis” appears. Therefore, under the scenario of urban sustainable development, the predictive simulation of the control area is highly consistent with the land use in the Planning (Fig. 9B1-B3).

3.3.3 Analysis of scenery area

In the scenery area, the riverside scenery area extends along the North Grand Canal. Under the scenario of sustainable urban development, a blue-green interwoven ecological space along the ecological civilization belt is formed, connecting the cultural relics “Three Temples and One Pagoda”, the important functional area “Urban Green Center” and the world cultural heritage of the Grand Canal. This allows the realization of the multi-functional integration of living and recreation, business and leisure, tourism and sightseeing, natural countryside and historical culture in the waterside space (Fig. 9C1-C3).
To sum up, the predicted simulation of Beijing MC under the LUCC scenario of sustainable urban development in 2035 is highly consistent with the land use in the Planning, but the prediction results of multiple scenarios in some regions deviate from the Planning to some extent. In the three scenarios, the cultural tourism functional area, the three levels of control area and the livable living scenery area are dominated by residential land, while the ecological land area is relatively small. Studies show that the number, scale and distance characteristics of urban green space have a significant impact on the physical and mental health and well-being of residents and the satisfaction of tourists (Sonti et al., 2020; Yu et al., 2020). Therefore, the areas of ecological land within the cultural tourism area and the residential area still need to be improved in the future.

4 Discussion

Generally speaking, the land use dynamic system is complex and changeable, so it is difficult for any land use change simulation model to fully describe the model of land change (Verburg et al., 2008; Zheng et al., 2021). This paper analyzes the pattern of land use evolution in Beijing MC (Tongzhou District) in the past 40 years, and simulates the land use distribution in 2035 under multiple scenarios. Some achievements have been made, but there are still some deficiencies.
The simulation accuracy of land use change is not only affected by the model and initial data, but it is also affected by the size of the study area, the time span of the validation simulation and the complexity of the land use changes. The simulation accuracy varies for different models and research objects. For example, Liu et al. (2017c) used the FLUS model to simulate the land use situation in China in 2010 based on the data of 2000, and their Kappa coefficient was 0.67, with an overall accuracy of 75.00%. Ma et al. (2021) used the FLUS model to simulate the land use layout of Jianghuai Ecological Economic Zone in 2015 based on the data of 2000, and the Kappa coefficient was 0.83, with an overall accuracy of 85.57%. Zhao et al. (2020) used CA-Markov to simulate the land use distribution of the Pearl River Delta in 2015 based on 2005 data, and the Kappa coefficient was 0.8. The simulation accuracy of different regional scales using the same model and different models at the same regional scale are different. Saadani et al. (2020) used the CA-Markov model to simulate Moroccan urban expansion, and the Kappa coefficients in 1999, 2006, 2010 and 2018 were 0.79, 0.84, 0.91 and 0.93, respectively, indicating that the earlier the simulation time and the longer the simulation span, the lower the accuracy of the model. In this paper, Tongzhou District with a high complexity of land use change was selected, and the time span of the study was extended from the usual 20 years to 40 years. The overall accuracy of the model reached 86% and the Kappa coefficient is higher than 0.75, so it could effectively simulate some uncertainties and changes, and meet the requirements of prediction simulation. This study provides certain data and methodological support for the construction of Beijing MC (Tongzhou District) as a harmonious livable capital. However, due to the large research time span, numerous external factors affecting land change in the research region, and limited data collection, in comparison to the low error rates of other models in some regions, either the model in this paper still needs to be further improved or a high-precision model more suitable for the research area should be found. As another limitation, remote driving factors outside the basic farmland control line, urban boundary control line and administrative boundary were not incorporated into the model used here. Of course, the most important factor is how the policy and planning will affect future land use development directly, however, this is also the most uncertain factor. Hopefully scientific methods can be adopted to evaluate such uncertain factors in future studies to improve the accuracy of the simulations. The incomplete nature of the driving factors and limiting factors, and the uncertainty of coupling effects between factors, may reduce the reliability of simulation results, and these factors are worthy of further study.
The construction of Beijing MC needs to consider policy factors, such as population restriction and structural adjustments of emerging industries. Meanwhile, as an important influencing factor, tourism is still in its infancy, and relevant data are limited to the number of scenic spots and the number of tourists. In the future, we can consider this factor from the perspective of the multiple elements of tourism destinations, to more comprehensively and systematically evaluate the impact of cultural and tourism development. Exploring the recreational space pattern of Beijing MC (Tongzhou District) after it has famous tourism resources, such as the World Cultural Heritage Grand Canal, Universal Theme Park and Songzhuang Art Town, is also an issue that needs to be further investigated in the future.

5 Conclusions

In the past 40 years, the speed of urbanization in Beijing MC (Tongzhou District) has changed from fast to slow. Tongzhou District has evolved from mainly cultivated land in 1980 to a situation where cultivated land and residential land occupy similar proportions in 2020, and Beijing MC has evolved from mainly cultivated land to residential land. As a typical urbanization region of Tongzhou District, Beijing MC has spatial and temporal evolution characteristics that are similar to those of the whole Tongzhou District. From 1980 to 2010, during the acceleration stage of urbanization, Beijing MC (Tongzhou District) formed a linear urban expansion pattern of “along the Grand Canal along the Sixth Ring Road”. During the deceleration period from 2010 to 2020, the land distribution was stable, and Tongzhou District formed a pattern of urban and rural differentiation and land intensive development from northwest to southeast.
The main land type changes in Tongzhou under the three scenarios in 2035 are consistent, but the ranges and spatial distributions of the changes are quite different. The quantity and spatial distribution of land under the sustainable development scenario are obviously different from those under the other two scenarios. Large-scale forest land appears, living and production land is divided into obvious zones, and it is characterized by land use intensification, rational distribution and optimal development of the land resources. In the analysis of the fit degree for the three Beijing MC zoning plans, the three scenarios are dominated by residential land. In the sustainable development scenario, the internal ecological environment of most typical regions is significantly improved, which is highly consistent with the land use plan. In the internal analysis and simulation of the three major zoning plans, the cultural tourism functional area, the three level of control area and the livable living scenery area are all dominated by residential land, while the ecological land area is relatively small. This prediction result has certain deviations from the “Planning”. Therefore, in the process of urban construction, the areas of ecological land within the cultural tourism areas and the residential areas still need to be improved.
The simulation results show that some rivers in the central part of Tongzhou District will have fewer branches and less water, and the demand for water for agricultural production and domestic life will be large. The impact of the surrounding ecological environment and the demand for water may lead to the reduction of river water volume. The residential land in the northwest of Tongzhou District is concentrated to form a large-scale living space, and the large cultivated land area and rich water resources in the southeast form a production space, so together they form a living and production space with obvious functions in the northwestern and southeastern regions. In addition, the rural areas in the southeast have more cultivated land and scattered villages and towns. The distances between villages and cities and the differences in geographical locations between villages and towns may cause problems such as insufficient urban-rural connections and unbalanced township development, which will need further attention in the development process.
[1]
Chen G, Li X, Liu X, et al. 2020. Global projections of future urban land expansion under shared socioeconomic pathways. Nature Communications, 11(1): 537. DOI: 10.1038/s41467-020-14386-x.

DOI

[2]
Fu L, Hu Y C, Zheng X Q. 2016. The prediction of urban growth boundary based on BP artificial neural networks: An application to Beijing. China Land Sciences, 30(2): 22-30. (in Chinese)

[3]
Huang D, Li R D, Qiu J, et al. 2017b. Analysis on spatio-temporal variation of land use and its policy-driven factors in Wuhan Metropolitan Area. Journal of Geo-information Science, 19(1): 80-90. (in Chinese)

[4]
Huang J C, Lin H X, Qi X X. 2017a. A literature review on optimization of spatial development pattern based on ecological-production-living space. Progress in Geography, 36(3): 378-391. (in Chinese)

[5]
Huang K, Dai W Y, Huang W L, et al. 2020. Study on the delimitation of urban growth boundary based on FLUS model and Kinetic Energy Theorem. Journal of Geo-information Science, 22(3): 557-567. (in Chinese)

[6]
Jia K, Zhang C, Yang Y Z, et al. 2019. Delimitation of urban growth boundary based on the coordination of ecology and residential activity spaces: A case study of Jinan, China. Journal of Resources and Ecology, 10(5): 518-524.

DOI

[7]
Jiang Y Y. 2015. A study on spatio-temporal changes of land use in the process of tourism development: A case study of Yulong County in Yunnan Province. Ecological Economy, 31(2): 129-133. (in Chinese)

[8]
Jiao M Y, Hu M M, Xia B C. 2019. Spatiotemporal dynamic simulation of land-use and landscape-pattern in the Pearl River Delta, China. Sustainable Cities and Society, 49: 101581. DOI: 10.1016/j.scs.2019.101581.

DOI

[9]
Kuang W H. 2019. Issues regarding on spatial pattern change of national land space and its overall implementation on beautiful vision in new era. Resources Science, 14(1): 23-32. (in Chinese)

[10]
Li F Z, Wang R F, Lu S S, et al. 2021. Spatiotemporal simulation of green space by considering socioeconomic impacts based on a SD-CA Model. Forests, 12(2): 202. DOI: 10.3390/f12020202.

DOI

[11]
Li Z G, Yang Z S. 2007. Research progress of land ecological security in China. China Safety Science Journal, (12): 5-12. (in Chinese)

[12]
Li Z T, Li M, Xia B C. 2020. Spatio-temporal dynamics of ecological security pattern of the Pearl River Delta urban agglomeration based on LUCC simulation. Ecological Indicators, 114: 106319. DOI: 10.1016/j.ecolind.2020.106319.

DOI

[13]
Liang X, Liu X P, Li D, et al. 2018. Urban growth simulation by incorporating planning policies into a CA-based future land-use simulation model. International Journal of Geographical Information Science, 32(11): 2294-2316.

DOI

[14]
Liang X, Liu X P, Li X, Chen Y M, et al. 2018. Delineating multi-scenario urban growth boundaries with a CA-based FLUS model and morphological method. Landscape and Urban Planning, 177: 47-63.

DOI

[15]
Lin W B, Sun Y M, Nijhuis S, et al. 2020. Scenario-based floodrisk assessment for urbanizing deltas using future land-use simulation (FLUS): Guangzhou Metropolitan Area as a case study. Science of the Total Environment, 739: 139899. DOI: 10.1016/j.scitotenv.2020.139899.

DOI

[16]
Liu J H, Xu L J, Pan X J, et al. 2017b. Research progress on land-use and land-cover change scenario simulation. Journal of Hangzhou Normal University (Natural Science), 16(5): 551-560. (in Chinese)

[17]
Liu J Y, Kuang W H, Zhang Z X, et al. 2014. Spatiotemporal characteristics, patterns and causes of land use changes in China since the late 1980s. Acta Geographica Sinica, 69(1): 3-14. (in Chinese)

[18]
Liu X P, Li X, Ai B, et al. 2006. Multi-agent systems for simulating and planning land use development. Acta Geographica Sinica, 61(10): 1101-1112. (in Chinese)

[19]
Liu X P, Liang X, Li X, et al. 2017c. A future land use simulation model (FLUS) for simulating multiple land use scenarios by coupling human and natural effects. Landscape and Urban Planning, 168: 94-116.

DOI

[20]
Liu X Y, Li S L, Qin M. 2017a. Urban spatial structure and regional economic efficiency: Also on the mode choice of China urbanization development road. Management World, (1): 51-64. (in Chinese)

[21]
Luo G P, Yin C Y, Chen X, et al. 2010. Combining system dynamic model and CLUE-S model to improve land use scenario analyses at regional scale: A case study of Sangong watershed in Xinjiang, China. Ecological Complexity, 7(2): 198-207.

DOI

[22]
Luo Z W, Hu X J, Wei B J, et al. 2020. Urban landscape pattern evolution and prediction based on multi-criteria CA-Markov model: Take Shanghang County as an example. Economic Geography, 40(10): 58-66. (in Chinese)

[23]
Ma B Y, Huang J, Li S C. 2019. Optimal allocation of land use types in the Beijing-Tianjin-Hebei urban agglomeration based on ecological and economic benefits trade-offs. Progress in Geography, 38(1): 26-37. (in Chinese)

[24]
Ma S, Qiao Y, Jiang J, et al. 2021. Incorporating the implementation intensity of returning farmland to lakes into policymaking and ecosystem management: A case study of the Jianghuai Ecological Economic Zone, China. Journal of Cleaner Production, 306: 127284. DOI: 10.1016/j.jclepro.2021.127284.

DOI

[25]
Meng C, Lu X H, Peng M J, et al. 2015. A land layout simulation model based on CA and Markov-C 5.0 classification. China Land Science, 29(6): 82-88. (in Chinese)

[26]
Portela R, Rademacher I. 2001. A dynamic model of patterns of deforestation and their effect on the ability of the Brazilian Amazonia to provide ecosystem services. Ecological Modelling, 143(1): 115-146.

DOI

[27]
Qian Q. 2019. Urban sustainable intensive land use evaluation and prediction research. Beijing, China: China University of Geosciences. (in Chinese)

[28]
Saadani S, Laajaj R, Maanan M, et al. 2020. Simulating spatial-temporal urban growth of a Moroccan metropolitan using CA-Markov model. Spatial Information Research, 28(5): 609-621.

DOI

[29]
Sonti N F, Campbell L K, Svendsen E S, et al. 2020. Fear and fascination: Use and perceptions of New York City’s forests, wetlands, and landscaped park areas. Urban Forestry & Urban Greening, 49: 126601. DOI: 10.1016/j.ufug.2020.126601.

DOI

[30]
Sun D Z, Liang Y J. 2021. Multi-scenario simulation of land use dynamic in the Loess Plateau using an improved Markov-CA model. Journal of Geo-information Science, 23(5): 825-836. (in Chinese)

[31]
Sun S T, Lin J, Song Y, et al. 2021. Progress review on land science research in 2020 and prospects for 2021: The sub-report on land resources, land use and spatial planning. China Land Science, 35(2): 103-112. (in Chinese)

[32]
Tang F J, Huang Z F, Chen X Y. 2016. Land use change around theme park and its driving factors: Taking China Dinosaur Park in Changzhou City as an example. Areal Research and Development, 35(5): 133-137. (in Chinese)

[33]
Tobias S, Price B. 2020. How effective is spatial planning for cropland protection? An assessment based on land-use scenarios. Land, 9(2): 1-20.

DOI

[34]
Verburg P H, Eickhout B, van Meijl Hans. 2008. A multi-scale, multi-model approach for analyzing the future dynamics of European land use. The Annals of Regional Science, 42(1): 57-77.

DOI

[35]
Wang Y Z, Duan X J, Yang Q K, et al. 2019. Spatial-temporal characteristics and driving factors of urban construction land in Jiangsu Province in the last 30 years. Resources and Environment in the Yangtze Basin, 28(7): 1531-1540. (in Chinese)

[36]
Wang Z Y, Zhang K, Ding Z P, et al. 2020. Delineation of urban growth boundary based on improved FLUS model considering dynamic data. Journal of Geo-information Science, 22(12): 2326-2337. (in Chinese)

[37]
Yang J, Li Y C, Xi J C, et al. 2014. The coastal tourist town’s land use spatial pattern evolution and driving forces under the background of tourism urbanization: A case study of Dalian Jinshitan National Tourist Holiday Resort. Journal of Natural Resources, 29(10): 1721-1733. (in Chinese)

[38]
Yang J, Shi F, Sun Y, et al. 2019. A cellular automata model constrained by spatiotemporal heterogeneity of the urban development strategy for simulating land-use change: A case study in Nanjing City, China. Sustainability, 11(15): 1-19.

DOI

[39]
Yang L, Xie Y W, Zong L L, et al. 2020. Land use optimization configuration based on multi-objective genetic algorithm and FLUS model of agro-pastoral ecotone in Northwest China. Journal of Geo-information Science, 22(3): 568-579.

[40]
Yang R, Liu Y S, Long H L. 2015. The study on non-agricultural transformation co-evolution characteristics of “population-land-industry”: Case study of the Bohai Rim in China. Geographical Research, 34(3): 475-486. (in Chinese)

[41]
Yu J L, Yan L J, Deng J Y, et al. 2020. Study on the influence of urban green space on the physical and mental welfare of resident. Acta Ecologica Sinica, 40(10): 3338-3350. (in Chinese)

[42]
Yue D X, Yang C, Jiang B H, et al. 2019. Spatio-temporal pattern prediction of the biocapacity in the Shiyang River Basin on the basis of the CA-Markov model. Acta Ecologica Sinica, 39(6): 1993-2003. (in Chinese)

[43]
Zhang X R, Li A N, Nan X, et al. 2020. Multi-scenario simulation of land use change along China-Pakistan Economic Corridor through coupling FLUS model with SD model. Journal of Geo-information Science, 22(12): 2393-2409. (in Chinese)

[44]
Zhao X, Tang F, Zhang P T, et al. 2019. Dynamic simulation and characteristic analysis of county production-living-ecological spatial conflicts based on CLUE-S model. Acta Ecologica Sinica, 39(16): 5897-5908. (in Chinese)

[45]
Zheng Y M, Wang S D, Cao Y, et al. 2021. Assessing the ecological vulnerability of protected areas by using Big Earth Data. International Journal of Digital Earth, 14(11): 1624-1637.

DOI

Outlines

/