Carbon Emission and Sustainable Development

Analysis of the Driving Factors of Carbon Emissions and Countermeasures for Carbon Emission Reduction in Hebei Province

  • WANG Bo , 1, 2 ,
  • WANG Limao , 1, 2, * ,
  • XIANG Ning 1, 2 ,
  • QU Qiushi 3 ,
  • XIONG Chenran 4
Expand
  • 1. Institute of Geographic Sciences and Natural Resources Research, Chinese Academy of Sciences, Beijing 100101, China
  • 2. College of Resources and Environment, University of Chinese Academy of Sciences, Beijing 100049, China
  • 3. School of Economics, Hebei GEO University, Shijiazhuang 050031, China
  • 4. School of Tourism and Culture Industry, Guizhou University, Guiyang 550025, China
* WANG Limao, E-mail:

WANG Bo, E-mail:

Received date: 2021-03-14

  Accepted date: 2021-06-30

  Online published: 2022-03-09

Supported by

The National Natural Science Foundation of China(71991481)

The National Natural Science Foundation of China(71991484)

The National Natural Science Foundation of China(41971163)

The Humanities and Social Science Research Project of Hebei Education Department(SQ2021081)

The National key research and development program(2016YFA0602800)

Abstract

In this paper, the quadratic polynomial and cubic polynomial functions were applied to analyze the environmental Kuznets curve (EKC) of carbon emissions in Hebei Province. The improved STIRPAT model was also applied to assess the driving factors and reduction paths for carbon emissions in Hebei Province. The results lead to three main conclusions. Firstly, carbon emissions and economic growth in Hebei Province are in a positive cor-relation stage which has not formed the EKC curve, and the “decoupling” stage between carbon emissions and economic growth has not arrived yet. Secondly, the industrial structure, per capita GDP, fixed assets investment, population size and urbanization rate account for the highest proportion of carbon emissions. Carbon emissions can be reduced greatly by changing the energy structure, in which the proportion of coal is decreased year by year. Environmental regulation also has an obvious effect on the reduction of carbon emissions. Thirdly, it is suggested that the reduction of carbon emissions in Hebei Province should focus on four tasks: controlling the development of heavy industry, avoiding overcapacity, optimizing the industrial structure and accelerating the development of clean energy.

Cite this article

WANG Bo , WANG Limao , XIANG Ning , QU Qiushi , XIONG Chenran . Analysis of the Driving Factors of Carbon Emissions and Countermeasures for Carbon Emission Reduction in Hebei Province[J]. Journal of Resources and Ecology, 2022 , 13(2) : 220 -230 . DOI: 10.5814/j.issn.1674-764x.2022.02.005

1 Introduction

In recent years, air quality in the Beijing-Tianjin-Hebei region has remained a prominent problem, such as the increases of haze and carbon emissions. According to the Ministry of Environmental Protection, the Beijing-Tianjin- Hebei region accounted for six of the ten cities with the worst air quality in 2017, and the average proportion of good air quality days in 13 cities in this region was 56%, which was lower than the national average.
Fossil energy consumption is the main source of CO2 emissions, accounting for 80% of total greenhouse gas emissions. Moreover, fossil energy is the main source of industrial energy consumption. For the Beijing-Tianjin- Hebei region, the industrial energy consumption accounts for 49.1% of the total energy consumption (Han et al., 2020), while the industrial energy consumption in Hebei Province accounts for 70% of its total energy consumption (Hebei Economic Yearbook 2018). Of that, fossil energy consumption accounts for more than 80% of the total energy consumption, far exceeding the average level of industrial energy consumption in the Beijing-Tianjin-Hebei region. Hence, carbon emissions in Hebei Province contribute the most to the overall carbon emissions in the Beijing-Tianjin- Hebei region.
Hebei Province has adopted the catch-up strategy in developing the energy and heavy chemical industry for nearly 10 years since 2005. In 2005, the annual growth rate of GDP in Hebei Province exceeded 10%, while the annual growth rate was 14% from 2006 to 2008, and the GDP doubled from 2006 to 2012. This super-rapid economic growth was mainly due to the large-scale expansion of energy and heavy chemical industry, which has become the main pollution source of the Beijing-Tianjin-Hebei region (Lu, 2015).
Many socio-economic factors cause carbon emissions. Scholars in related fields have conducted a lot of research on the causes and driving forces of carbon emissions. The exponential decomposition method was used to investigate the driving factors and the mechanism of carbon emissions in Greece (Hatzigeorgiou et al., 2008), while the LMDI method was applied to analyze the driving factors of carbon emissions in the United States (Vinuya et al., 2010). Gonzalez and others also applied the LMDI method to track and decompose the CO2 emissions in the European Union (González et al., 2014). Additionally, Tallarico and Johnson used the STIRPAT multivariate model to analyze the driving factors of carbon emissions in relevant regions (Tallarico et al., 2010).
As for China, Chen and Lin summarized the interactive relationship among the energy environment, climate change and economic growth in recent years (Chen and Lin, 2019). Chen Shiyi pointed out that China is under the pressure of structural adjustment and transformation of the growth pattern because the energy and pollution-intensive industries, such as the steel, cement and chemical industries, will still play an irreplaceable role in the future (Chen, 2009). Peng et al. summarized the theoretical basis, method and evaluation system of five kinds of theoretical models for studying the relationship between regional economic growth and resource environmental pressure (Peng et al., 2020). Wang et al. investigated the relationship between economic growth and per capita carbon emissions, and their research showed that the “decoupling” stage between emissions and growth, which is indicated by the traditional EKC hypothesis, has not yet arrived (Wang et al., 2018). Based on the EKC theory, Huo studied the relationship between the carbon emissions of energy consumption and economic development in Shanghai, and found that the carbon emissions of Shanghai have not reached the inflection point, and the relationship curve between carbon emissions and economic development failed to form the EKC curve (Huo, 2018). Wang et al. analyzed the main driving factors of the carbon emissions of primary energy consumption by using the Kaya and LMDI model (Wang et al., 2016a). They also decomposed the carbon emission factors in Xinjiang Uygur Autonomous Region, and by using an improved IO-SDA model, the results showed that economic development and population size are the important factors causing carbon emission changes (Wang et al., 2016b). Based on the LMDI decomposition method, Zhao et al. analyzed the influencing factors of carbon emissions in Beijing-Tianjin-Hebei. They concluded that the economic aggregate is the main factor driving carbon emissions, while the adjustment of industrial structure, an increase of income and urbanization are the important factors (Zhao et al., 2018). Similarly, Li decomposed the influencing factors of carbon emissions in China from 2000 to 2016 using the LMDI model and found that economic growth and population size are important factors for carbon emissions growth, while the industrial structure and energy intensity are the focus of carbon emissions reduction (Li, 2019). Chen et al. improved the traditional STIRPAT model by adding factors such as industrial structure, urbanization and climate differences. This method overcomes the deficiency of the assumption of the Kaya identical equation, and to some extent makes up for the deficiency of elasticity that LMDI cannot measure (Chen et al., 2018). Su et al. applied the improved STIRPAT-PLS model to analyze the factors influencing carbon emissions in Fujian Province from 2010 to 2016, and the results showed that the population size, urbanization rate and the proportion of the secondary industry are the most important factors in the growth of carbon emissions(Su et al., 2019). Using scenario analysis methods, Zhang et al. have constructed an index of economic development and environmental quality, in which the environmental pressure includes wastewater, sulfur dioxide and the dust emissions of industry (Zhang et al., 2020). Based on the STIRPAT model, Shao et al. selected population density, economic growth and technological level as three variables, and five factors related to haze pollution, industrial structure, energy structure, transportation, the opening-up policy and environmental regulation were also considered (Shao et al., 2019). Zhao et al. analyzed the relationship between economic growth and carbon emissions in the Beijing-Tianjin-Hebei region, and the results showed that the economic growth rate of Hebei province is basically the same as the growth rate of carbon emissions. Hebei province is facing a severe challenge of achieving carbon emission reduction (Zhao et al., 2017).
In short, most of the existing studies have shown that carbon emissions are caused by economic growth, population size, industrial structure, energy intensity, energy structure, scientific and technological level, urbanization rate and other factors. However, there are few studies on the roles of fixed assets investment and governmental environmental regulation.
In this paper, the influencing factors and driving forces of carbon emissions are studied by the Environmental Kuznets curve (EKC) theory and the IPAT model, according to the characteristics of industrial structure, energy structure and carbon emissions in Hebei Province. This paper analyzes the key factors influencing carbon emissions and the path of carbon emission reduction in Hebei Province by selecting the eight factors of total population, urbanization rate, per capita GDP, the proportion of the secondary industry, energy structure, energy consumption intensity, fixed assets investment and environmental regulation in Hebei Province.

2 Data and methods

2.1 Data sources

(1) Hebei Economic Yearbook (1995-2018)
Data obtained from the Hebei Economic Yearbook included the proportion of energy consumption, population and industrial added value in GDP, and the proportion of various kinds of energy (coal, oil, natural gas, primary power and other energy) in the total energy consumption from 1995 to 2017.
(2) Additional data came from the Bulletin on the environmental situation of Hebei Province, and the Bulletin of ecological environment in Hebei Province issued by Department of Ecological Environment of Hebei Province (1998-2016).

2.2 Methods

(1) Calculation of CO2 emissions
This calculation was carried out by the IPCC (Eggleston et al., 2006).
(2) Kaya decomposition
Kaya decomposition is the most simplified formula for describing the impacts of energy structure, economic growth, population and other factors on carbon emissions:
${E_{{\rm{C}}{{\rm{O}}_{\rm{2}}}}} = p \times g \times {e_1} \times {e_2}$
Where ${E_{{\rm{C}}{{\rm{O}}_{\rm{2}}}}}$ is CO2 emissions, p is population, g is per capita GDP, e1 is energy consumption per unit of production, e2 is emission per unit energy consumption.
(3) Improved STIRPAT model
Environmental Kuznets curve (EKC) theory and the IPAT model were used to study the influencing factors and driving forces of carbon emissions.
The panel form of the improved STIRPAT model is as follows:
$I = a \times {p^b} \times {A^c} \times {T^d} \times e$
where I is the emission level of certain environmental pollutants, P is population size, A is economic prosperity, T is the technical factors, and e is an error term, a is the estimated parameters of the model, b, c and d represent the elastic coefficients of the corresponding explanatory variables.
In order to analyze the key factors influencing carbon emissions in Hebei Province, this analysis used the following eight factors as independent variables: total population, urbanization rate, per capita GDP, the proportion of the secondary industry, energy structure, energy consumption intensity, fixed assets investment and environmental regulation.
The research concepts and methods are shown in Fig. 1.
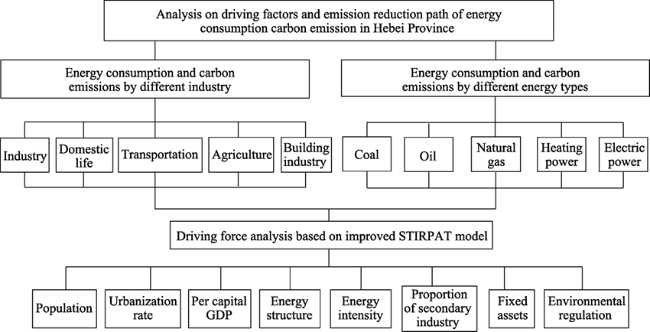
Fig. 1 Research concept of this paper

3 Characteristics of energy consumption and calculation of the carbon emissions in Hebei Province

3.1 Characteristics of energy consumption in Hebei Province

3.1.1 Trend of energy consumption by industry in Hebei Province

The total energy consumption of Hebei Province was 31.20 million t of standard coal in 1980, and it reached 61.24 million t of standard coal in 1990. In 2000, it was 111.95 million t of standard coal and which increased to 235.85 million t of standard coal in 2007. In 2017, it reached 303.85 million t of standard coal. The changing trend since 1995 is shown in Fig. 2.
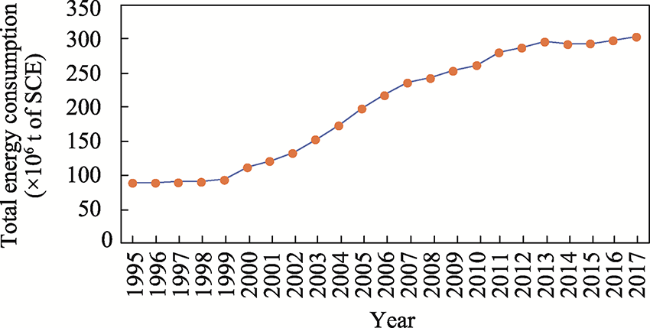
Fig. 2 The trend of energy consumption in Hebei Province (1995-2017)
The industry-specific breakdown of comprehensive energy consumption in Hebei Province is shown in Table 1.
Table 1 The comprehensive energy consumption in Hebei Province
Energy consumption classification Total amount and Proportion Year
2005 2010 2013 2014 2015 2016 2017
Industrial energy consumption and
proportion
Total amount (×104 t standard coal) 15832 20563 23389 22785 22184 22014 22507
Proportion (%) 79.1 78.5 78.8 77.7 75.5 73.9 74.1
Domestic energy consumption and
proportion
Total amount (×104 t standard coal) 1870 2615 2881 2997 3391 3628 3806
Proportion (%) 9.40 10.1 9.7 10.2 11.5 12.2 12.5
Traffic energy consumption and
proportion
Total amount (×104 t standard coal) 710 971 1162 1109 1111 1286 1215
Proportion (%) 3.6 3.7 3.9 3.8 3.8 4.3 4.0
Forestry energy consumption and
proportion
Total amount (×104 t standard coal) 532 713 574 625 642 648 675
Proportion (%) 2.6 2.7 1.9 2.1 2.2 2.2 2.2
Building energy consumption and
proportion
Total amount (×104 t standard coal) 203 319 265 253 297 312 315
Proportion (%) 1.1 1.2 0.9 0.8 1.0 1.0 1.0
Total energyconsumption Total amount (×104 t standard coal) 19836 26201 29664 29320 29395 29794 30386

Note: All data are from Hebei Economic Yearbook.

The secondary industry economy accounts for a large proportion of the total energy consumption in Hebei Province. Six high energy-consuming industries in the secondary industry (ferrous metals, electric power and heat, chemical products, non-metallic products, coal mining, petroleum processing, and others) account for more than 90% (Table 2 and Fig. 3), which are collectively the main source of carbon emissions.
Table 2 Energy consumption of high-energy industries in Hebei Province (Unit: 104 t standard coal)
Year Total
consumption
Six high-energy industries
Ferrous metal Electric and thermal power Chemical materials and products Non-metallic mineral products Coal mining and washing Petroleum processing and coking
2015 20269 10686 3872 1288 1011 929 763
2016 20544 10938 3939 1164 1012 923 720
2017 20292 10732 4101 1104 1047 818 694
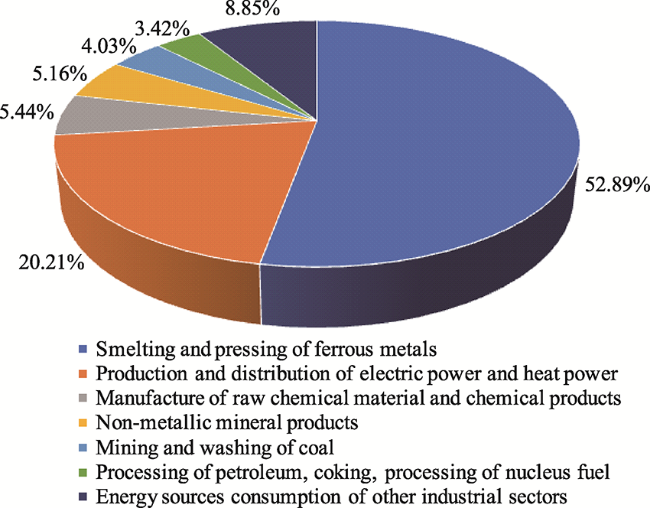
Fig. 3 The proportions of energy consumption in the six energy-intensive industries and other industries in 2017

3.1.2 The main sources of energy production in Hebei Province

Coal is the main energy source in Hebei Province, accounting for more than 85.0% of the fossil fuels (Fig. 4). In 1980, coal accounted for 85.0% of the total energy, which rose to 90.3% in 1990. In 2009, coal accounted for the highest proportion, reaching 92.5%. In 2010, the proportion of coal in the total energy consumption began to decline gradually, and it had dropped to 83.7% in 2017.
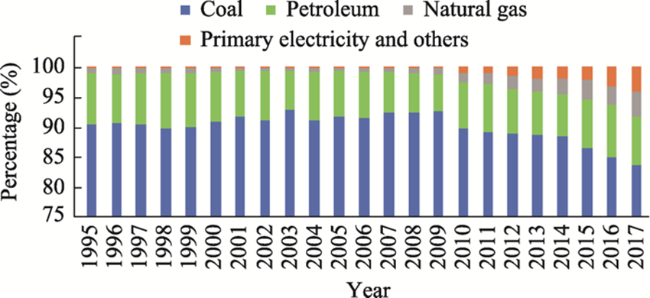
Fig. 4 Energy consumption structure in Hebei Province (1995-2017)

3.1.3 Analysis of the relationship between energy consumption and economic growth in Hebei Province

This paper analyzes the relationships among energy consumption intensity, energy structure and economic growth of different industries in Hebei Province. The results (Table 3) showed that there is a significant statistical relationship among industrial structure, energy consumption structure and economic growth in Hebei Province.
Table 3 Correlation matrix results between variables in the carbon emission model and GDP per capita
Variable GDP per capita
Agriculture and forestry energy consumption intensity 0.981518
Proportion of secondary industry -0.694720
Proportion of tertiary industry 0.848086
Industrial energy consumption intensity 0.976681
Traffic energy consumption intensity 0.952120
Building energy consumption intensity 0.973299
Terminal energy consumption intensity -0.983180
Proportion of terminal coal -0.915260
Proportion of terminal oil and gas 0.878390
Proportion of terminal thermal power 0.935954

3.2 Carbon emission characteristics of energy consumption in Hebei Province

3.2.1 Calculation of carbon emissions

Energy consumption is the main source of carbon emissions, accounting for 80% of the total greenhouse gas emissions. Carbon emission measurement is the basis of the emission reduction policy. In this paper, the IPCC method is used to calculate carbon emissions, and the results are shown in Table 4.
Table 4 The relationship between per capita GDP and per capita carbon emissions in Hebei Province
Year Population (×104 person) GDP
(×108 yuan)
Per capita GDP (yuan) Energy
consumption (×104 t)
Energy consumption per unit GDP (×104 t (108 yuan)-1) Total
emissions (×104 t)
Per capita emissions (t)
1995 6437.00 2849.52 4444.00 8892.41 3.12 11439.19 1.78
1996 6484.00 3452.97 5345.00 8938.47 2.59 11721.47 1.81
1997 6525.00 3953.78 6079.00 9033.01 2.28 12184.10 1.87
1998 6569.00 4256.01 6501.00 9151.12 2.15 12362.14 1.88
1999 6614.00 4514.19 6849.00 9379.27 2.08 12731.24 1.92
2000 6674.00 5043.96 7592.00 11195.71 2.22 13712.38 2.05
2001 6699.00 5516.70 8251.00 12114.29 2.20 14646.12 2.19
2002 6735.00 6018.28 8960.00 13404.53 2.21 16287.21 2.42
2003 6769.00 6921.29 10251.00 15297.89 2.23 18376.59 2.71
2004 6809.00 8503.61 12526.00 17347.79 2.21 21151.77 3.11
2005 6851.00 10047.10 14711.00 19835.99 2.04 25709.82 3.75
2006 6898.00 11513.60 16749.00 21794.09 1.97 27563.21 4.00
2007 6943.00 13662.32 19742.00 23585.13 1.89 31501.62 4.54
2008 6989.00 16079.97 23083.00 24321.87 1.73 32263.82 4.62
2009 7034.00 17319.48 24701.00 25418.79 1.51 34776.57 4.94
2010 7194.00 20494.19 28808.00 26201.41 1.47 39211.37 5.46
2011 7241.00 24543.87 34008.00 28075.03 1.28 45465.58 6.28
2012 7288.00 26568.79 36576.00 28762.47 1.14 47291.20 6.49
2013 7333.00 28387.44 38833.00 29664.38 1.08 51595.57 7.04
2014 7384.00 29341.22 39876.00 29320.21 1.04 48233.05 6.53
2015 7425.00 29686.16 40093.00 29395.36 1.00 48428.88 6.52
2016 7470.00 31660.15 42511.00 29794.40 0.99 48926.54 6.55
2017 7520.00 34016.32 45387.00 30385.88 0.94 50255.65 6.68

3.2.2 Carbon emission characteristics of energy consumption

The results of the calculation showed that the carbon emissions of energy consumption in Hebei Province increased from 114.4 million tons (1995) to 137.1 million tons (2000), and from 257.1 million tons (2005) to 515.9 million tons (2013). Since 2013, the total carbon emissions have begun to decline and maintained a relatively stable level since the introduction of the emission reduction policies in Hebei Province starting in 2013.
The carbon emissions increased by 19.8% from 1995 to 2000, and by 87.5% from 2000 to 2005. Then, the carbon emissions increased by 200.0% from 2005 to 2013, and remained unchanged from 2013 to 2017.
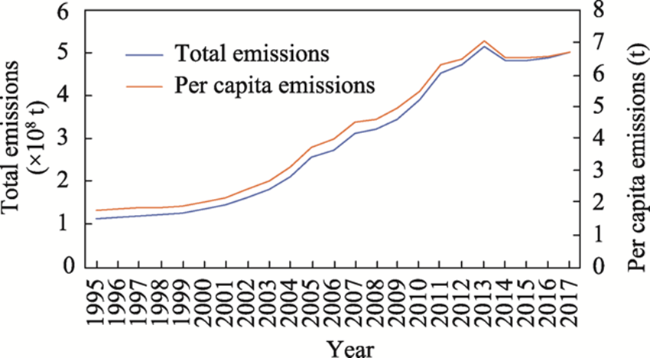
Fig. 5 Carbon emissions and per capita carbon emissions in Hebei Province

3.2.3 Emission paths of the different energy sources in Hebei Province

From the perspective of energy source types, coal has always been the one with the largest carbon emissions and has become the main driving factor in the process of carbon emissions.
(1) Energy consumption and carbon emissions in Hebei grew rapidly between 2000 and 2013, along with fossil energy. Carbon emissions in 2017 were more than three times the carbonemissions in 2000.
(2) Coal is the main energy source in Hebei Province, accounting for more than 85% of fossil fuel consumption. Ferrous metal smelting, chemical manufacturing, non-metallic minerals, coal mining and thermal power generation are the largest energy consumption sectors.
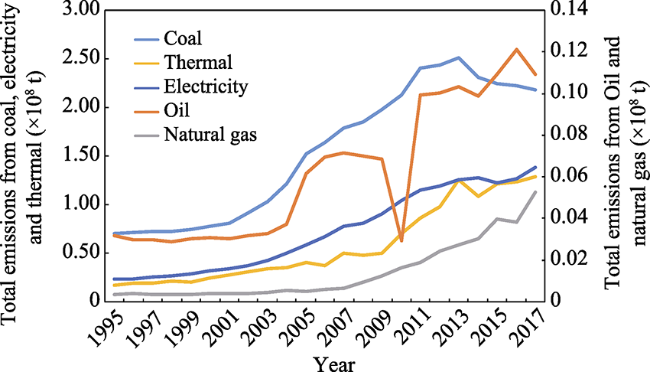
Fig. 6 CO2 emissions from different energy sources

3.2.4 Environmental Kuznets curve analysis of CO2 in Hebei Province

EKC reveals a basic transformation law between economic growth and the environment in developed countries. Is there a trend of deterioration before improvement between carbon dioxide emissions and economic growth in Hebei Province?
In the past, EKC research mostly used the quadratic polynomial function, and the quadratic polynomial curve is either U-shaped or inverted U-shaped, while the curve of the cubic polynomial function has many forms. In this paper, the quadratic polynomial function and the cubic polynomial function were constructed as the EKC models of carbon emissions.
(1) Quadratic polynomial function of EKC
${P_{CE}} = {\beta _1} \times {P_{CG}} + {\beta _2} \times {P_{CG}}^2 + \varepsilon$
where PCE is CO2 emissions per capita, PCG is per capita GDP, PCG2 is the square of GDP per capita, and β1, β2, $\varepsilon $ are the parameters to be estimated, taking each variable as a logarithm and denoting it as LPCE and LPCG, respectively.
This paper analyzes the relationship between per capita GDP and per capita carbon dioxide emissions in Hebei Province (Fig. 7) using the data for these two parameters from 1995 to 2017. Results show that β1= –0.2276, β2= 2.4413, $\varepsilon$=0.4633.
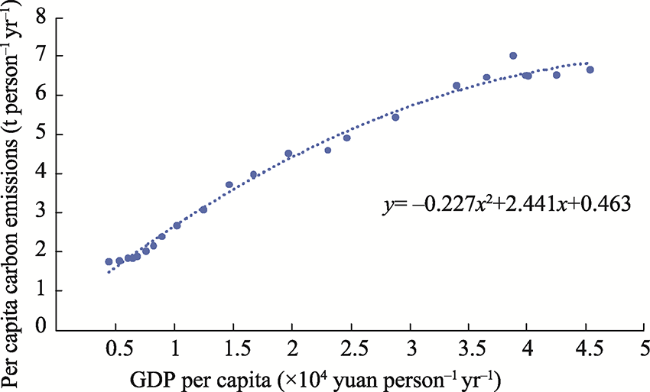
Fig. 7 The relationship between per capita GDP and per capita carbon dioxide emissions in Hebei Province (Quadratic polynomial function)
The primary coefficient of per capita income is positive and the secondary coefficient is negative, which means there may be an inflection point in the Kuznets curve of carbon dioxide in Hebei Province. However, the inflection point is not obvious from the relationship between per capita GDP and per capita carbon dioxide emissions in Hebei Province. The results showed that carbon emission control in Hebei Province has a long way to go.
(2) Cubic polynomial function of EKC
The cubic polynomial function of the EKC model is constructed as:
${P_{CE}} = {\beta _1} \times {P_{CG}} + {\beta _2} \times {P_{CG}}^2 + {\beta _3} \times {P_{CG}}^3 + \varepsilon$
The meaning of each parameter variable is the same as in formula (3).
The parameters of carbon emissions are shown in Table 5, and the regression curve (Fig. 8) shows that Hebei Province has either reached the ecological inflection point of carbon emissions or formed the EKC curve.
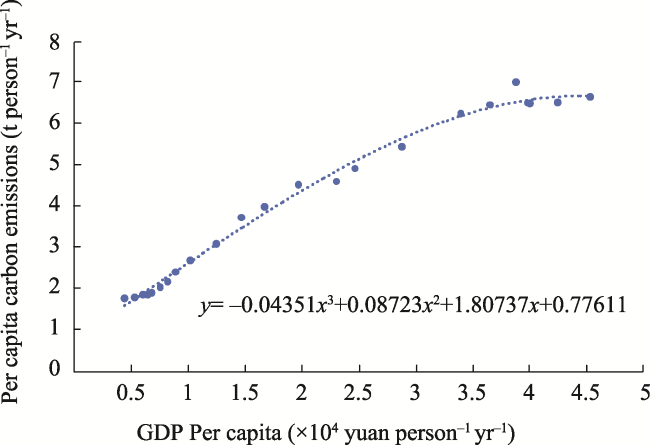
Table 5 Parameters of carbon emissions by the EKC model
Parameter Coefficient Standard error t-statistic P-value
ε 0.77611 0.23815 3.25899 0.004
β1 1.80737 0.43294 4.17469 0.000
β2 0.08723 0.20554 0.4244 0.000
β3 -0.04351 0.02815 0.02815 0.000

Note: R2=0.992, after adjustment, R2=0.991.

Fig. 8 Relationship between per capita GDP and per capita carbon dioxide emissions in Hebei Province (Cubic polynomial function)
Figure 8 shows a positive correlation between carbon emissions and economic growth in Hebei Province, and the “decoupling” stage between carbon emissions and economic growth indicated by EKC theory has not yet arrived. From the perspective of future development, economic growth will inevitably lead to the growth in carbon emissions. Therefore, in order to achieve the goal of positive economic growth and negative growth of carbon emissions, we should focus on a few tasks: the adjustment of industrial structure (such as technological innovation of high energy-consuming industries in the secondary industry, energy conservation and emission reduction), population urbanization development, green sustainable development, and guidance for low-carbon travel and green consumption of residents.

4 Driving force analysis of carbon emissions from energy consumption in Hebei Province

4.1 Analysis of the driving forces of carbon emissions by Kaya

The driving forces of carbon emissions are generally analyzed by classical Kaya identity and the improved Kaya identity.
According to the fact that fossil energy accounts for more than 80% of the energy consumption structure in Hebei Province, Kaya identity is used to analyze the driving forces of carbon emission growth.
Through this calculation, the influencing factors of carbon emissions are shown in Table 6, such as population, per capita GNP, energy consumption per unit of production and energy consumption per unit.
Table 6 Main factors affecting carbon emissions in Hebei Province
Year Carbon emissions (104 t of CO2) Population effect GDP per capita Energy intensity Energy structure
1995-1996 282.28 84.24 2140.05 -2164.46 222.45
1996-1997 462.63 75.33 1543.32 -1492.91 336.89
1997-1998 178.04 82.48 821.54 -744.59 18.61
1998-1999 369.10 85.65 653.22 -429.92 60.15
1999-2000 981.15 119.35 1347.15 873.07 -1358.42
2000-2001 933.74 53.00 1216.84 -152.14 -183.96
2001-2002 1641.08 81.90 1411.79 70.18 77.22
2002-2003 2089.38 89.22 2593.99 -396.06 -197.77
2003-2004 2775.18 114.37 4216.75 -1849.85 293.92
2004-2005 4558.04 143.80 3014.73 -27.97 1427.47
2005-2006 1853.40 182.04 3492.52 -1167.99 -653.18
2006-2007 3938.41 193.45 5028.21 -2892.73 1609.47
2007-2008 762.20 208.70 4734.41 -3962.46 -218.45
2008-2009 2512.75 217.90 1473.06 -212.98 1034.78
2009-2010 4434.80 782.71 5526.89 -5189.12 3314.32
2010-2011 6254.21 325.25 7365.40 -4771.76 3335.32
2011-2012 1825.62 300.04 3987.26 -3165.52 703.83
2012-2013 4304.37 304.85 2805.16 -1584.39 2778.74
2013-2014 3362.51 346.78 1589.37 -2518.42 -2780.24
2014-2015 195.83 268.73 359.45 -504.47 72.11
2015-2016 497.66 294.97 2899.73 -2538.35 -158.68
2016-2017 1329.11 327.31 5731.13 -5083.65 354.32

4.2 Analysis of the driving forces of carbon emissions based on the improved STIRPAT model

In addition to the above four factors, industrial structure, urbanization rate and fixed assets investment also have a high impact on carbon emissions. Besides, the energy consumption structure and government environmental regulation have also been shown to be important for carbon emissions by previous research (Lin et al., 2015; Zhang, 2015). Therefore, the key factors driving carbon emissions cannot be completely identified using only the Kaya and improved Kaya identities, while the STIRPAT model and the improved STIRPAT model can identify additional key factors influencing carbon emissions and decompose the effects of each factor.
Furthermore, according to the characteristics of industrial structure, energy structure and carbon emissions in Hebei Province, as well as the adaptive conditions of STIRPAT and improved STIRPAT, this paper will analyze the key influencing factors of carbon emissions and the countermeasures of carbon emission reduction by the eight selected factors of: total population, urbanization rate, per capita GDP, the proportion of the secondary industry, energy structure, energy consumption intensity, fixed assets investment and environmental regulation in Hebei Province.

4.2.1 Theoretical model

The STIRPAT model is the classical method to determine the influencing factors of environmental pollution. The improved STIRPAT model is shown in formula (2).
The above model has been improved to build a better influencing factor model for carbon dioxide emissions. Meanwhile, to eliminate the possible heteroscedasticity, the variables in the improved model are logarithm-adjusted by the formula:
$In{\kern 1pt} I = a + b \times InP + {\rm{c}} \times InA + d \times InT + e$
The improved model is as follows:
$\begin{array}{c}\ln C{O_2} = C + {\beta _1} \times \ln POP + {\beta _2} \times \ln GDP + {\beta _3} \times \ln EI\\{\rm{ }} + {\beta _4}\ln ECS{\rm{ + }}{\beta _5}\ln IS + {\beta _6} \times \ln UR - {\beta _7}\ln FI\\{\rm{ }} + {\beta _8}\ln ER\end{array}$
where C is a constant term; CO2 is carbon dioxide emissions; POP is total population, expressed by the total population at the end of the year; per capita GDP is economic growth, and in order to eliminate the impact of price factors, this paper uses the per capita GDP deflator to deflate the per capita GDP index; EI is energy intensity, in units of GDP Energy consumption, measuring the level of technology, it is calculated by dividing energy consumption by GDP; ECS is energy consumption structure, the proportion of coal consumption in total energy consumption; UR is the rate of urbanization, the proportion of the urban population in the total population, reflecting the impact of the urban population on the environment; FI is fixed assets investment; ER represents environmental regulation, using two indicators of sulfur dioxide emissions per unit of industrial output and smoke and dust emissions per unit of industrial output to construct the environmental regulation index; and βj is the environmental regulation index to be estimated.

4.2.2 Identification of the key influencing factors of carbon emission

To determine whether there is a multicollinearity relationship between the dependent variable and each variable, the Spearman method is used to analyze the correlation of each variable, and the correlation coefficient between each variable is obtained (Table 7).
Table 7 Correlation coefficients of the main factors affecting carbon emission
Parameter Carbon
emission
Population Urbanization rate Per capita GDP Coal
proportion
Energy intensity Secondary industry Fixed assets investment Environmental regulation
Carbonemission 1.000 0.965** 0.916** 0.970** -0.831** -0.977** -0.540 0.924** -0.941**
Population 1.000 0.981** 0.993** -0.929** -0.980** -0.715** 0.986** -0.954**
Urbanization rate 1.000 0.980** -0.936** -0.954** -0.807** 0.993** -0.949**
Per capita GDP 1.000 -0.915** -0.983** -0.695** 0.979** -0.956**
Coal proportion 1.000 0.851** 0.856** -0.942** 0.811**
Energy intensity 1.000 0.600* -0.947** 0.986**
Secondary industry 1.000 -0.800** 0.611*
Fixed assets investment 1.000 -0.927**
Environmental regulation 1.000

Note: **: The correlation was significant at the 0.01 level (bilateral); *: The correlation was significant at the 0.05 level (bilateral).

The independent variables in the model were found to have a serious multicollinearity problem from the correlation analysis of the variables. In this case, the principal component analysis, ridge regression or partial least squares method are usually used for the regression analysis. In this paper, the principal component analysis is used for the calculation, and the regression formula is as follows:
$\begin{array}{c}{\rm{ln }}C{O_2} = - 10.53 + 1.46 \times \ln POP + 0.28\ln GDP\\{\rm{ }} + 0.17\ln EI - 0.2\ln ECS + 0.18\ln IS\\{\rm{ }} + 1.38\ln UR + 0.085\ln FI - 0.16\ln ER\end{array}$
The proportions of the main factors affecting carbon emissions are shown in Table 8.
Table 8 The proportions of the main factors affecting carbon emissions
Influencing factor Population Urbanization rate Per capita GDP Coal
proportion
Energy intensity Secondary industry Fixed assets investment Environmental regulation
Contribution of carbon emission impact 0.24 0.18 0.34 -0.29 0.031 0.35 0.31 -0.16
This calculation shows that industrial structure, per capita GDP, fixed assets investment, population size and the urbanization rate account for the highest proportions of the total carbon emissions, and the proportions of industrial structure and per capita GDP are the highest among these four factors, which further indicates that there is a positive correlation between carbon emissions and economic growth in Hebei Province. Moreover, the contribution of fixed assets investment to carbon emissions was 0.31, which is the third major factor affecting carbon emissions. Hence, science and technology factors must be added to the factors driving economic growth by investment, and more investment should be made in the new infrastructures in addition to the improvement of people’s livelihood.
The impact of urbanization rate on carbon emissions is shown as 0.18. This result shows that carbon emission is increasing with the continuous advancement of the urbanization process. Therefore, we should support green building and low-carbon travel in the process of urbanization development.
When it comes to the impact of energy structure on carbon emissions, reducing the proportion of coal is an important countermeasure for reducing the carbon emissions in Hebei Province.
This result also shows that environmental regulation contributes significantly to the reduction of carbon emissions, with a proportion of 0.16. As a result, environmental regulation should be emphasized among the measures for reducing carbon emissions in Hebei Province.

5 Discussion

(1) The data from 1995 to 2017 were selected in this paper and the results can represent the situation of carbon emissions in Hebei Province. In the subsequent research, the comparative study using the data from the last three years can indicate the change in the carbon emissions issue in Hebei Province.
(2) This paper applied the improved STIRPAT model to analyze the impact of environmental regulations on carbon emissions. The results correspond very highly with reality. In order to be more scientific, other calculation methods can also be used to determine the effect of environmental regulations on carbon emissions reduction in the future.
(3) Because of the various measures which can be used to reduce the carbon emissions in different industries, it is of great significance to study the most efficient path of the carbon emission peak in the cement, steel and power industries in future research.

6 Conclusions

This paper analyzed the total energy consumption and carbon emissions in Hebei Province, and also studied the influencing factors and reduction paths of carbon emissions by EKC theory and the STIRPAT model. These analyses had led to six main conclusions.
(1) There are significant statistical relationships among industrial structure, the energy consumption structure of different industries and economic growth in Hebei province. Specifically, the economy is growing in step with energy consumption.
(2) The energy consumption and CO2 emissions in Hebei Province increased rapidly from 1995 to 2013, but then slowed down from 2013 to 2017. The total carbon emissions in 2017 were more than three times the total of 2000.
(3) There is a positive correlation between carbon emissions and economic growth in Hebei Province, and the ecological inflection point of carbon emissions in Hebei Province has not been reached. Also, the EKC curve has not been formed. Therefore, the “decoupling” stage between carbon emissions and economic growth in Hebei Province has not yet arrived.
(4) Regarding the influencing factors, the industrial structure, per capita GDP, fixed assets investment, population size and urbanization rate account for the highest proportions of carbon emissions. On the other hand, environmental regulation has an obvious effect on the reduction of carbon emissions. Moreover, reducing the proportion of coal in the energy structure has a stronger effect on carbon emission reduction.
(5) The economic growth will inevitably be accompanied with an increase in carbon emissions. To achieve the goal of positive economic growth with the negative growth of carbon emissions, we should focus on the adjustment of the industrial structure, sustainable development, low-carbon travel and other effective methods.
(6) This analysis suggested that the countermeasures of carbon emission reduction should focus on controlling the development of heavy industry, avoiding overcapacity, optimizing the industrial structure, developing energy-saving and emission reduction technology and accelerating the development of clean energy in Hebei Province.
[1]
Chen S Y. 2009. Energy consumption, carbon dioxide emissions and the sustainable development of Chinese industry. Economic Studies, (4): 41-55. (in Chinese)

[2]
Chen S Y, Lin B Q. 2019. Current situation and prospect of economic research on energy environment and climate change in China. Economic Research, 7: 203-208. (in Chinese)

[3]
Chen Z M, Wu S M, Ma W B, et al. 2018. Driving forces of carbon dioxide emission for China’s cities: Empirical analysis based on extended SPTRPAT Model. China Population, Resources and Environment, 28(10): 45-54. (in Chinese)

[4]
Eggleston H S, Buendia L, Miwa K, et al. 2006. Chapter 2: Energy. IPCC Guidelines for national greenhouse gas inventories. Kanagawa, Japan: IGES.

[5]
González P F, Landajo M, Presno M J. 2014. Tracking European Union CO2 emissions through LMDI (Logarithmic-Mean Divisia Index) decomposition: The activity revaluation approach. Energy, 73(7): 741-750.

DOI

[6]
Hatzigeorgiou E, Polatidis H, Haralambopoulos D. 2008. CO2 emissions in Greece for 1990-2002: A decomposition analysis and comparison of results using the arithmetic mean divisia index and logarithmic mean divisia index techniques. Energy, 33(3): 492-499.

DOI

[7]
Han Y Y, PI H J, Shi Z N, et al. 2020. Measurement of industrial CO2 emissions in Beijing-Tianjin-Hebei region and its influencing factors. World Geographic Research, 29(1): 140-147. (in Chinese)

[8]
Huo L T. 2018. The relationship between carbon emission of energy consumption and economic development in Shanghai. Shanghai Economy, (1): 68-77. (in Chinese)

[9]
Li G. 2019. A research on industrial structure adjustment and energy intensity in the influential factors of carbon emission reduction. Shanghai Environmental Sciences, 38(6): 260-269. (in Chinese)

[10]
Lin B Q, Li J L. 2015. Transformation of China’s energy structure under environmental governance constraints: A peak value analysis of coal and carbon dioxide. Social Science in China, (9): 84-107, 205. (in Chinese)

[11]
Lu D D. 2015. Moderate-speed growth: Sustainable development of China’s economy. Scientia Geographica Sinica, 35(10): 1207-1219. (in Chinese)

[12]
Peng H S, Guo L J, Zhang J H, et al. 2020. Research progress and implication of the relationship between regional economic growth and resource-environmental pressure. Resources Science, 42(4): 593-606. (in Chinese)

[13]
Shao S, Li X, Cao J. 2019. Urbanization promotion and haze pollution governance in China. Economic Research, 2: 148-165. (in Chinese)

[14]
Su K, Chen Y H, Fan S S, et al. 2019. Influencing factors and reduction mechanism of carbon emissions at the city-range: An empirical study on Fujian Province. China Environmental Science, 39(2): 859-867. (in Chinese)

[15]
Tallarico C D, Johnson A C. 2010. The implications of global ecological elasticities for carbon control: A STIRPAT formulation. Journal of Management Policy and Practice, 11(4): 86-94.

[16]
Vinuya F, Furio F D, Sandoval E. 2010. A decomposition analysis of CO2emissions in the United States. Applied Economics Letters, 17(10): 925-931.

DOI

[17]
Wang C J, Wang F, Zhang H O. 2016a. The process of energy related carbon emissions and influencing mechanism research in Xinjiang. Acta Ecologica Sinica, 36(8): 2151-2163. (in Chinese)

[18]
Wang C J, Zhang X L, Zhang H O, et al. 2016b. Influencing mechanism of energy-related carbon emissions in Xinjiang based on IO-SDA model. Acta Geographica Sinica, 71(7): 1105-1118. (in Chinese)

[19]
Wang S J, Su Y X, Zhao Y B. 2018. Regional inequality, spatial spillover effects and influencing factors of China’s city-level energy-related carbon emissions. Acta Geographica Sinica, 73(3): 414-428. (in Chinese)

[20]
Zhang G J, Wang Y H, Wu K J, et al. 2020. Spatial-temporal characteristics and influencing factors of coordination between economic and environmental development of three major urban agglomerations in China. Geographical Research, 39(2): 272-288. (in Chinese)

[21]
Zhang Y G. 2015. China’s regional trade patterns under the perspective of carbon emissions: Pollution haven and factor endowment. China Industrial Economics, (8): 5-19. (in Chinese)

[22]
Zhao Y H, Kong C T, Li H. 2017. Study on decoupling between economic growth and carbon emissions in Beijing-Tianjin-Hebei region. China Energy, 9(6): 20-27. (in Chinese)

[23]
Zhao Y H, Li H, Liu Y, et al. 2018. Identifying driving forces of CO2 emissions in Beijing-Tianjin-Hebei region from temporal and spatial angles. Resources Science, 40(1): 207-215. (in Chinese)

Outlines

/