Ecosystem and Climate Change

Spatio-temporal Analysis of Changes in Winter Wheat Cold Damage with Meteorological Elements in Huang-Huai-Hai Plain from 2011 to 2020

  • ZHENG Xintong , 1, 2 ,
  • XIE Chuanjie , 1, * ,
  • HE Wei 1, 2 ,
  • LIU Gaohuan 1
Expand
  • 1. Institute of Geographic Sciences and Natural Resources Research, Chinese Academy of Sciences, Beijing 100101, China
  • 2. University of Chinese Academy of Sciences, Beijing 100049, China
* XIE Chuanjie, E-mail:

ZHENG Xintong, E-mail:

Received date: 2021-02-05

  Accepted date: 2021-06-30

  Online published: 2022-03-09

Supported by

The National Key Research and Development Program of China(2017YD0300403)

Abstract

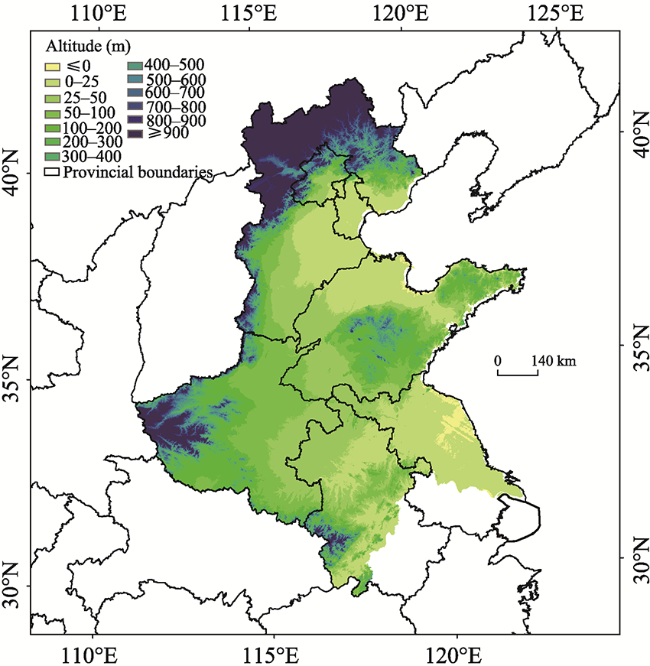
The Huang-Huai-Hai Plain is one of the typical agri-ecosystems in China, which suffers from cold damage frequently resulting in substantial economic losses. In order to monitor the changes in the occurrence of cold damage in an effective and large-scale manner, and to determine their meteorological causes, this paper collected low temperature data from the agricultural meteorological stations and remote sensing data of MODIS from 2005 to 2015, and constructed a monitoring model of cold damage to winter wheat in Huang-Huai-Hai Plain based on the Logistic regression model. This model was used to analyze the spatio-temporal changes of cold damage of winter wheat in Huang-Huai-Hai Plain from 2011 to 2020, and correlation analysis was performed with the spatio-temporal changes of meteorological factors to ascertain how they affect cold damage. The results show that the harm from cold damage in winter wheat has been gradually decreasing from 2011 to 2020, and the cold damage areas with high probability and high frequency are moving from north to south. The meteorological elements with the greatest impacts on the degree of cold damage from stronger to weaker are heat, precipitation and sunshine duration, whose influence has spatial variability.

Cite this article

ZHENG Xintong , XIE Chuanjie , HE Wei , LIU Gaohuan . Spatio-temporal Analysis of Changes in Winter Wheat Cold Damage with Meteorological Elements in Huang-Huai-Hai Plain from 2011 to 2020[J]. Journal of Resources and Ecology, 2022 , 13(2) : 196 -209 . DOI: 10.5814/j.issn.1674-764x.2022.02.003

1 Introduction

With the awakening of human societies to the ecological crisis and a re-examination of the relationship between human and nature, the study of ecosystems has been pushed to the higher level of ecosystem services, which opens a new chapter in making them function effectively and promoting the sustainable development of humans and nature. An agri- ecosystem is a typical kind of the social-economic-natural complex ecosystem (Lin, 2020), which consists of agro- ecology and agricultural economy. The system is characterized by diversity, opening and vulnerability (Zhu et al., 2010), whose cross-coupling functions involve material cycle, energy flow, information transfer and others (Wang et al., 2010).
Cold is a natural phenomenon that has major impacts on the economy, society and the environment, which seriously affects the agri-ecosystems (Liu et al., 2014). The impact of disasters on the development of crop growth causes huge losses to agricultural production. The Huang-Huai-Hai Plain is one of the major grain producing areas in China, which is also the largest area of wheat production in China and plays an important role in the national food security strategy (Zheng et al., 2015; Liu et al., 2018). Affected by the monsoon climate, China is one of the countries with the most serious agricultural disasters in the world, 70% of which are meteorological disasters (Guo, 2016). Cold damage is one of the meteorological disasters affecting winter wheat in China (Zhang et al., 2017). In the last decade, global warming has shortened the frost-free period, increased the degree of drought, and increased the frequency of cold damage (Hong et al., 2011) to winter wheat by making the spring temperatures more unstable. Due to the change of climate, the cold damage in spring has become one of the main meteorological disasters in Huang-Huai-Hai Plain (Qian et al., 2014), which seriously affects and limits the growth of winter wheat. For example, due to the large temperature variation and severe cold weather in the Huang-Huai-Hai Plain in 2004-2005, a large area of winter wheat suffered from cold damage, and the affected area reached 3.33 million ha, accounting for 31.2% of the growing area (Cao et al., 2011). Understanding the changes in the occurrence of cold damage, and the meteorological reasons driving it, can provide guidance regarding cultivation to the corresponding governments and farmers in the future.
Domestic and foreign scholars have conducted numerous studies on cold damage in winter wheat, including the physiological mechanisms (Nuttall et al., 2019; Wang et al., 2020), the construction of models (Zhang et al., 2017), risk regionalization, spatial and temporal distribution (Chu et al., 2015), cold damage assessment (Xiao et al., 2018), and others. However, most of the current studies are based on the analysis of spatio-temporal changes of cold damage of winter wheat as affected by meteorological elements, or the analysis of spatio-temporal changes in the meteorological elements affecting winter wheat, while there are few analyses focusing on the changes of cold damage based on both remote sensing data and meteorological data. To reduce the impact of using a single remote sensing indicator on the accuracy of identifying the growth condition, this paper adds the Fraction of Absorbed Photosynthetically Active Radiation (FPAR) to analyze the growth condition in a comprehensive manner, which can also show the ability of the plants to carry out photosynthesis (Jiao et al., 2020) since it is the source of energy in producing dry matter (Zhang et al., 2019). Campoy et al. (2020) integrated FPAR, crop transpiration and the crop transpiration coefficient into the crop growth models, which resulted in empirical HI values from 0.23 to 0.55.
Therefore, this paper assesses the occurrence of cold damage at the county level through NDVI, FPAR and low-temperature data, and also analyzes the relationships between the changes of cold damage and changes in key meteorological elements in the Huang-Huai-Hai Plain winter wheat growing area in recent years. The results can provide some theoretical basis for corresponding governments and farmers in making decisions regarding future cultivation in the Huang-Huai-Hai Plain in China.

2 Materials and methods

2.1 Study area

The study area is Huang-Huai-Hai Plain (32°00′-40°24′N, 112°48′-122°45′E, Fig. 1), which covers an area of about 3.0×10⁵ km2 and is located in a warm temperate humid monsoon climate region. The average annual temperature of the region is 8-15 ℃, the accumulated temperature (≥0 ℃) is 4200-5500 ℃, the length of the frost-free period is 170-200 days, the heat is suitable for a second maturity during the year, and the main planting method is the winter wheat- summer maize rotation (Xu et al., 2015). The annual precipitation is 500-950 mm, its spatial distribution decreases from southeast to northwest under the influence of the southeastern monsoon, and the seasonal distribution is uneven, with 60%-70% of the precipitation concentrated in summer.
Fig. 1 Overview of the study area

2.2 Data

The data include daily meteorological data, crop data, remote sensing data, and cold events. The meteorological data are daily temperature data from 2005-2020, including minimum temperature and average temperature, from the meteorological stations (Fig. 2) in Huang-Huai-Hai Plain of China (http://cdc.cma.gov.cn/). Crop data include the growth period of winter wheat, the distribution data of planting winter wheat and the temperature limits of different fertility periods (shown in Table 1), which are from the agricultural meteorological stations and the comprehensive analysis of existing literature collected by Qian Yonglan et al. (Qian et al., 2014). As for the remote sensing data from 2005-2020, both the NDVI and FPAR were downloaded from the USGS (https://ladsweb.modaps.eosdis.nasa.gov/), with the NDVI calculated and processed from the MOD09GA, and the FPAR from the MCD15A3H. The data for cold events in winter wheat include the time, region and description of the cold damage of winter wheat in the study area from 2005 to 2015, which were obtained by Tian from Beijing Agricultural College and collected from the Statistical Yearbooks from each province, China Meteorological Disaster Dictionary, China Meteorological Disaster Yearbook and other relevant sources.
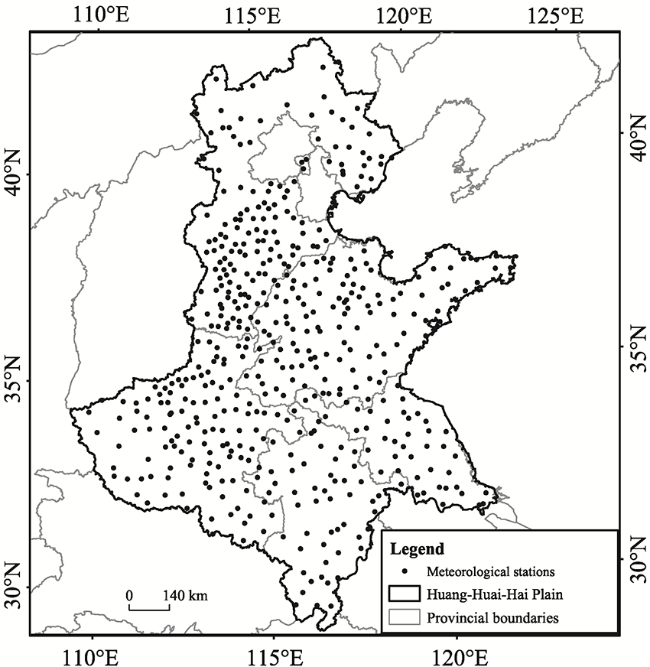
Fig. 2 The distribution of meteorological stations in the Huang-Huai-Hai Plain
Table 1 The limits of minimum daily temperature in different fertility periods of winter wheat in Huang-Huai-Hai Plain
Developmental stage Critical temperature (℃)
Sowing-Tillering 2
Tillering-Overwintering 0
Overwintering-Greening -17 to -13
Greening-Plucking 0
Plucking-Spurting 2
Spurting-Milk 9
Milk-Ripe 12

2.3 Method

2.3.1 Extracting the characteristics of the elemental curve

The characteristics include the features of low temperature, NDVI and FPAR. The steps for extracting the features from the low temperature are as follows: 1) Check the fertility period of winter wheat by date and county, and determine the minimum temperature standard ${T_{LMT}}$; 2) Obtain the area where the temperature is lower than ${T_{LMT}}$ during the period of the cold damage time, calculate its temperature distance from the limit, and determine the extreme low temperature ${T_{MDLMT}}$, low temperature days ${D_{LLMT}}$ and cumulative low temperature ${S_{DLMT}}$. The first of these indicators represents the low temperature intensity, the second gives the number of days of low temperature impact, and the third indicates the overall low temperature impact.
The NDVI and FPAR have the same features, and NDVI is taken as an example here. 1) Assess the changes of NDVI to find the valley of the curve; 2) Calculate the maximum drop of NDVI in the valley ${D_{MNDVI}}$, and the area of the valley, ${S_{DNDVI}}$, as shown in Fig. 3 and Fig. 4.
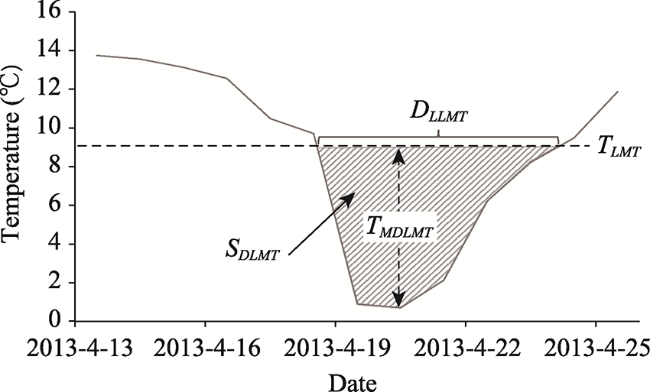
Fig. 3 The characteristic values of the minimum temperature curve
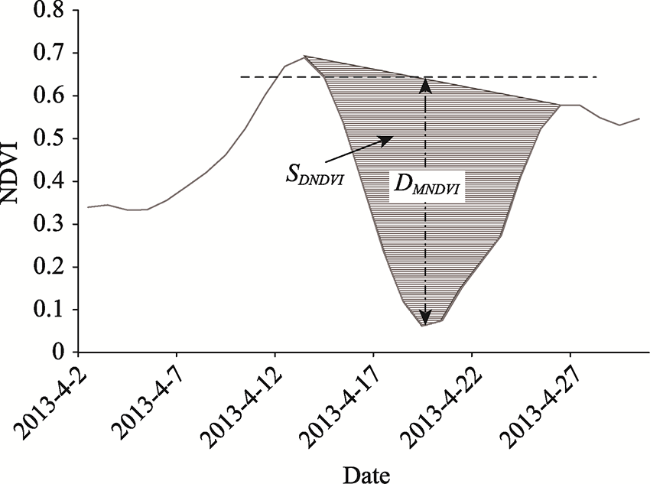
Fig. 4 The characteristic values of the NDVI curve

2.3.2 Correlation coefficient

The Pearson correlation coefficient (Pc), also known as Pearson product-moment correlation coefficient, is a linear correlation coefficient commonly used to reflect the degree of linear correlation between two variables X and Y (Jiang et al., 2014). Pc is mainly used to measure the strength of the linear relationship between two groups of analyzed objects. Its value range is [0,1], and the mathematical expression is:
${P_c} = \frac{{N\mathop \sum \nolimits^{x_i y_i} - \mathop \sum \nolimits^{x_i}\mathop \sum \nolimits^{y_i}}}{{\sqrt {N\mathop \sum \nolimits^{x_i 2} - {{\left( {\mathop \sum \nolimits^{x_i}} \right)}^2}} \sqrt {N\mathop \sum \nolimits^{y_i 2} - {{\left( {\mathop \sum \nolimits^{y_i}} \right)}^2}} }}$
where x and y correspond to the data series of two groups of analyzed objects, N is the number of samples, and the larger the absolute value of Pc, the stronger the correlation. In this paper, we use the Pearson correlation coefficient to find the remote sensing feature that is most strongly correlated with the low temperature variation, and then use this remote sensing feature value to describe the crop damage.

2.3.3 Regression model

The Logistic regression (LR) model is one of the classical machine learning methods. It is based on using the Sigmoid function to construct the linear regression, and is usually used to solve the multivariate quantitative analysis problem of binary classification (dependent variable p=1, 0). Therefore, our analysis can explore the relationships between the different cold damage factors and the occurrence of cold damage with the help of this model, and quantitatively analyze the probability of cold damage occurrence. Based on this model, the relationship between the occurrence of cold damage and the occurrence of cold damage factors in the winter wheat growing areas can be linearly expressed as:
${\rm{ln }}p = {b_0} + \mathop \sum \limits_{k = 1}^n {b_k}{F_k}$
After transformation, the equation is:
$p = \frac{1}{{1 + {\rm{exp}}\left[ { - \left( {{b_0} + \sum\limits_{k = 1}^n {{b_k}{F_k}} } \right)} \right]}}$
where p indicates the probability of cold damage occurrence in winter wheat, Fk is the kth cold damage factor, and bk is the k-th factor Logistic regression coefficient. When p is close to 1, it indicates a high probability of cold damage occurring at that point in the winter wheat growing area of the region (Wang et al., 2020).

2.3.4 Trends of the changes in climate

For analyzing the trends of the meteorological elements, the least squares method is used to calculate the linear regression coefficient a of sample and time, in order to obtain the one-dimensional linear equation of meteorological elements and time.
${\hat x_t} = b + at\;\;t = 1,2, \cdots,n$
In equation (4), ${\hat x_t}$ is the meteorological element; t is the time corresponding to ${\hat x_t}$; a, b are the linear regression coefficients. The a is used as the tendency rate of the meteorological elements, which indicates the trends of the meteorological elements every 10 yr. A positive climate tendency rate indicates an increasing trend of the meteorological elements, while a negative climate tendency rate indicates a decreasing trend of the meteorological elements (Zhang et al., 2017).

3 Results

3.1 Spatio-temporal analysis of meteorological elements in Huang-Huai-Hai Plain during the past 10 years

Meteorological elements are among the most important environmental factors in the growth of winter wheat, and the climatic production potential of crops is regulated by temperature, precipitation, light and other elements. It has been shown that the spatio-temporal distribution patterns of meteorological elements have changed to some degree (Ding et al., 2006), which has affected the climatic production potential of crops and poses a certain level of threat to agricultural production and food security (Ge et al., 2015).
In order to understand the influence of meteorological elements on the potential of winter wheat growth in the Huang-Huai-Hai Plain, this paper analyzed the spatial and temporal changes of each key meteorological element during the critical fertility period of winter wheat from 2011 to 2020 at the county level. The main meteorological elements related to the growth of winter wheat are light radiation resources, heat resources and precipitation. To understand the changes in these meteorological elements, we analyzed the spatial and temporal changes of sunshine accumulation, annual negative cumulative temperature, annual mean temperature, annual extreme drop of mean temperature, distance from the limit of low temperature, and precipitation accumulation in the Huang-Huai-Hai Plain from 2011 to 2020, and the results are shown in Fig. 5.
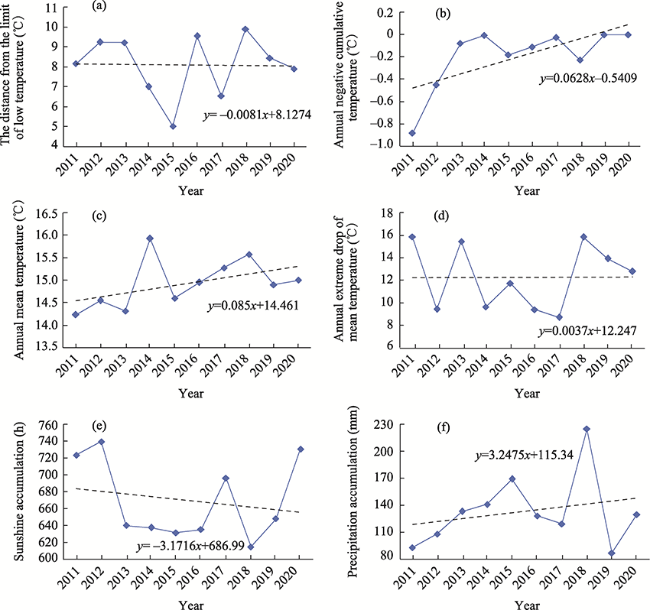
Fig. 5 Changes in meteorological elements in the Huang-Huang-Hai Plain from 2011 to 2020
Figure 5 shows that all of the meteorological elements in the winter wheat growing area of the Huang-Huai-Hai Plain have shown fluctuating changes from 2011 to 2020. Among them, the negative cumulative temperature, average temperature, and precipitation are slowly increasing, while the distance from the limit of low temperature and sunshine accumulation are slowly decreasing. These trends indicate that the heat resources of the winter wheat growing area in the Huang-Huai-Hai Plain are gradually improving in general, which is consistent with the current global warming trend and beneficial to the growth of winter wheat to a certain extent. The annual precipitation accumulation is generally increasing during the winter wheat fertility period, which is favorable for the growth of winter wheat. Contrary to the trends of heat resources and precipitation, the accumulated hours of sunshine are generally decreasing, which is unfavorable to photosynthesis in the winter wheat, reduces the accumulation of dry matter and affects the ability of the winter wheat to carry out the tasseling stage, even leading to small spikelets with few grains.
Figure 6 shows the spatial changes in the meteorological elements in the winter wheat growing area from 2011 to 2020, and the changes in each county are different from the overall trend of the Huang-Huai-Hai Plain. In this paper, the heat resources are analyzed from four perspectives: distance from the limit of low temperature, negative cumulative temperature, average temperature, and annual extreme drop of mean temperature. The maximum of distance from the limit of low temperature is decreasing gradually in general, but the eastern part of the plain (the north of Jiangsu and the north of Anhui) shows an increasing trend, which indicates that the main effect of cold damage in Huang-Huai-Hai Plain has gradually been reduced overall, but is the opposite in the eastern region. The negative temperature accumulation is gradually increasing in most of the northern region, which indicates the absolute value of negative temperature accumulation is gradually decreasing and so the risk of cold damage in this region is gradually decreasing. However, contrary to the northern region, the slope in most of the southern region is negative, so the risk is gradually increasing. From the perspective of average temperature, the winter wheat growing area in the Huang-Huai-Hai Plain has been slowly warming from 2011 to 2020. There are different trends in the annual extreme drop of mean temperature in different regions. In the north and south of the plain, it is gradually increasing, while in the eastern and central regions it is decreasing. As a result, the overall heat resources in Huang-Huai-Hai Plain are gradually increasing, which is beneficial to heat absorption in the growth of winter wheat, but the extreme low temperatures in the eastern, central, and southern regions are increasing, raising the risk of the crops being affected by cold damage and thus inhibiting growth.
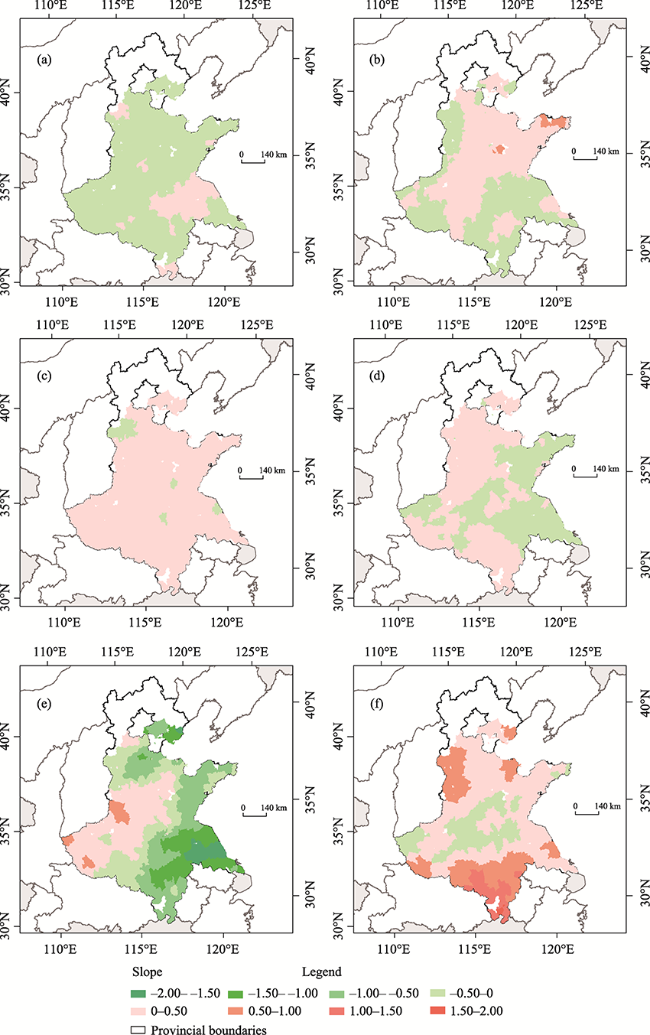
Fig. 6 Distribution of the slopes of six different meteorological elements from 2011 to 2020

Note: (a) Distance from limit of low temperature; (b) Annual negative cumulative temperature; (c) Annual mean temperature; (d) Annual extreme drop of mean temperature; (e) Sunshine accumulation (/10); (f) Precipitation accumulation (/10).

The photosynthesis of winter wheat can lead to the accumulation of dry matter and thus increase the yield. According to Fig. 6e, except for the western region, the accumulation of light in Huang-Huai-Hai Plain is gradually decreasing, and the magnitude of decrease becomes greater from the northwestern region to the southeastern region. Precipitation affects soil moisture, and higher soil moisture corresponds to more heat capacity, so the soil can absorb more heat and release it into the near-surface atmosphere when the temperature drops, thus reducing the impact of low temperatures (Meng et al., 2017; Wang et al., 2020). According to Fig. 6f, the precipitation in the winter wheat growing area is increasing to varying degrees, except in the central region, and the increase is the greatest in the southern region. Overall, the impact of low temperatures on the development of winter wheat is greatly weakened by the increase in precipitation in most regions, although the impact may be increasing in the central regions.

3.2 The model for identifying cold damage based on Logistic regression model

The daily minimum temperature was taken as the condition for indicating the occurrence of cold damage, and the changes of NDVI and FPAR in the winter wheat growing areas of the Huang-Huai-Hai Plain were taken as the descriptive variables for the winter wheat damage. Through correlation analysis among the elements, the most relevant condition and outcome factors for the occurrence of cold damage in winter wheat can be extracted, and suitable parameters can be found for building the subsequent cold damage regression model.
According to the results of the correlation analysis in Table 2, the changes of low areas of NDVI and FPAR have extremely strong correlations with the changes of daily minimum temperature, among which, the extreme low temperature has a significant correlation with the drop of NDVI, and the accumulated low temperature has a significant correlation with the low value area of FPAR. Therefore, this paper selects extreme low temperature and cumulative low temperature as the condition factors for determining whether cold damage occurs in winter wheat, and NDVI drop and FPAR area as the result factors for determining whether cold damage occurs in winter wheat. The condition factors and result factors act together as the basis for discriminating whether cold damage occurs in winter wheat. In other words, when cold damage occurs in winter wheat, it is affected by low temperature weather and that low temperature affects winter wheat growth and development.
Table 2 The Pearson’s correlation coefficients between features
Variables ALT DLT NLDT AFD DVF DRF AND DVN DRN
ALT 1 0.608** 0.470 0.672** 0.221 0.416* 0.446* 0.503* 0.430*
DLT 0.608** 1 0.277 0.396 0.165 0.480* 0.205 0.532** 0.411
NLDT 0.470 0.277 1 0.219 0.056 0.089 0.351 0.395 0.234
AFD 0.672** 0.396 0.219 1 0.471* 0.639** 0.889** 0.132 0.590**
DVF 0.221 0.165 0.056 0.471* 1 0.433* 0.603** 0.811** 0.321
DRF 0.416* 0.480* 0.089 0.639** 0.433* 1 0.632** 0.021 0.743**
AND 0.446* 0.205 0.351 0.889** 0.603** 0.632** 1 0.421* 0.705**
DVN 0.503* 0.532** 0.395 0.132 0.811** 0.021 0.421* 1 0.159
DRN 0.430* 0.411 0.234 0.590** 0.321 0.743** 0.705** 0.159 1

Note: ALT: Accumulated low temperature; DLT: Distance from the limit of temperature; NLDT: Number of low temperature days; AFD: Area of FPAR down; DVF: Decreasing value of FPAR; DRF: Decreasing rate of FPAR; AND: Area of NDVI down; DVN: Decreasing value of NDVI; DRN: Decreasing rate of NDVI; * indicates significant correlation at the 0.05 level (two tailed); ** indicates significant correlation at the 0.01 level (two tailed).

For this analysis, we selected 27 counties from five provinces in Huang-Huai-Hai Plain as the sample counties, or about 5-6 counties in each province, and each county is a major winter wheat growing county in the corresponding province. We collected the recorded cold damage of winter wheat in Huang-Huai-Hai Plain from 2005 to 2015, the distribution of winter wheat cultivation, the data for the winter wheat fertility periods in each county, and the criteria of minimum temperatures in different fertility periods of winter wheat. From these raw data, we used 148 sets of data with complete characteristics to build the model, and cold damage occurred in 96 of these 148 cases but not in the remaining 52 cases. We used Logistic regression to analyze the collected data by SPSS, the result of which shows that the significance values of extreme low temperature, cumulative low temperature, the maximum drop of NDVI and the down area of FPAR with the occurrence of cold damage were 0.010, 0.746, 0.034 and 0.002, respectively. The cumulative low temperature was removed from the model, because the P-value of this variable was more than 0.05, which means it does not pass the significance test. Lastly, we constructed the Logistic regression model with the remaining characteristics, whose accuracy of prediction reached 87.2%, and the equation of the model is:
$p = \frac{{{{\rm{e}}^{ - 5.73 + 1.222{T_{MDLMT}} + 7.416{D_{MNDVI}} + 0.085{S_{DFPAR}}}}}}{{1 + {{\rm{e}}^{ - 5.73 + 1.222{T_{MDLMT}} + 7.416{D_{MNDVI}} + 0.085{S_{DFPAR}}}}}}$
In addition, the chi-square and Hosmer-Lemeshow tests were used to test the significance of the model, and the chi- square value of the binary Logistic regression model coefficients was 116.624, with a P-value of 0.000 (<0.05), indicating the model reached the significance level. In the Hosmer-Lemeshow test, when the P-value does not reach the significance level it indicates a better overall fit of the model. In this case, the P-value is 0.894 (>0.05), which does not reach the significance level, indicating a better fit of the model. The results of these two tests combined shows that the three independent variables can effectively monitor the occurrence of cold damage.
Table 3 shows the results of the established binomial Logistic regression model. From Table 3, the regression coefficients of all the independent variables are positive, indicating that the greater the daily low temperature extremes in the winter wheat growing area of a region at a certain time, the greater the decrease in NDVI in that region; and the larger the area of the low FPAR zone, the more likely it is that cold damage occurs in the winter wheat in that region.
Table 3 Variables in the binary Logistic regression equations
Variables Coefficient Standard error Wald Degree of freedom Significance OR value
Low temperature extreme 1.222 0.263 21.520 1 0.000 3.395
(NDVI) Maximum decrease 7.416 3.472 4.562 1 0.033 1662.335
(FRAR) Low-value area 0.085 0.027 9.972 1 0.002 1.089
Constants -5.730 1.221 22.016 1 0.000 0.003
To further verify the accuracy of the cold damage identification model based on the Logistic regression model, the ROC curve analysis was conducted with the prediction result P as the independent variable and the actual cold damage occurrence (or not) as the dependent variable. The results and the ROC curve are shown in Table 4 and Fig. 6, respectively, and the closer the ROC curve is to the upper left corner, the higher the accuracy of the test. The area under the ROC curve is AUC, which is a measure of the model. The value of AUC ranges from [0.5,1], and the larger the value, the better the discrimination ability of the model. The vertical coordinate is the rate of cold damage that was correctly predicted to occur, and the horizontal coordinate is the rate of no cold damage when cold damage was predicted to occur (Tian et al., 2016). The area AUC value under the validation result of the ROC curve was 0.956, indicating that the cold damage identification model based on the Logistic regression model can identify the occurrence of cold damage in winter wheat in Huang-Huai-Hai Plain more objectively and accurately.
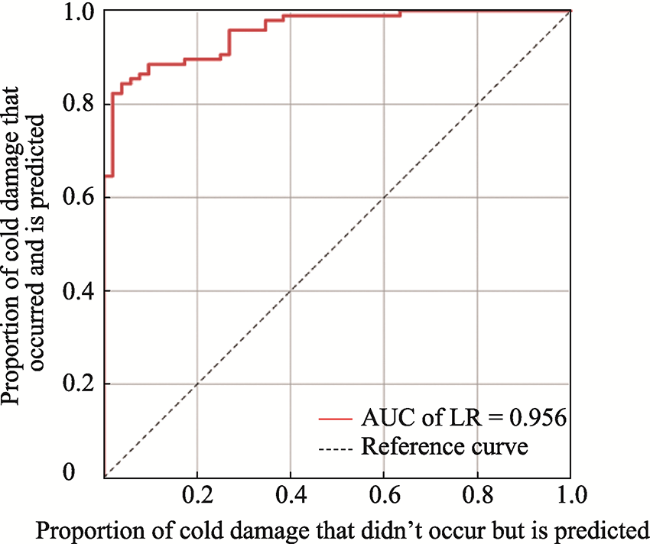
Table 4 The result of the ROC curve
Variable Area under the ROC curve Standard error Progressive significance Asymptotic 95%
confidence interval
Lower limit Upper limit
Value 0.956 0.015 0.000 0.928 0.985
Fig. 7 The ROC curve of the cold damage identification model

3.3 Spatio-temporal analysis of cold damage in the Huang-Huai-Hai Plain during the past 10 years

Based on the ROC analysis, when p was 69.29%, the corresponding Jorden index was the largest, indicating that this predicted probability was the most capable of achieving the accurate determination of cold damage occurrence (Zhang et al., 2020). Based on this equilibrium point, this paper presents a spatial and temporal analysis of the probability, frequency, and annual number of counties affected by cold damage during the greening-filling period in the winter wheat growing areas of the Huang-Huai-Hai Plain from 2011 to 2020.
Since the probability of cold damage increases with the intensity of low temperature and the corresponding intensity of cold damage to winter wheat, the higher the probability of cold damage, the greater the degree of cold damage to winter wheat and the greater the impact of cold damage when it occurs. As shown in Figs. 8-9, the number of counties with cold damage shows reduced volatility from 2011 to 2020 overall. Although it reached peaks of interannual variation in 2012, 2016 and 2019, the overall situation of cold damage in winter wheat is gradually improving. Due to the large span of Huang-Huai-Hai Plain from north to south, this paper separately analyzed the results in the main five provinces to provide a more in-depth understanding of cold damage in the winter wheat growing areas. The provincial results differed from the overall distribution of Huang- Huai-Hai Plain (Fig. 9), which shows that the number of counties with cold damage in the north is gradually decreasing, while the number in the south is gradually increasing.
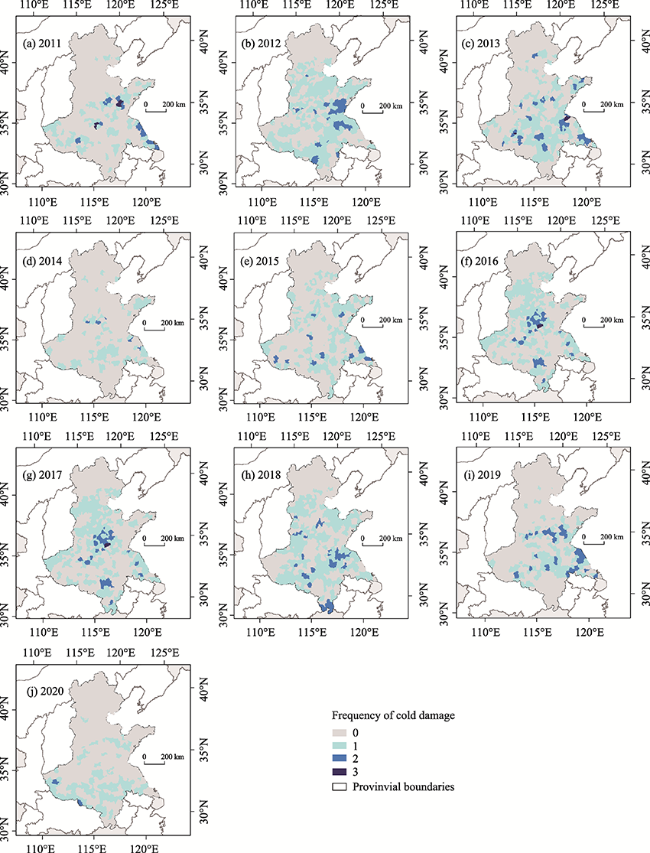
Fig. 9 Distribution of annual frequency of cold damage by county in each year from 2011—2020
To further analyze the changes in the number of counties in each province, we generated statistics on the slopes of the changes in the number of counties with cold damage in each province and overall (Fig. 10). The slopes of change in Hebei, Shandong, Henan, Jiangsu, and Anhui are -0.5333, -2.1812, 0.4424, 0.2667, and 0.3576, respectively. The number of counties with cold damage in Shandong is significantly reduced, and in Hebei it is improving, while in Henan, Jiangsu and Anhui it is gradually intensifying. Among these three, in Henan it is intensifying the most, followed by Anhui, and in Jiangsu it is relatively slow.
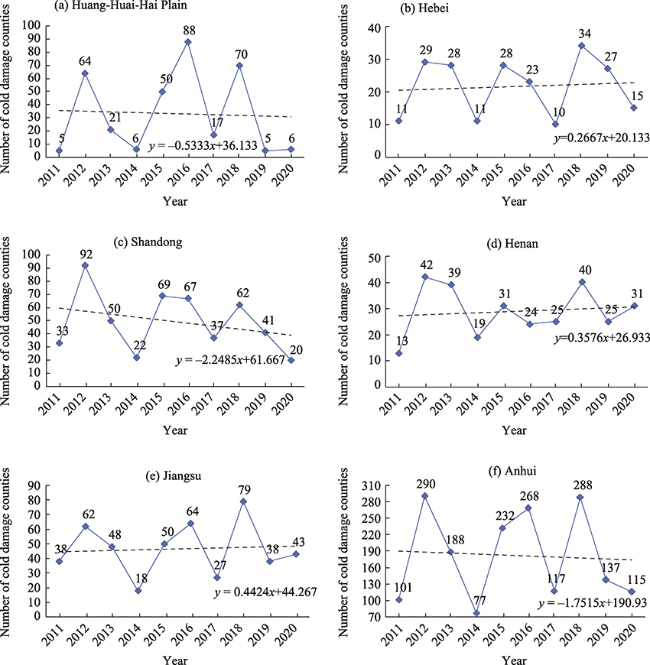
Fig. 10 Number of cold damage counties in the Huang-Huai-Hai Plain and major provinces from 2011-2020
Since cold damage has a certain cumulative effect on winter wheat, this paper monitored the frequency of cold damage in each county of the Huang-Huai-Hai Plain (Fig. 9). The frequency of cold damage in the winter wheat growing area is gradually decreasing. Furthermore, the highest frequency in the whole region is gradually decreasing from 3 to 2, and the number of counties with a high frequency of cold damage is gradually decreasing, which shows that the area with high frequency of cold damage is gradually shifting to the south.
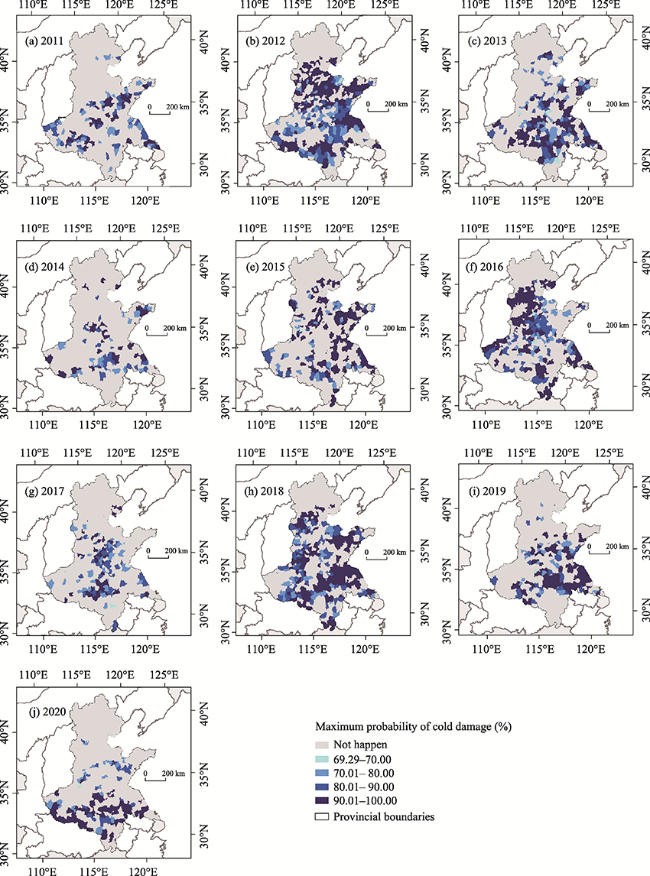
Fig. 8 Distribution of the maximum probability of the occurrence of cold damage in the counties in each year from 2011-2020

3.4 Spatio-temporal relationships between meteorological elements and cold damage

In order to further determine the meteorological causes of cold damage to winter wheat in Huang-Huai-Hai Plain from 2011 to 2020, we conducted a correlation analysis between the probability of cold damage in counties (counties exhibiting cold damage and all counties) and meteorological elements, in order to visualize the influences of the different meteorological elements on the occurrence of cold damage (Table 5).
Table 5 Correlation analysis between the probability of cold damage occurrence and meteorological factors in each county and the counties exhibiting cold damage from 2011 to 2020
Variable DLLP ETP NCT AT PA SA
PO in each county 0.303** -0.024 0.044** -0.180** -0.102** -0.047**
PO in counties exhibiting cold damage 0.407** -0.011 -0.095** -0.073** -0.012 -0.019

Note: DLLP: Distance from the limit of low temperature; ETP: Extreme temperature drop; NCT: Negative cumulative temperature, AT: Average temperature, PO: Probability of occurrence, PA: Precipitation accumulation; SA: Sunshine accumulation. *: Correlation is significant at the 0.05 level (two-tailed); **: Correlation is significant at the 0.01 level (two-tailed).

Table 5 shows a significant correlation between the occurrence of cold damage and each meteorological element in each county of the winter wheat growing area in Huang-Huai-Hai Plain from 2011 to 2020. The probability of cold damage is negatively correlated with precipitation accumulation, light duration accumulation and average temperature of the critical fertility period, among which the average temperature has the greatest effect, flowed by pre cipitation accumulation. The distance from the limit of low temperature and negative cumulative temperature have the opposite effect, and the influence of the former is greater.
From Table 6, in the counties identified as having cold damage, the impact of cold damage is only significantly correlated with heat resources, but not with sunshine resources or precipitation. In addition, the more the minimum temperature was below the daily minimum temperature limit for each fertility period, the more negative the cumulative temperature and the lower the average temperature, then the higher the probability of cold damage in the county and the more serious the inhibition of low temperature on crop growth. Among these factors, the distance from the limit of low temperature contributed the most to the probability, while the effects of negative cumulative temperature and average temperature were relatively small, which also indicated that extreme low temperature had the greatest impact on the growth of crops to some extent.
Table 6 Correlation analysis between the occurrence probability of cold damage and meteorological factors in each county of the major grain provinces from 2011 to 2020
Province DLLP ETP NCT AT PA SA
Hebei 0.418** 0.058* -0.137** -0.185** 0.007 -0.029
Shandong 0.192** -0.008 -0.035 -0.083** 0.015 0.037
Henan 0.353** -0.031 -0.010 -0.202** 0.117** -0.010
Jiangsu 0.213** 0.015 0.012 -0.248** 0.085 -0.130**
Anhui 0.324** 0.021 -0.011 -0.045 0.174** -0.104**

Note: Abbreviations are the same as in Table 5. * and ** mean the significant level are at the 0.05 and 0.01, respectively.

Since the Huang-Huai-Hai Plain is vast and spans a large area from north to south, there are some heterogeneities in the meteorological characteristics. Therefore, in order to understand the meteorological causes of the occurrence of cold damage to winter wheat more specifically, the correlation analysis between cold damage in each of the major grain provinces of Huang-Huai-Hai Plain and the meteorological characteristics of the corresponding counties was carried out separately (Table 6).
Table 6 shows that the influence of each meteorological element on cold damage of winter wheat varies among the provinces. Compared to the other meteorological features, the influence of distance from the limit of low temperature on cold damage in each province is the greatest, and the degree of the positive correlations for different provinces from strongest to weakest is: Hebei, Anhui, Henan, Jiangsu, and Shandong. Next is average temperature, which has a significant negative correlation with cold damage in four of the provinces. The impact in different provinces from strongest to weakest is: Jiangsu, Henan, Hebei, and Shandong. The precipitation accumulation is only positively correlated with cold damage in Henan and Anhui. The sunshine accumulation is only negatively correlated with cold damage in Jiangsu and Anhui, and negative cumulative temperature is only negatively correlated with the probability of cold damage in Hebei.

4 Discussion

Nowadays, many scholars are studying the cold damage based either on the meteorological data of individual locations with high accuracy (Zheng et al., 2015; Liu et al., 2019) or remote sensing data with wide coverage (Lou et al., 2013; Kim et al., 2014; Nuttall et al., 2019). However, the former is limited by the distribution of meteorological stations (Ma et al., 2019; Li et al., 2020), and the latter is influenced by the sensors and the weather conditions (Wang et al., 2003), in which the accuracy is lower than the former.
To overcome these limitations, by integrating remote sensing data and meteorological data, the model used in this study can monitor the cold damage of winter wheat at the level of county, which can compensate for the limited scope with high accuracy in monitoring cold damage due to the uneven coverage of stations (Guo et al., 2020). Based on the model, we can determine the spatio-temporal changes in the occurrence of cold damage, which can give data support to the corresponding governments in making decisions and some cultivation guidance to growers for their agricultural production. Meanwhile, compared with single factor statistical methods, this approach gives better correlations and stable correlation coefficients for each of the factors by using NDVI and FPAR as response factors of winter wheat (Li et al., 2020).
In addition, because the probability of cold damage is calculated from the low-temperature condition and the response of winter wheat, this means that the higher the probability of cold damage, the lower temperature, and the worse the impact on crop growth due to the low temperature. This approach is used in this paper to analyze the changes of cold damage to winter wheat from 2011 to 2020 (Fig. 10), the results of which are consistent with the trends of low- temperature freezing and snow damage areas (Table 7) in Hebei, Henan, Jiangsu, and Huang-Huai-Hai Plain, although they differ from those in Shandong and Anhui. This difference is related to the fact that the crop species recorded are not limited to winter wheat, and this paper only analyzed the number of counties affected by disasters in winter wheat, but not the yield. Furthermore, the influence of cold temperature is different in different kinds of winter wheat, which also relates to the farmers’ irrigation patterns and soil types (Zhao et al., 2021). In future studies, we will consider these elements in constructing a more refined monitoring model.
Table 7 The affected areas of freezing and snow disasters in each province from 2011 to 2019 (Unit: ha)
Year Province or region
Hebei Shandong Henan Anhui Jiangsu Huang-Huai- Hai Plain
2011 39.8 20.8 23.7 145.2 3.1 232.6
2012 254.4 0 0 1.3 0 255.9
2013 158.6 56.0 71.8 248.8 56.0 591.2
2014 105.2 0.2 9.9 41.0 0.5 146.8
2015 57.1 43.1 19.9 58.1 58.8 237.0
2016 15.4 26.5 0.1 19.3 4.1 65.4
2017 41.4 1.3 0.7 0.1 0 43.5
2018 121.1 103.2 99.1 36.9 99.4 459.7
2019 10.2 0.3 0 0 0.2 10.7
Slope -14.0417 2.4083 0.8416 16.5517 2.9700 -24.2167

Note: Data are from Chinese Statistical Yearbook (2011-2019).

5 Conclusions

In this paper, we combined remote sensing data and meteorological data to study the influence of temperature on cold damage of winter wheat in the Huang-Huai-Hai Plain from 2011 to 2020, both on a large scale and at the county level. Through Pearson correlation analysis, we constructed the cold damage monitoring model with the parameters ofthe distance from the limit of low temperature, the maximum drop of NDVI and the down area of FPAR. Based on this model, we analyzed the relationships between cold damage of winter wheat and several meteorological elements, which led to three main conclusions.
Firstly, the heat resources in Huang-Huai-Hai Plain are gradually increasing; except in the western region, the accumulated hours of sunlight are decreasing, and the magnitude of decrease is shifting more from the northwestern region to the southeastern region; while the precipitation accumulation increases to varying degrees, except in the central region.
Secondly, the cold temperature has had less impact on the growth of winter wheat from 2011 to 2020, the cold damage areas with high probability and high frequency are moving from north to south, and the situation of cold damage is gradually improving in the north, which is contrary to the situation in the south.
Thirdly, the meteorological elements that influence the degree of cold damage are, in descending order, heat, precipitation and sunshine duration; and there is spatial variability in its impact.
[1]
Campoy J, Campos I, Plaza C, et al. 2020. Estimation of harvest index in wheat crops using a remote sensing-based approach. Field Crops Research, 256: 107910. DOI: 10.1016/j.fcr.2020.107910.

DOI

[2]
Cao Q, Yao F M, Lin E D, et al. 2011. Analysis of changing characteristics of agricultural climate resources in the main planted areas of winter wheat in China over last 50 years. Chinese Journal of Agrometeorology, 32(2): 161-166. (in Chinese)

[3]
Chu R H, Shen S H, Lv H Q, et al. 2015. Changing characteristics of agro-climatic resources in the winter wheat region of the Huang-Huai- Hai Sea under climate change scenarios. Science Technology and Engineering, 15(26): 1-10, 18. (in Chinese)

[4]
Ding Y H, Ren G Y, Shi G Y, et al. 2006. Climate change country assessment report (I): Historical and future trends of climate change in China. Advances in Climate Change Research, 2(1): 3-8. (in Chinese)

[5]
Ge Y N, Liu L, Xu X L, et al. 2015. Temporal and spatial variations of Chinese maize production potential on the background of climate change during 1960-2010. Journal of Natural Resources, 30(5): 784-795. (in Chinese)

[6]
Guo C M, Ren J Q, Wang D N, et al. 2020. Temporal and spatial characteristics of rice cold damage in Jilin from 1961 to 2018. Chinese Agricultural Science Bulletin, 36: 109-117. (in Chinese)

[7]
Guo J P. 2016. Research progress on agricultural meteorological disaster monitoring and forecasting. Journal of Applied Meteorological Science, 27(5): 620-630. (in Chinese)

[8]
Jiang H, Deng W M, Chen X Q. 2014. Analysis of wine based on Pearson coefficient and multiple kernel support vector classification. Transactions of the Chinese Society for Agricultural Machinery, 45(1): 203-208. (in Chinese)

[9]
Jiao X M, Zhang H L, Xu F G, et al. 2020. Analysis of the spatio-temporal variation in FPAR of the Tibetan Plateau from 1982 to 2015. Remote Sensing Technology and Application, 35: 950-961. (in Chinese)

[10]
Kim Y, Kimball J S, Didan K, et al. 2014. Response of vegetation growth and productivity to spring climate indicators in the conterminous United States derived from satellite remote sensing data fusion. Agricultural and Forest Meteorology, 194: 132-143.

DOI

[11]
Li J L, Xue C Y, Zou C H, et al. 2020. Remote sensing monitoring of late frost of winter wheat in Henan Province based on land surface temperature retrieval. Meteorological and Environmental Sciences, 43(4): 11-17. (in Chinese)

[12]
Lin P. 2020. An overview of agricultural water management strategies based on ecosystem conservation. Sichuan Water Resources, 41: 129-131. (in Chinese)

[13]
Liu H J, Ni Y J, Ren D C, et al. 2018. Estimation and distribution of minimum air temperature within winter wheat canopy in prone period of late frost. Chinese Journal of Agrometeorology, 39(12): 786-795. (in Chinese)

[14]
Liu L L, Song H, Shi K J, et al. 2019. Response of wheat grain quality to low temperature during jointing and booting stages-On the importance of considering canopy temperature. Agricultural and Forest Meteorology, 278(15): 107658. DOI: 10.1016/j.agrformet.2019.107658.

DOI

[15]
Liu M, Lv A F, Wu J J, et al. 2014. A review of impacts of drought on agro-ecosystem. Chinese Agricultural Science Bulletin, 30: 165-171. (in Chinese)

[16]
Lou W P, Ji Z W, Sun K, et al. 2013. Application of remote sensing and GIS for assessing economic loss caused by frost damage to tea plantations. Precision Agriculture, 14(6): 606-620.

DOI

[17]
Ma S Q, Zhang B, Tang M, et al. 2019. Temporal and spatial evolution on late frost damage of winter wheat in Huaihe River Basin. Journal of Triticeae Crops, 39(1): 105-113. (in Chinese)

[18]
Meng L, Wu Y F, Hu X, et al. 2017. Using hyperspectral data for detecting late frost injury to winter wheat under different topsoil moistures. Spectroscopy and Spectral Analysis, 37(5): 1482-1488.

[19]
Nuttall J G, Perry E M, Delahunty A J, et al. 2019. Frost response in wheat and early detection using proximal sensors. Journal of Agronomy and Crop Science, 205(2): 220-234.

DOI

[20]
Qian Y L, Wang J L, Zheng C L, et al. 2014. Spatial-temporal change of low temperature disaster of winter wheat in North China in last 50 years. Chinese Journal of Ecology, 33(12): 3245-3253. (in Chinese)

[21]
Tian C S, Liu X L, Wang J. 2016. Geohazard susceptibility assessment based on CF model and Logistic Regression models in Guangdong. Hydrogeology & Engineering Geology, 43(6): 154-161, 170. (in Chinese)

[22]
Wang J J, Guo M C, Jiang Z D, et al. 2010. The construction and application of an agricultural ecological-economic system coupled process model. Acta Ecologica Sinica, 30: 2371-2478. (in Chinese)

[23]
Wang L X, Qin Q M, Zhang X Y. 2003. Progress on monitor of rice low temperature disaster with remote sensing. Meteorological Monthly, 29(10): 3-7.

[24]
Wang S, Chen J, Rao Y H, et al. 2020. Response of winter wheat to spring frost from a remote sensing perspective: Damage estimation and influential factors. ISPRS Journal of Photogrammetry and Remote Sensing, 168: 221-235.

DOI

[25]
Wang Y, Guo E X, Zhang H, et al. 2020. Analysis of urban development boundary delineation and influencing factors in Chongqing City based on Logistic regression. Journal of Chongqing Normal University (Natural Science), 37(5): 59-72. (in Chinese)

[26]
Xiao L J, Liu L L, Asseng S, et al. 2018. Estimating spring frost and its impact on yield across winter wheat in China. Agricultural and Forest Meteorology, 260-261: 154-164.

DOI

[27]
Xu J W, Ju H, Mei X R, et al. 2015. Simulation on potential effects of drought on winter wheat in Huang-Huai-Hai Plain from 1981 to 2010. Transactions of the Chinese Society of Agricultural Engineering, 31(6): 150-158. (in Chinese)

[28]
Yang K, Chen B B, Chen H, et al. 2020. Comprehensive climatic index and grade classification of cold damage for Taiwan Green Jujube in Fujian. Journal of Applied Meteorological Science, 31(4): 427-434. (in Chinese)

[29]
Zhang J, Xie Y N, Wang M Q, et al. 2019. Estimation of daily value from PAR instantaneous value. Arid Zone Research, 36: 220-270. (in Chinese)

[30]
Zhang M T, Zhang Y J, Tong J H, et al. 2017. Evaluation of agricultural climate resources in the potential northward region of winter wheat. Journal of Meteorology and Environment, 33(6): 73-81. (in Chinese)

[31]
Zhang X R, Feng M C, Yang W D, et al. 2017. Using spectral transformation processes to estimate chlorophyll content of winter wheat under low temperature stress. Chinese Journal of Eco-Agriculture, 25(9): 1351-1359. (in Chinese)

[32]
Zhang Y, Shu X L, Zhong B, et al. 2020. Application of Logistic model combined with ROC curve and Bayes discriminant function in the diagnosis of severity of COVID-19. Chinese Journal of Disease Control & Prevention, 24(7): 851-855. (in Chinese)

[33]
Zhao H F, Pan S Q, Qiao Y F, et al. 2021. The response of winter-wheat yield to elevated temperature varied with soil types. Chinese Agricultural Science Bulletin, 37(2): 74-79. (in Chinese)

[34]
Zhao H, Wang X C, Cao T J, et al. 2011. Analysis of current state and development trends of wheat cultivars applications in the south of Huang-Huai winter wheat zone. Journal of Henan Agricultural Sciences, 40: 44-49. (in Chinese)

[35]
Zheng D X, Yang X G, Zhao J, et al. 2015. Spatial and temporal patterns of freezing injury during winter in Huang-Huai winter wheat area under climate change. Acta Ecologica Sinica, 35(13): 4338-4346. (in Chinese)

[36]
Zhu W F, Wang S L, Caldwell C D. 2010. Agro-ecosystem service and its managerial essence. Chinese Journal of Eco-Agriculture, 18: 889-896. (in Chinese)

DOI

Outlines

/