Ecosystem Services and Eco-compensation

Evaluating Agricultural Water Pollution with the Waste Absorption Footprint (WAF) in Huzhou City, China

  • LI Jing , 1, 2 ,
  • JIAO Wenjun , 2, * ,
  • MIN Qingwen , 2, * ,
  • LI Wenhua 2 ,
  • ZHAO Junkai 3
Expand
  • 1. Chuzhou University, Chuzhou, Anhui 239000, China
  • 2. Institute of Geographic Sciences and Natural Resources Research, Chinese Academy of Sciences, Beijing 100101, China
  • 3. Jiujiang University, Jiujiang, Jiangxi 332000, China
* JIAO Wenjun, E-mail: ;
MIN Qingwen, E-mail:

LI Jing, E-mail:

Received date: 2021-07-23

  Accepted date: 2021-10-20

  Online published: 2022-01-08

Supported by

The National Natural Science Foundation of China(41861022)

The National Natural Science Foundation of China(41961008)

The National Natural Science Foundation of China(41801204)

The Science and Technology Project in Jiangxi Province Department of Education(GJJ180903)

The Consulting Research Project of Chinese Academy of Engineering(2021-XBZD-8)

Abstract

Agricultural production is considered one of the most important sources of water quality deterioration in the Taihu Lake Basin, China. Crop farming, livestock & poultry breeding and aquaculture are primary agricultural non-point sources and their impacts on the water environment are, in most cases, evaluated separately. Therefore, it is a challenge for current research to consider all of the different agricultural non-point sources as a whole and assess their combined influence on the water environment. The purpose of this paper is to evaluate the conjoint impact that agricultural non-point sources such as crop farming, livestock & poultry breeding and aquaculture have had on the local water environment in the Taihu Lake Basin by taking Huzhou City of Zhejiang Province as a case study. To achieve this, a new, innovative approach named the “Waste Absorption Footprint” (WAF) is applied. The results show that nitrogen and phosphorus pollution generated by agricultural production are more serious than that of organic substances, while aquaculture and crop farming are more critical pollution sources compared with livestock and poultry breeding, and so they should be the focus of environmental management and pollution control initiatives. There is a regional discrepancy in the spatial distribution of agricultural non-point source pollution across counties and districts, which provides information for determining the key regions for the treatment of agricultural pollution. This study demonstrates that the WAF method can make a comprehensive assessment of the influence of agricultural production on the water environment and provide references for the control and management of agricultural non-point source pollution, which is of great importance for management of the water environment.

Cite this article

LI Jing , JIAO Wenjun , MIN Qingwen , LI Wenhua , ZHAO Junkai . Evaluating Agricultural Water Pollution with the Waste Absorption Footprint (WAF) in Huzhou City, China[J]. Journal of Resources and Ecology, 2022 , 13(1) : 93 -99 . DOI: 10.5814/j.issn.1674-764x.2022.01.010

1 Introduction

The pollution of water bodies is a global environmental problem today, affecting water resources, ecosystems and human health. Water pollution occurs when the amounts of pollutants discharged into a water body can no longer be accommodated by the natural ecosystem (Hu and Cheng, 2013; Ma et al., 2020). Over the past several decades, China’s surface water and ground water have been heavily polluted by industrial and municipal waste water, household wastes, and the overuse of agricultural chemicals (Liu and Diamond, 2005; Huang et al., 2021). Taihu Lake Basin is a representative example. The water quality in the Taihu Lake Basin presents a strong trend of deterioration, which is caused by rapid industrial growth and urban expansion, together with changes in agricultural practices that promote the use of chemicals (Qin et al., 2007; Sun et al., 2009; Yan et al., 2009; Wu et al., 2018).
Since the 1990s, China has taken a series of measures to control pollutant discharges and to improve the water quality in the Taihu Lake Basin (Zhang et al., 2008; Yang and Liu, 2010; Qin et al., 2019; Wang et al., 2019), with the most famous one being the ‘Zero’ action implemented in 1998 to reduce industrial waste water discharges (Wang et al., 2009). However, the water quality in the Taihu Lake Basin is still unstable and continues to knock its ecosystem out of balance (Jiao et al., 2011), although the ‘Zero’ action has brought a sharp decrease in the total amount of COD in the discharged industrial wastewater (Huang, 2005). Some research shows that nitrogen and phosphorus discharged from agricultural non-point sources contribute 83% and 84%, respectively, to the total amounts of nitrogen and phosphorus discharged into Taihu Lake (Zhang et al., 2018; Wu et al., 2019), and the quantities of nitrogen and phosphorus released from agricultural non-point sources have surpassed those from point sources (Huang et al., 2006). It is evident that agriculture production, including crop farming, livestock & poultry breeding and aquaculture, has become a main source of water pollution in the Taihu Lake Basin.
Compared with industrial and municipal sources, water pollution caused by agricultural sources has received much less attention in China because such non-point sources are more difficult to detect and regulate (Hu and Cheng, 2013; Tong et al., 2017). Since about 2000, China has gradually begun to formulate policies to reduce non-point pollution caused by agricultural soil runoff in the Taihu Lake Basin (Reidsma et al., 2012; Ma et al., 2014). Extensive scientific research has also been performed on the measurement of coefficients of nutrient losses from crop farming, livestock & poultry breeding and aquaculture through field surveys and fixed location monitoring (Gao et al., 2005; Tang et al., 2005; Li et al., 2007), as well as on the effects that crop farming (Duan et al., 2007; Kalamaras et al., 2014), livestock & poultry breeding (Zampella et al., 2007; Wang et al., 2018) and aquaculture (Wang et al., 2021) have had on the local water environment. However, in most cases the influences that the different agricultural non-point sources have imposed on the water environment in the Taihu Lake Basin are evaluated separately. Therefore, it is a challenge for current research to consider planting, livestock & poultry breeding and aquaculture as a whole, and to assess their influence on the water environment in an integrated way.
The overall goal of this paper is to evaluate the conjoint impact that agricultural non-point sources have had on the local water environment in the Taihu Lake Basin. To achieve this, a new, innovative method named the Waste Absorption Footprint (WAF) is applied (Jiao et al., 2013). Huzhou City of Zhejiang Province is selected as a case study. It is located in the upstream of the Taihu Lake Basin, where organic substances, nitrogen and phosphorus discharged from crop farming, livestock & poultry breeding and aquaculture make substantial contributions to the local water pollution. Based on the footprint results, the differences in the impacts of different agricultural activities are analyzed and the regional discrepancy in the spatial distribution of agricultural non-point source pollution is revealed.

2 Materials and methods

2.1 Site description

Taihu Lake is the third-largest freshwater lake in China (30°5'-32°8'N and 119°8'-121°55'E), with a catchment area of 36500 km2. Taihu Lake Basin is located in the eastern part of China, within the administrative divisions of the provinces of Jiangsu, Zhejiang and Anhui, as well as the municipality of Shanghai. It is one of the most developed areas in China, playing a significant role in the development of the national economy. The Gross Domestic Product (GDP) in 2008(① For the deployment of National Pollution Source Survey is once every 10 years and we have not obtained the data of the Second National Pollution Source Survey, the data of this paper is based on that of the First National Pollution Source Survey.) amounted to 3311 billion yuan, contributing approximately 11.0% of the nation’s total GDP. However, with economic expansion, population growth and technological development, the increased amounts of organic substances and nutrients discharged into the water system have resulted in an overall decline in water quality of the Taihu Lake Basin. For instance, in 2008, 85.2% of the length of rivers that were evaluated had a water quality lower than Class III during that one-year period, while 7.4% of the area of the Taihu Lake was Class IV in water quality, 11.5% was Class V, and the rest was worse than Class V in that year(② The classification of water quality is based on more than 20 indicators grouped from I to V. The water quality gets worse progressively from Class I to Class V. This system is described in more detail in “Environmental Quality Standards for Surface Water (GB3838-2002)”. The data on water quality of the Taihu Lake Basin were obtained from “Taihu Basin & Southeast Rivers Water Resources Bulletin 2008”.).
Huzhou City of Zhejiang Province is located in the upstream of the Taihu Lake Basin, with an area of 5818 km2 and a population of 2.58 million in 2008, composed of Deqing County, Changxing County, Anji County, Nanxun District and Wuxing District (Fig. 1). It is an agriculturally productive area with 143810 ha of farmland in 2008, of which paddy fields accounted for 88%. The total agricultural output value was 14.45 billion yuan, of which 44% was from crop farming, 23% from livestock & poultry breeding and 17% from aquaculture.
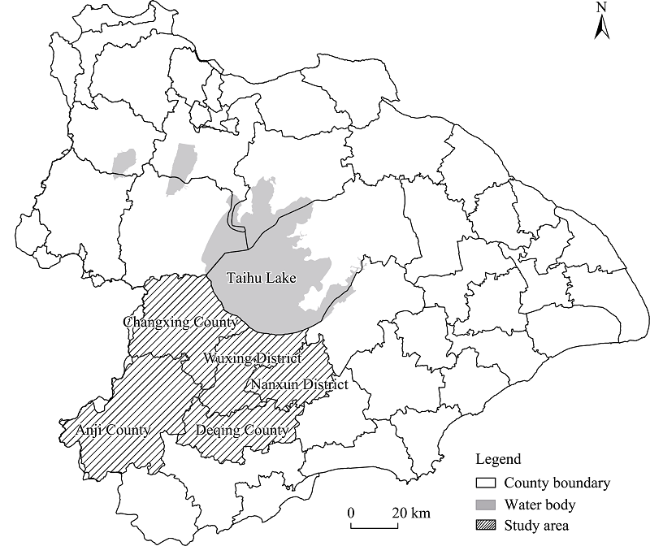
Fig. 1 The location of the study area in the Taihu Lake Basin
The river network in Huzhou is well-developed, consisting of three large water systems. According to the results of the remote sensing interpretation of the land-use map in 2008 (scale 1:100000), the total area of water systems in Huzhou was about 20896 ha, of which the areas of water systems in Deqing, Changxing, Anji, Nanxun and Wuxing were 4964 ha, 3000 ha, 2828 ha, 4192 ha and 5912 ha, respectively. Water quality deterioration is a serious threat to the sustainable development of Huzhou. In 2008, the monitoring results of river water quality showed that 30.6% of the monitoring sections had a water quality lower than Class III(③ Huzhou environment quality bulletin in 2008.), and the major pollution indicators were ammonia nitrogen, total phosphorus, and biochemical oxygen demand.

2.2 Methods

2.2.1 The WAF method

The Waste Absorption Footprint (WAF) proposed by Jiao et al. (2014) is a methodological approach for the evaluation of environmental sustainability in terms of waste absorption. In this method, waste absorption is defined as a measure of how much land and water area is required by a given population or activity to absorb the wastes it generates given the current waste treatment technologies and environmental management practices. The WAF method is designed to include all the wastes that can be absorbed, broken down or removed by biological processes and to track human demand for waste absorption services from different land-use types. However, only two waste absorption services have been explicitly identified so far, which are the carbon sequestration that occurs in terrestrial ecosystems through photosynthesis and the removal of surplus nutrients through biodegradation in inland water ecosystems (Jiao et al., 2013, 2014).
Although customized WAF models are recommended to be established according to specific kinds of wastes, for any land use type, the Waste Absorption Footprint (WAF) of a country, in global hectares of absorptivity equivalents, is generally given by:
$WAF=\frac{W}{GA}\times EQ{{F}_{a}}=\frac{W}{NA}\times S{{F}_{a}}\times EQ{{F}_{a}}$
where W is the amount of a waste released (kg); GA is the global average absorptivity for W (kg ha-1); EQFa is the absorptivity equivalence factor for the given land use type; NA is the national average absorptivity for W (kg ha-1); and SFa is the absorptivity supply factor for the land use type.

2.2.2 Development of agricultural WAF models

Since the decline in the water quality in Huzhou is mainly caused by the large amounts of organic substances and nutrients discharged into the water body, chemical oxygen demand (COD, used here as an indicator of organic substances), as well as nitrogen and phosphorus are the primary considerations in this analysis. Agricultural WAF models of COD (WAFagri_cod), nitrogen (WAFagri_n) and phosphorus (WAFagri_p), which respectively represent the local water area required to absorb COD, nitrogen and phosphorus released from agricultural sources, were then developed for the city of Huzhou guided by the WAF theory. All the results are expressed in units of local hectares (ha) which refer to hectares of the absorptive water area based on the average absorptivity in Huzhou.
For inland water, equations for WAFagri_cod, WAFagri_n, and WAFagri_p of Huzhou are given by:
$WA{{F}_{agri\_cod}}={{W}_{agri\_cod}}/L{{A}_{agri\_cod}}$
$WA{{F}_{agri\_n}}={{W}_{agri\_n}}/L{{A}_{agri\_n}}$
$WA{{F}_{agri\_p}}={{W}_{agri\_p}}/L{{A}_{agri\_p}}$
where $WA{{F}_{agri\_cod}}$, $WA{{F}_{agri\_n}}$, $WA{{F}_{agri\_p}}$ are the footprints of COD, nitrogen and phosphorus, respectively, from agriculture; ${{W}_{agri\_cod}}$, ${{W}_{agri\_n}}$, ${{W}_{agri\_p}}$ are the amounts of COD, nitrogen and phosphorus discharged into the water from agricultural sources (kg), respectively; and $L{{A}_{agri\_cod}}$, $L{{A}_{agri\_n}}$, $L{{A}_{agri\_p}}$ are the local average absorptivities for COD, nitrogen and phosphorus (kg ha–1), respectively.
(1) Calculation of waste amounts
The amounts of COD, nitrogen and phosphorus that were discharged into the water from agricultural production were calculated based primarily on the data obtained from the ‘Country’s First National Census on Pollution Sources’ in 2007. That survey provided the data for the main pollutants such as COD, nitrogen and phosphorus from crop farming, livestock & poultry breeding and aquaculture sources with the town as the basic unit (Li et al., 2014a). The amount of a pollutant discharged into the water from agriculture was obtained by adding together the amounts of the pollutant from the different sources of all the towns in the city administrative area (Li et al., 2014b). The results showed that in 2008 the Wagri_cod, Wagri_n and Wagri_p were 5214609 kg, 1192261 kg and 130430 kg for Huzhou, respectively (Table 1).
Table 1 Amounts of pollutants discharged into the water from agricultural sources in Huzhou in 2008 (Unit: kg yr-1)
Agricultural source COD Nitrogen Phosphorus
Crop farming 864809 696495 45640
Livestock and poultry breeding 613807 43986 6460
Aquaculture 3735993 451780 78330
Total 5214609 1192261 130430
(2) Calculation of local absorptivities
The local average absorptivities were calculated by dividing the maximum loads of pollutants that can be absorbed by the area of the water system in Huzhou. The ‘General Plan about Comprehensive Treatment of Ambient Water in the Taihu Lake Basin’ showed that the maximum loads of COD, nitrogen and phosphorus were 3.685×10⁷ kg, 3.226×10⁶ kg and 2.09×10⁵ kg for Huzhou, respectively. The total area of the water system in Huzhou was 20896 ha based on the results of the remote sensing interpretation of a 2008 land-use map of Huzhou City (scale 1:100000). Therefore, $L{{A}_{agri\_cod}}$, $L{{A}_{agri\_n}}$ and $L{{A}_{agri\_p}}$ in Huzhou City were 1763 kg ha–1, 154.4 kg ha–1 and 10.0 kg ha–1, respectively.

2.2.3 Footprints from different agricultural sources

The footprints of COD, nitrogen and phosphorus from a source category (i.e., crop farming, livestock & poultry breeding or aquaculture) are aggregated to obtain the footprint from that source. The equation for the footprint from crop farming ($WA{{F}_{plant}}$), for example, was given by:
$WA{{F}_{plant}}=WA{{F}_{plant\_cod}}+WA{{F}_{plant\_n}}+WA{{F}_{plant\_p}}$
where $WA{{F}_{plant\_cod}}$, $WA{{F}_{plant\_n}}$ and $WA{{F}_{plant\_p}}$ are the footprints of COD, nitrogen and phosphorus, respectively, from crop farming.

2.2.4 The total agricultural footprint

Since the water environment is affected by agricultural waste discharges in a comprehensive way, the total footprint of agriculture is obtained by adding the footprints of COD, nitrogen and phosphorus together. The equation for the total agricultural footprint ($WA{{F}_{agri\_total}}$) was given by:
$WA{{F}_{agri\_total}}=WA{{F}_{agri\_cod}}+WA{{F}_{agri\_n}}+WA{{F}_{agri\_p}}$
where $WA{{F}_{agri\_cod}}$, $WA{{F}_{agri\_n}}$ and $WA{{F}_{agri\_p}}$ are the footprints of COD, nitrogen and phosphorus, respectively, for the combined discharges of each from crop farming, livestock & poultry breeding and aquaculture.
As agricultural pollutants including COD, nitrogen and phosphorus are discharged from crop farming, livestock & poultry breeding and aquaculture, the total footprint of agriculture can also be calculated by the following equation:
$WA{{F}_{agri\_total}}=WA{{F}_{plant}}+WA{{F}_{livestock}}+WA{{F}_{aquaculture}}$
where $WA{{F}_{plant}}$, $WA{{F}_{livestock}}$ and $WA{{F}_{aquaculture}}$ are footprints from crop farming, livestock & poultry breeding and aquaculture, respectively.

3 Results

As can be seen in Table 2, the total agricultural footprint in Huzhou is 23723 ha, with the footprints of COD, nitrogen and phosphorus being 2958 ha, 7722 ha and 13043 ha, respectively. The footprints of crop farming, livestock & poultry breeding and aquaculture are 9566 ha, 1279 ha and 12878 ha, respectively.
Table 2 Footprints of the three different pollutants from the different agricultural sources in Huzhou in 2008 (Unit: ha)
Pollutant Crop farming Livestock and poultry breeding Aquaculture Total
COD 491 348 2119 2958
Nitrogen 4511 285 2926 7722
Phosphorus 4564 646 7833 13043
Total 9566 1279 12878 23723
The components of the footprint of COD from agriculture in Huzhou include 491 ha from crop farming, 348 ha from livestock and poultry breeding, and 2119 ha from aquaculture. The agricultural nitrogen footprint is composed of 4511 ha from crop farming, 285 ha from livestock and poultry breeding and 2926 ha from aquaculture. For the footprint of phosphorus from agriculture, crop farming accounts for 4564 ha, livestock and poultry breeding for 646 ha and aquaculture for 7833 ha.
The footprint from crop farming is 9566 ha, of which the footprints of COD, nitrogen and phosphorus account for 5%, 47% and 48%, respectively. The footprints of COD, nitrogen and phosphorus contribute 27%, 22% and 51%, respectively, to the footprint of livestock and poultry breeding, while they contribute 16%, 23% and 61% to the footprint of aquaculture, respectively.
There is a clear spatial difference when the total agricultural footprint is distributed across the towns and districts. The total agricultural footprints are 8610 ha in Deqing and 6419 ha in Nanxun, together accounting for almost two-thirds of the total agricultural footprint of Huzhou, while they are 3641 ha in Changxing and 3249 ha in Wuxing, followed by 1804 ha in Anji (Table 3). For the footprint from crop farming, the larger components are from Changxing and Nanxun, at 2548 ha and 2205 ha, respectively, while for the footprint from livestock and poultry breeding, Nanxun accounts for 763 ha, or 60% of the total. Regarding the footprint of aquaculture, Deqing and Nanxun together contribute more than 75% of the total amount.
Table 3 Footprints from different agricultural sources distributed among the counties and districts in Huzhou in 2008 (Unit: ha yr-1)
County or district Crop farming Livestock and poultry breeding Aquaculture Total
Anji County 1639 51 113 1804
Changxing County 2548 67 1026 3641
Deqing County 1729 288 6592 8610
Nanxun District 2205 763 3451 6419
Wuxing District 1445 109 1696 3249

4 Discussion

4.1 The contributions of agricultural pollutants to local water pollution

Among the footprints of different pollutants discharged from agriculture in Huzhou, the footprint of phosphorus is the largest (55%), followed by that of nitrogen (33%), and the footprint of COD is the smallest (12%). The footprints of phosphorus and nitrogen together contribute 88% of the total agricultural footprint, while that of COD only accounts for 12%. Therefore, we can see that the city needs more water area to absorb the phosphorus and nitrogen discharged from agriculture than to absorb COD, which indicates that the control of nutrient pollution is a key point in the management of agricultural non-point source pollution.
For the phosphorus footprint of Huzhou, the greatest contributor is aquaculture with a contribution rate of 60%, while the smallest is livestock and poultry breeding which contributes only 5%. The contribution rates of crop farming, livestock & poultry breeding and aquaculture to the nitrogen footprint are 58%, 4% and 38%, respectively. Clearly, crop farming is the greatest source. Analyzing the contributions of agricultural sectors to the COD footprint, we can see that the main one is aquaculture with a contribution rate reaching 72%, while the smallest is livestock and poultry breeding with a contribution rate of 12%. These data show that agricultural pollution management should emphasize different agricultural sectors when different pollutants are considered. For example, to reduce phosphorus pollution, aquaculture should be given more attention as it is the biggest contributor to phosphorus pollution, while in order to control nitrogen pollution, crop farming should be given more consideration. Apparently, the control of aquaculture and crop farming plays an important role in the treatment of the agricultural nutrient pollution.

4.2 Impacts of agricultural activities on local water pollution

Regarding the composition of the total agricultural footprint of Huzhou, the footprint from aquaculture is the largest, followed by that from crop farming, with livestock and poultry breeding being the smallest. Overall, the footprint from aquaculture contributes 54% to the total allotment, while that from livestock and poultry breeding accounts for only 5%. Therefore, considering COD, nitrogen and phosphorus together, it can be inferred that the pollutants discharged from aquaculture and crop farming are more important sources of agricultural pollutants in Huzhou compared with those from livestock and poultry breeding (Table 2). Due to the high proportion (95%) of the footprints from aquaculture and crop farming in the total agricultural footprint, the reduction of pollutants discharged from these two sources will be greatly conducive to the reduction of the total agricultural pollutants.
Analyzing the pollutant composition of the footprint from crop farming, we find that the nitrogen and phosphorus footprints register a very large proportion, together accounting for about 95%. For livestock and poultry breeding, the contribution of phosphorus is the largest, with a contribution of 51%, while the minimum is the WAF of nitrogen (22%). For the footprint from aquaculture, the footprint of phosphorus is the largest (61%), followed by that of nitrogen (23%), and the minimum is the footprint of COD (16%). Therefore, nitrogen and phosphorus are the main components of pollutants discharged from crop farming and aquaculture, and so implementing a pollution control effort for crop farming and aquaculture will play an important role in the reduction of nitrogen and phosphorus.

4.3 Differences in the spatial distribution of agricultural pollution

There are large differences in the total agricultural footprint among the various counties and districts of Huzhou. The total agricultural footprints of Deqing and Nanxun account for 63% of the footprint of Huhou, which demonstrates that Deqing and Nanxun are the key regions for the treatment of agricultural non-point source pollution.
From Table 3, we can see that there is no significant difference in the footprints from crop farming among the different regions of Huzhou. The crop farming footprints of Anji, Changxing, Deqing, Nanxun and Wuxing account for proportions of 17%, 27%, 18%, 23% and 15%, respectively, while the percentages of their output values from crop farming are 27%, 35%, 7%, 15%, and 16%(④ Huzhou statistical yearbook 2009.), respectively. This comparison shows that there is no big discrepancy in the development of crop farming among the counties and districts in Huzhou, so the control of the pollution from crop farming should be implemented all over the city.
The footprints from livestock and poultry breeding in Deqing and Nanxun are relatively larger, accounting for more than 82% of the footprint from livestock and poultry breeding in Huzhou, compared to those in Anji, Changxing and Wuxing. It can be inferred that the areas seriously polluted due to livestock and poultry breeding are mainly located in regions where livestock and poultry breeding is developed, such as Deqing and Nanxun. To control the pollution from livestock and poultry breeding, Deqing and Nanxun should surely be the centers of attention. When it comes to the development of livestock and poultry breeding, these counties should not only pursue the expansion of scale, but they should also pay attention to introducing environmental protection facilities and adopting environmentally friendly measures.
The aquaculture footprints of Deqing and Nanxun are 6592 ha and 3451 ha, respectively, together accounting for 78% of the aquaculture footprint in Huzhou. The output values from aquaculture in Deqing and Nanxun are about 689 million yuan and 816 million yuan, respectively, accounting for 28% and 33% of the total allotment, respectively. So, as above, Deqing and Nanxun deserve more attention due to their large contributions to the aquaculture footprint of Huzhou as well as their high proportions in the output value from aquaculture. When it comes to the management of aquaculture, environmental governance should also be strengthened in the pursuit of economic benefits.

5 Conclusions

The agricultural WAF models provide a method for evaluating the conjoint impact that agricultural non-point sources have had on the local water environment in the Taihu Lake Basin, and the results obtained can provide a basis for the control and management of agricultural non-point source pollution, which is also of great importance in local water environment management. The application of these models demonstrated that the control of nutrient pollution is the key entry point for the reduction of agricultural non-point source pollution, while the control of nutrient pollution from aquaculture and crop farming can play an important role in the treatment of nutrient pollution. There is a regional discrepancy in the spatial distribution of the total agricultural footprints, and Deqing and Nanxun are the key regions for the treatment of agricultural non-point source pollution. In the future, in order to reduce the pollutants discharged from agriculture, ecological agriculture should be developed, which can enable the recycling and re-utilization of the pollutants in the subsystems of agriculture, and also reduce the application of chemical fertilizers and pesticides.
[1]
Duan L, Duan Z Q, Chang J. 2007. Effect of surface management and fertilization mode on nitrogen runoff from upland in Taihu Lake Region. Journal of Agro-Environment Science, 26(3): 813-818. (in Chinese)

[2]
Gao C, Zhu J Y, Zhu J G, et al. 2005. Phosphorus exports via overland runoff under different land uses and their seasonal pattern. Acta Scientiae Circumstantiae, 25(11): 1543-1549. (in Chinese)

[3]
Hu Y, Cheng H F. 2013. Water pollution during China’s industrial transition. Environmental Development, 8(1): 57-73.

DOI

[4]
Huang J C, Zhang Y J, Bing H J, et al. 2021. Characterizing the river water quality in China: Recent progress and on-going challenges. Water Research, 201(4): 117309. DOI: 10.1016/j.watres.2021.117309.

DOI

[5]
Huang Z. 2005. The study of non-irrigated farmland nitrogen and phosphorus loss course and environmental effect in Shanghai. Yunnan Geographic Environment Research, 19(1): 6-10. (in Chinese)

[6]
Huang Z H, Xue B, Pang Y. 2006. Change of water environment and its future in Taihu Lake in relation with ecological development in this lake basin. Resources and Environment in the Yangtze Basin, 15(5): 627-631. (in Chinese)

[7]
Jiao W J, Min Q W, Cheng S K, et al. 2011. Actual nitrogen rate and its multiple effects in rice-wheat rotation system of Taihu Lake Watershed: Empirical analysis based on household survey. Journal of Natural Resources, 26(7): 955-963. (in Chinese)

[8]
Jiao W J, Min Q W, Cheng S K, et al. 2013. The Waste Absorption Footprint (WAF): A methodological note on footprint calculations. Ecological Indicators, 34: 356-360.

DOI

[9]
Jiao W J, Min Q W, Fuller A M, et al. 2014. Evaluating environmental sustainability with the Waste Absorption Footprint (WAF): An application in the Taihu Lake Basin, China. Ecological Indicators, 49: 39-45.

DOI

[10]
Kalamaras S D, Kotsopoulos T A. 2014. Anaerobic co-digestion of cattle manure and alternative crops for the substitution of maize in South Europe. Bioresource Technology, 172: 68-75.

DOI PMID

[11]
Li J, Min Q W, Li W H, et al. 2014a. Agricultural pollution of the river-netted plain areas in the Taihu Lake Basin: A case study of Changzhou and Yixing. Journal of Ecology and Rural Environment, 30(2): 167-173. (in Chinese)

[12]
Li J, Min Q W, Li W H, et al. 2014b. Pollution assessment of rice agriculture in the Taihu Lake Watershed based on the pollution footprint: A case study of Changzhou City and Yixing City, China. Journal of Agricultural Resources and Environment, 31(4): 372-380. (in Chinese)

[13]
Li Z F, Yan G S, Li H P. 2007. Estimation of nutrient export coefficient from different land use types in Xitiaoxi Watershed. Journal of Soil and Water Conservation, 21(1): 1-5. (in Chinese)

[14]
Liu J G, Diamond J. 2005. China’s environment in a globalizing world. Nature, 435(7046): 1179-1186.

DOI

[15]
Ma L, Feng S Y, Reidsma P, et al. 2014. Identifying entry points to improve fertilizer use efficiency in Taihu Basin, China. Land Use Policy, 37: 52-59.

DOI

[16]
Ma T, Zhao N, Ni Y, et al. 2020. China’s improving inland surface water quality since 2003. Science Advances, 6(1): eaau3798. DOI: 10.1126/sciadv.aau3798.

DOI

[17]
Qin B, Xu P, Qu Q, et al. 2007. Environmental issues of Lake Taihu, China. Hydrobiologia, 581: 3-14.

DOI

[18]
Qin B Q, Paerl H W, Brookes J D, et al. 2019. Why Taihu Lake continues to be plagued with cyanobacterial blooms through 10 years (2007-2017) efforts. Science Bulletin, 64(6): 354-356.

DOI

[19]
Reidsma P, Feng S Y, van Loon M, et al. 2012. Integrated assessment of agricultural land use policies on nutrient pollution and sustainable development in Taihu Basin, China. Environmental Science & Policy, 18: 66-76.

[20]
Sun W H, Cheng W, Cui Y X, et al. 2009. Overall treatment of water environment for inflow rivers of Taihu Lake. China Resources Comprehensive Utilization, 27(11): 39-42. (in Chinese)

[21]
Tang Z, Engel B A, Pijanowski B C, et al. 2005. Forecasting land use change and its environmental impact at a watershed scale. Journal of Environmental Management, 76(1): 35-45.

PMID

[22]
Tong Y, Zhang W, Wang X, et al. 2017. Decline in Chinese lake phosphorus concentration accompanied by shift in sources since 2006. Nature Geoscience, 10: 507-511.

DOI

[23]
Wang H X, Xu J L, Liu X J, et al. 2018. Study on the pollution status and control measures for the livestock and poultry breeding industry in northeastern China. Environmental Science and Pollution Research, 25: 4435-4445.

DOI

[24]
Wang J L, Fu Z S, Qiao H X, et al. 2019. Assessment of eutrophication and water quality in the estuarine area of Lake Wuli, Lake Taihu, China. Science of the Total Environment, 650 (Part 1): 1392-1402.

DOI

[25]
Wang L, Cai Y L, Fang L Y. 2009. Pollution in Taihu Lake, China: Causal chain and policy options analyses. Frontiers of Earth Science in China, 3(4): 437-444.

DOI

[26]
Wang R J, Wang Q B, Dong L S, et al. 2021. Cleaner agricultural production in drinking-water source areas for the control of non-point source pollution in China. Journal of Environmental Management, 285(3): 112096. DOI: 10.1016/j.jenvman.2021.112096.

DOI

[27]
Wu T F, Qin B Q, Brookes J D, et al. 2019. Spatial distribution of sediment nitrogen and phosphorus in Lake Taihu from a hydrodynamics-induced transport perspective. Science of the Total Environment, 650(Part 1): 1554-1565.

DOI

[28]
Wu Z S, Wang X L, Chen Y W, et al. 2018. Assessing river water quality using water quality index in Lake Taihu Basin, China. Science of the Total Environment, 612: 914-922.

DOI

[29]
Yan R R, Cheng W, Pang Y, et al. 2009. Study on water quality of Sunan Canal and pollution load of corresponding affecting region. Research of Soil and Water Conservation, 16(5): 135-140. (in Chinese)

[30]
Yang S Q, Liu P W. 2010. Strategy of water pollution prevention in Taihu Lake and its effects analysis. Journal of Great Lakes Research, 36(1): 150-158.

DOI

[31]
Zampella R A, Procopio N A, Lathrop R G, et al. 2007. Relationship of land-use/land-cover patterns and surface-water quality in the Mullica River Basin. Journal of the American Water Resources Association, 43(3): 594-604.

DOI

[32]
Zhang B L, Cui B H, Zhang S M, et al. 2018. Source apportionment of nitrogen and phosphorus from non-point source pollution in Nansi Lake Basin, China. Environmental Science and Pollution Research, 25: 19101-19113.

DOI

[33]
Zhang L M, Xia M F, Zhang L, et al. 2008. Eutrophication status and control strategy of Taihu Lake. Frontiers of Environmental Science & Engineering in China, 2(3): 280-290.

Outlines

/