Ecosystems in Response to Global Change

Preliminary Estimation of Soil Carbon Sequestration of China’s Forests during 1999-2008

  • WANG Bin , 1 ,
  • LIU Moucheng 2 ,
  • ZHOU Zhichun , 1, *
Expand
  • 1. Research Institute of Subtropical Forestry, Chinese Academy of Forestry, Fuyang, Zhejiang 311400, China
  • 2. Institute of Geographic Sciences and Natural Resources Research, Chinese Academy of Sciences, Beijing 100101, China
* ZHOU Zhichun, E-mail:

WANG Bin, E-mail:

Received date: 2021-07-28

  Accepted date: 2021-10-16

  Online published: 2022-01-08

Supported by

The Fundamental Research Funds of Chinese Academy of Forestry(CAFYBB2020SY015)

Abstract

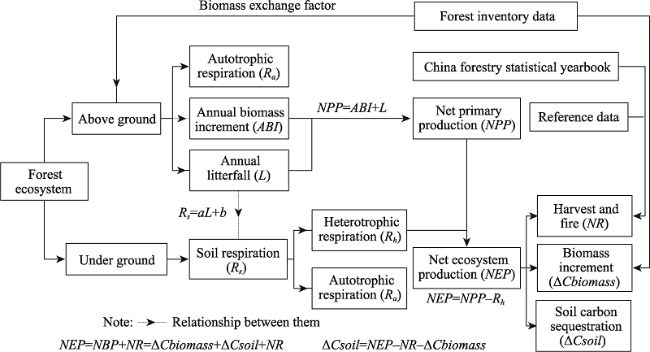
The National Forest Inventory (NFI) is an important resource for estimating the national carbon balance (These data were unpublished data, and we could only obtain the data before 2008 through data search by now). Based on the data from sample plots, the literature, and NFI, as well as the relationships between volume, biomass, annual litterfall and soil respiration of different forest types, the net ecosystem production (NEP), changes in forest biomass carbon storage (△Cbiomass) and non-respiratory losses (NR) of China’s forests during 1999-2008 were estimated, and the forest soil carbon sequestration (△Csoil) was assessed according to the carbon balance principle of the forest ecosystem (△Csoil = NEP - NR - Cbiomass). The results showed that the total NEP, Cbiomass, NR and △Csoil values for China’s forests were 157.530, 48.704, 31.033 and 77.793 Tg C yr-1 respectively, and average NEP, △Cbiomass, NR, and △Csoil values were 101.247, 31.303, 19.945 and 49.999 g C m-2 yr-1 respectively. There were large spatial differences in forest soil carbon sequestration in different parts of China. The forest soil in Jiangxi, Hunan, Zhejiang, Fujian, Anhui, Shanxi, Shaanxi, Guangxi and Liaoning served as carbon sources and the carbon released was about 25.507 Tg C yr-1. The other 22 provinces served as carbon sinks and the average carbon sequestration by forest soil came to 103.300 Tg C yr-1. This research established a method for evaluating soil carbon sequestration by China’s forests based on the NFI, which is a useful supplement to current statistical data-based studies on the forest ecosystem carbon cycle, and can promote comparable studies on forest soil carbon sequestration with consistent research methods at the regional scale.

Cite this article

WANG Bin , LIU Moucheng , ZHOU Zhichun . Preliminary Estimation of Soil Carbon Sequestration of China’s Forests during 1999-2008[J]. Journal of Resources and Ecology, 2022 , 13(1) : 17 -26 . DOI: 10.5814/j.issn.1674-764x.2022.01.002

1 Introduction

The carbon stored in soil organic matter represents the long-term net balance of photosynthesis and total respiration in terrestrial ecosystems (Schlesinger, 1990). Concerns about rising atmospheric CO2 levels have prompted considerable interest in recent years regarding the sink potential of soil organic carbon (Baker et al., 2007; Bazrgar et al., 2020). Soil carbon sequestration is of great significance for the mitigation of global warming (Vermeulen et al., 2019). Compared with the carbon stored in vegetation, carbon stored in soil is more stable. Therefore, it would be permanently sequestered in the soil and form a stable organic carbon pool if there are no major geological disruptions. Moreover, studies have found that mature forests can continuously accumulate organic carbon (Zhou et al., 2006; Luyssaert et al., 2008). As trees become more mature, the soil still accumulates organic carbon even when the organic carbon accumulation by vegetation has decreased. These studies indicated that forest soil should be a focus of attention so as to give full play to its role in reducing global warming.
The terrestrial ecosystem is a vast and complex system with dynamic changes which determine the complexity and uncertainty of the terrestrial carbon source/sequestration issues. The accurate estimation of forest soil carbon sequestration is not only the important basis for studying global change and the soil carbon cycle, but also provides the essential foundation for developing effective measures to increase soil carbon storage, reduce CO2 emissions and restrain global warming (Lal, 2005; McCarl et al., 2007; Ghasemi, 2018). Due to an insufficient understanding of the soil system key carbon process and its changes in stability, great uncertainty remains in the current evaluation results on forest soil carbon sequestration. Many studies have been carried out on the regional or global forest carbon cycles (Dixon et al., 1994; Schimel, 1995; Janssens et al., 2003; Wang et al., 2007), but they still have some problems with the estimation of forest soil carbon sequestration. Because of the differences in methods, time and spatial scales (Dunne et al., 2004; Zhao et al., 2006; Wang et al., 2020), the results are difficult to compare. So, there is an urgent need to reinforce the studies on soil carbon sequestration on a large scale based on comparable and consistent methods.
In order to evalute the forest’s role in the global carbon cycle, the use of forest inventory data at the national or regional scale to study the forest carbon dynamics has increasingly become a focus of attention (Liu et al., 2000; Zeng et al., 2018). Based on the National Forest Inventory (NFI), Fang et al. (2001a) made a scientific evaluation of China’s vegetation carbon sequestration for the first time. On this basis, further systematic studies on forest soil carbon sequestration can promote more accurate estimations for the carbon sequestration of China’s forests. Based on the data from sample plots, the literature, and NFI, as well as functional relations between volumes, biomass, annual litterfall and soil respiration of different forest types, this study had two main objectives: 1) To put forward an evaluation method for forest soil carbon sequestration; 2) To evaluate the soil carbon sequestration of China’s forests based on the carbon balance principle.

2 Materials and methods

2.1 Study site

China has a total area of 9.6×10⁶ km2 and is located primarily in temperate and subtropical climates. The forests of China can be classified into following eight types: Cold temperate coniferous forest; temperate mixed coniferous-broadleaf forest; warm temperate deciduous broadleaf forest; subtropical evergreen broadleaf forest; tropical rain forest and monsoon forest; temperate grassland region; temperate desert region and Tibetan Plateau alpine-cold vegetation region. According to the 2004-2008 7th NFI of China, the total forest area was 1.95×10⁸ ha (including the shrub land prescribed specifically by the government), and the forest coverage was 20.36%. The area of plantation forest was 6.2×10⁷ ha, which ranked first in the world.

2.2 Data

The data include two sources. 1) The 1999-2003 6th and 2004-2008 7th NFI data(① Forest Resource Management Department of State Administration of Forestry. Forest resources statistics of China (1999-2008). (in Chinese) ) which record the area, age group and volume information for different forest types in different provinces or regions in China (The NFI data from the Forest Resource Management Department of State Administration of Forestry were unpublished data, and we can only obtain the NFI data before 2008 through data search by now). 2) Data from the Chinese Forestry Statistical Yearbook during 2004-2008 includes the harvest and fire information of different provinces or regions in China in different periods (State Administration of Forestry).
The NFI of China, which excludes Hong Kong, Macao and Taiwan, is designed to monitor the macro-changes of forest resources at the national and provincial levels on a continuing basis (every 5 years) in terms of forest quantity, quality and functions. In its classification system, forest is defined as an area with canopy density greater than or equal to 0.20 and forest vegetation at the soil surface, including forest stands, economic forest, bamboo forest and the shrub land prescribed specifically by the government. Measures include forest area, volume and five age classes (young, middle-mature, approximately mature, mature, over-mature) for each forest type and can be used as an important data source for estimating forest NPP and carbon balance at the landscape and regional scales (Zhou et al., 2002; Zhao and Zhou, 2005; Zhang, 2006). In this study, we considered only stand areas, which make up about 85.78% of the total forest area according to the 7th NFI.

2.3 Methods

2.3.1 Technical route

According to the carbon balance principle of forest ecosystems (Yu, 2003): NBP = NEP - NR = Cbiomass +Csoil, in which NEP represents the net gain or loss of carbon from an ecosystem and is equal to the net primary production (NPP) minus the carbon lost through heterotrophic respiration (Rh); NR represents the non-respiratory metabolic consumption of photosynthesis production; NBP represents the net gain or loss of vegetation and soil carbon from a region and is equal to the NEP minus the carbon loss due to NR; △Cbiomass represents the increment of existing forest vegetation biomass which can be calculated according to NFI (Fang et al., 2001b); △Csoil represents soil carbon sequestration, and if the values of △Cbiomass and NR are less than NEP, the soil is a carbon sink, otherwise it is a carbon source. Therefore, in the event that the soil carbon sequestration of China’s forest is difficult to estimate directly, an indirect estimation may be considered according to the carbon balance principle based on the correct estimations of NEP, △Cbiomass and NR (△Csoil = NEP - NR - Cbiomass) (Fig. 1).
Fig. 1 Technical route for the estimation of soil carbon sequestration by China’s forests

2.3.2 Net primary production and net ecosystem production estimations

Based on 1285 allometric equations for 98 major forest types and tree species in China, 4622 routine inventory plots and 793 additional reference plots that represent a wide range of China’s forest types and plot conditions, in his dissertation, Luo (1996) calculated the biomass and NPP of tree stems, branches, leaves, and roots of each plot by using the available information about stand diameter at breast height and tree height. By calculating the average values of different sample plots in the same forest region, Luo obtained 1266 sample plots and used them to assess the distribution patterns of NPP for China’s major forest types.
On the basis of Luo’s work, we established the relationships between the volume, biomass, annual biomass increment (ABI) and annual litterfall for different forest types and estimated the NPP and NEP of China’s forests. Those relationships can be expressed by eqs (1)-(3). Here NPP was estimated by summing annual biomass increment and annual litterfall. More detailed derivation processes and calculation methods were described elsewhere (Wang et al., 2010).
$B=\frac{V}{a+bV}$
where B is stand biomass (106 g ha-1), including above ground tree biomass and the below ground root system; V is stand volume (m3 ha-1); and a and b are constants for a specific forest type which are obtained by regression analysis (as are c, d, e and f, below).
$ABI=\frac{B}{cA+dB}$
where ABI is the annual biomass increment and its unit is 106 g ha-1 yr-1; A and B are stand age and stand biomass (106 g ha-1); and c and d are constants for a specific forest type.
$L=\frac{1}{e/B+f}$
where L is the annual litterfall (106 g ha-1 yr-1); B is the biomass (106 g ha-1); and e and f are constants for a specific forest type. Based on the data collected by Luo (1996), a, b, c, d, e and f in eqs (1)-(3) can be determined (Table 1).
Table 1 Relationships between volume, biomass, annual biomass increment (ABI) and annual litterfall.
Forest types N Biomass rBiomass ABI rABI n Annual litterfall rAL
Cupressus funebris, Keteleeria fortunei 10 B=V/(1.0202+0.0022V) 0.9605a P=B/(0.1132A+0.0745B) 0.9018a 10 L=B/(9.8381+0.1337B) 0.7508b
Larix 39 B=V/(1.1111+0.0016V) 0.9571a P=B/(0.1885A +0.0728B) 0.7980a 39 L=B/(16.734+0.0577B) 0.9267a
Pinus armandii, Pinus densata and other mountain pines 43 B=V/(1.2390+0.0013V) 0.9546a P=B/(0.3840A +0.0104B) 0.9475a 43 L=B/(7.5272+0.1102B) 0.7469a
Pinus massoniana 46 B=V/(1.4254+0.0004V) 0.9587a P=B/(0.4046A +0.0098B) 0.9674a 46 L=B/(15.451+0.0225B) 0.9319a
Pinus yunnanensis, Pinus khasya 41 B=V/(1.3624-0.0003V) 0.9951a P=B/(0.2423A +0.0581B) 0.9475a 41 L=B/(18.905+0.0422B) 0.9847a
Pinus tabulaeformis, Platycladus orientalis 147 B=V/(1.0529+0.0020V) 0.9679a P=B/(0.3520A+0.0161B) 0.9760a 147 L=B/(11.177+0.1501B) 0.8689a
Pinus sylvestris var. mongolica 7 B=V/(1.2544+0.0030V) 0.9129b P=B/(0.1405A+0.1203B) 0.9740a 7 L=4.20±0.3538
Cunninghamia lanceolata 70 B=V/(1.2917+0.0022V) 0.9541a P=B/(0.4598A+0.0069B) 0.9691a 48 L=B/(10.132+0.0874B) 0.7783a
22 L=B/(8.7239+0.0418B)d 0.9618a
Picea, Abies, Tsuga 154 B=V/(1.3667+0.0012V) 0.9228a P=B/(0.2267A+0.0526B) 0.8482a 35 L=B/(27.204+0.0812B) 0.9580a
119 L=3.34±0.9277 e
Temperate mixed
coniferous-broadleaf forest
13 B=V/(1.1731+0.0018V) 0.9686a P=B/(0.1038A+0.0761B) 0.9087a 13 L=3.46±0.9597
Temperate typical deciduous broadleaf forest 59 B=V/(0.6539+0.0038V) 0.9335a P=B/(0.2393A+0.0495B) 0.9565a 59 L=B/(18.246+0.0366B) 0.8627a
Subtropical evergreen broadleaf forest 222 B=V/(0.7883+0.0026V) 0.8567a P=B/(0.2503A+0.0226B) 0.8885a 222 L=B/(20.507+0.0383B) 0.9104a
Subtropical mixed
evergreen-deciduous broadleaf forest
13 B=V/(0.5788+0.0020V) 0.9201a P=B/(0.3018A+0.0331B) 0.8219a 13 L=B/(9.1028+0.0575B) 0.8746a
Sclerophyllous evergreen Quercus forest 8 B=V/(0.7823+0.0014V) 0.9111b P=B/(0.2989A+0.0117B) 0.9469a 8 L=B/(34.845+0.0283B) 0.9003b
Betula and Populus 119 B=V/(0.8115+0.0019V) 0.9501a P=B/(0.3080A+0.0138B) 0.9429a 119 L=B/(16.722+0.0324B) 0.9236a
Tropical rain forest and monsoon forest 8 B=V/(0.6809+0.0006V) 0.9972a P=B/(0.1797A+0.0344B) 0.6499c 8 L=B/(8.0976+0.0540B) 0.8118b

Note: A=Stand age; B=Stand biomass; V=Stand volume; P=Annual biomass increment; L=Annual litterfall. a means P<0.001; b means P<0.05; c means P<0.1; d only used in Guizhou Province; e only used in southwest China (Wang et al., 2010). N=Samples of each forest types for Biomass and ABI; n=Samples of each forest types for annual litterfall; rBiomass=Correlation coefficient of volume and biomass; rABI=Correlation coefficient of annual biomass increment (P) and biomass; rAL=Correlation coefficient of annual litterfall and biomass.

We used the annual litterfall to estimate the soil respiration of different forest types in China. According to previous studies (Davidson et al., 2002; Bond-Lamberty et al., 2004), the relationships between annual litterfall, soil respiration (Rs) and heterotrophic respiration (Rh) can be expressed by eqs (4)-(6). By using those relationships, we can estimate the NEP (NEP= NPP - Rh) of China’s forests in different provinces or regions based on the 7th NFI data.
Mature forest (45 years of age):
${{R}_{s}}=287+2.80\times L$ (R2=0.62, P <0.01)
Young forest (<45 years of age):
${{R}_{s}}=139+4.16\times L$ (R2=0.81, P <0.01)
Relationship between Rh and Rs:
$\ln \left( {{R}_{h}} \right)=1.22+0.73\ln \left( {{R}_{s}} \right)$(R2=0.81, P<0.001)
where Rs is soil respiration (g C m-2 yr-1); Rh is heterotrophic respiration (g C m-2 yr-1); and L is annual litterfall (g C m-2 yr-1).

2.3.3 Non-respiratory metabolic consumption (NR) estimation

NR mainly refers to carbon losses caused by natural and human disturbances, such as harvest, fire, animal foraging, plant diseases and insect pests, forest products, etc. (Fang et al., 2001b). Forest products are mainly havested in economic forests (which do not belong to the category of “forest stands”) and they are not considered here. Carbon losses caused by animal foraging, plant diseases and insect pests are comparatively small and difficult to estimate, so only carbon losses caused by harvest and fire were considered here.
Carbon losses caused by forest harvest can be estimated based on the ratio of unit area biomass and volume (B/V) and the annual average harvests. The B/V of different provinces or regions can be calculated based on the 7th NFI and the annual average harvests can be obtained from the China Forestry Statistical Yearbook during 2004-2008. Carbon losses caused by forest fires can be calculated based on the forest carbon density, fire combustion efficiency and forest fire areas of different provinces or regions. Wang et al. (1998, 2001) once conducted a systematic study on carbon emissions from forest fires in China, and this paper used Wang’s conclusion to calculate the carbon released from forest fires in different provinces or regions in China.

2.3.4 Biomass increment (△Cbiomass) estimation

Many studies have shown that relationships exist between volume, biomass and NPP (Fang et al., 1996; Zhou et al., 2002; Zhao and Zhou, 2005), and between litterfall and biomass (Wang, 1999). Using the volume-to-biomass methods (eq. (1)), forest inventory data, and the parameters listed in Table 1, forest biomass was calculated for each forest type in the different provinces or regions and the annual biomass increment was estimated based on the 6th and 7th NFI.
$\Delta Cbiomass=\sum\limits_{i=1}^{31}{(C{{D}_{7i}}\times {{A}_{7i}}-C{{D}_{6i}}\times {{A}_{6i}})/5}$
where △Cbiomass is the increment of existing forest vegetation biomass; CD7i is the carbon density of each province during the 7th NFI (i=1, 2, …, 31); A7i is the forest area of each province during the 7th NFI; CD6i is the carbon density of each province during the 6th NFI; and A6i is the forest area of each province during the 6th NFI.

3 Results

3.1 Biomass increments and non-respiratory carbon losses of different provinces or regions

The total biomass increment of China’s forests was 48.704×10¹² g C yr-1 (Table 2). Heilongjiang had the highest increment of about 11.138×10¹² g C yr-1, representing 22.87% of the total increment. The average biomass increments (carbon density changes) of different provinces or regions varied from -196.306 to 118.996 g C m-2 yr-1. Shanghai had the lowest increment, while Guangxi, Fujian, Zhejiang and Jiangxi were comparatively higher. The biomass increments of Tibet, Yunnan, Sichuan, Hebei, Jiangsu, Beijing, Xinjiang and Shanghai were negative with a carbon storage decrease of 11.020×10¹² g C yr-1 because of the forest carbon density decreases during the 6th and 7th NFI. On the whole, the area of China’s forests (forest stands) increased from 142.787×10⁶ ha in the 6th NFI to 155.590×10⁶ ha in the 7th NFI for an annual increase of 1.793%; and the corresponding vegetation biomass increased from 5058.266×1012 g C to 5648.032×1012 g C, for an annual increase of 2.332%. The rate of increase for vegetation biomass was higher than that for forest area, which indicated that the quality of China’s forests was being gradually improved with the implementation of a series of ecological environmental protection measures.
Table 2 Biomass increments and non-respiratory carbon losses of different provinces or regions in China
Province Area (106 ha) Carbon density
(106 g C ha-1 yr-1)
Biomass/ volume
(106 g m-3)
Harvest
volume
(106 m3 yr-1)
Emission
by firea
(106 g C ha-1)
Fire area
(103 ha yr-1)
Total (1012 g C yr-1)
6th NFI 7th NFI 6th NFI 7th NFI Change Cbiomass Harvest Fire
Anhui 2.455 2.708 18.245 21.918 0.735 0.863 3.640 3.190 0.649 1.990 1.571 0.002
Beijing 0.234 0.356 19.378 16.313 -0.613 1.117 0.053 5.650 0.022 -0.218 0.030 0.000
Chongqing 1.532 1.820 21.959 23.220 0.252 0.746 0.102 13.420 0.242 0.459 0.038 0.003
Fujian 5.639 5.661 30.470 36.314 1.169 0.849 6.661 5.140 5.684 6.617 2.827 0.029
Gansu 1.921 2.134 39.801 40.250 0.090 0.887 0.047 13.550 0.004 0.192 0.021 0.000
Guangdong 6.606 6.788 19.529 20.017 0.097 0.900 4.108 2.350 1.584 0.662 1.849 0.004
Guangxi 7.475 8.067 20.893 26.843 1.190 0.924 7.072 3.290 2.501 9.599 3.267 0.008
Guizhou 3.443 3.981 21.609 24.949 0.668 0.827 1.070 7.680 2.431 2.659 0.443 0.019
Hainan 0.892 0.842 46.218 49.002 0.557 1.134 0.754 11.410 0.228 0.469 0.428 0.003
Hebei 2.065 2.882 16.671 16.247 -0.085 1.118 0.523 6.900 0.178 -0.244 0.292 0.001
Henan 1.977 2.834 24.415 25.555 0.228 1.120 1.123 6.330 0.553 0.646 0.628 0.003
Heilongjiang 17.922 19.126 37.906 40.818 0.582 1.027 7.057 13.930 84.107 11.138 3.622 1.172
Hubei 4.160 5.078 17.083 18.526 0.288 0.898 1.783 2.540 1.399 1.465 0.801 0.004
Hunan 6.091 7.265 17.208 19.157 0.390 0.797 6.242 2.790 11.912 2.833 2.489 0.033
Jilin 7.116 7.267 53.761 55.640 0.376 0.958 4.213 18.580 0.110 2.732 2.018 0.002
Jiangsu 0.444 0.744 25.416 23.909 -0.301 1.017 0.764 2.490 0.118 -0.224 0.388 0.000
Jiangxi 7.278 7.681 17.864 23.331 1.094 0.907 5.094 2.890 5.480 8.400 2.310 0.016
Liaoning 3.226 3.613 28.322 30.026 0.341 1.073 1.782 8.030 0.201 1.232 0.956 0.002
Inner
Mongolia
16.082 16.813 32.173 32.734 0.112 0.935 4.103 11.060 14.765 1.884 1.918 0.163
Ningxia 0.092 0.111 21.664 22.831 0.233 1.029 0.002 10.260 0.002 0.026 0.001 0.000
Qinghai 0.342 0.355 40.628 42.473 0.369 0.770 0.019 16.550 0.073 0.131 0.007 0.001
Shandong 0.830 1.561 20.544 22.208 0.333 1.094 1.179 2.780 0.090 0.520 0.645 0.000
Shanxi 1.605 1.724 19.415 23.690 0.855 1.069 0.072 7.740 0.898 1.474 0.039 0.007
Shaanxi 5.086 5.670 30.513 30.607 0.019 1.026 0.293 11.080 0.132 0.107 0.150 0.001
Shanghai 0.006 0.034 22.009 12.193 -1.963 0.821 0.003 0.000 0.000 -0.067 0.001 0.000
Sichuan 11.036 11.653 47.540 46.563 -0.195 0.680 1.248 13.420 0.752 -2.276 0.424 0.010
Tianjing 0.046 0.055 17.579 20.040 0.492 1.100 0.019 4.150 0.008 0.027 0.011 0.000
Tibet 8.445 8.411 93.150 90.451 -0.540 0.678 0.205 17.300 0.062 -4.541 0.069 0.001
Xinjiang 1.562 1.692 61.874 61.526 -0.070 0.692 0.408 16.010 0.089 -0.118 0.141 0.001
Yunnan 13.566 14.727 42.958 41.827 -0.226 0.793 3.208 14.820 1.841 -3.332 1.272 0.027
Zhejiang 3.615 3.936 12.387 18.060 1.135 0.825 2.062 2.330 5.092 4.466 0.851 0.012
Total/Average 142.787 155.59 35.425 36.301 0.175 0.845 64.909 8.312 141.204 48.704 29.507 1.526

Note: NFI=National forest inventory; △Cbiomass=Change in forest biomass carbon storage. a Carbon emissions per forest area from fires by each province (Wang et al., 2001). The data in the Table exclude Taiwan, Hong Kong and Macau of China.

The total carbon loss of China’s forests caused by non- respiratory metabolic consumption was 31.033×10¹² g C yr-1 during 2004-2008. Carbon losses caused by harvest and fire were 29.507×10¹² g C yr-1 and 1.526×10¹² g C yr-1, respectively (Table 2). The carbon loss by fire was far less than that by harvest. Heilongjiang had the largest forest harvest and fire area, and the carbon losses caused by harvest and fire were 3.622×10¹² g C yr-1 and 1.172×10¹² g C yr-1, representing 12.276% and 76.787% of the total losses, respectively. The average carbon losses of different provinces or regions varied from 0.837 to 58.071 g C m-2 yr-1. Anhui suffered the greatest average carbon losses, which may be mainly attributable to its relatively lower forest area and higher annual average harvest.

3.2 Net ecosystem production and soil carbon sequestration of different provinces or regions

The total NPP of China’s forests was 739.213×10¹² g C yr-1 and Rh was 581.683×10¹² g C yr-1, so the total NEP can be calculated as 157.530×10¹² g C yr-1 and average NEP as 101.247 g C m-2 yr-1 (Table 3). Yunnan had the highest NEP of about 27.796×10¹² g C yr-1, representing 17.645% of the total NEP. The average NEP of different provinces or regions varied from -8.113 to 300.362 g C m-2 yr-1, and those of Hainan, Shandong and Guangdong were comparatively higher, while the NEP of Shaanxi was negative. Since the project of converting cropland to forest and grassland was launched in China in 1999, Shaanxi was the first province to carry out this project and the forest coverage rate increased significantly, with an average annual growth rate of 1%. Because the increasing forest areas are usually young forests with small NPP but large Rs, the NEP of Shaanxi was low with a carbon emission of 0.460×10¹² g C yr-1, or about 8.113 g C m-2 yr-1.
Table 3 Net ecosystem production and soil carbon sequestration of different provinces or regions in China
Province Area (106 ha) Total (1012 g C yr-1) Average (g C m-2 yr-1)
7th NFI NPP Rh NEP NR NBP Cbiomas Csoil NEP NR NBP Csoil
Anhui 2.708 10.256 8.806 1.450 1.573 -0.123 1.990 -2.113 53.533 58.071 -4.538 -78.005
Beijing 0.356 0.966 0.878 0.088 0.030 0.058 -0.218 0.276 24.680 8.407 16.273 77.573
Chongqing 1.820 6.572 5.905 0.667 0.041 0.626 0.459 0.167 36.628 2.260 34.368 9.156
Fujian 5.661 29.020 22.789 6.232 2.856 3.376 6.617 -3.241 110.090 50.456 59.634 -57.262
Gansu 2.134 9.330 8.072 1.259 0.021 1.237 0.192 1.046 58.968 0.990 57.978 48.993
Guangdong 6.788 36.642 21.679 14.963 1.853 13.111 0.662 12.449 220.447 27.298 193.149 183.402
Guangxi 8.067 41.723 29.478 12.244 3.275 8.970 9.599 -0.629 151.791 40.598 111.193 -7.803
Guizhou 3.981 17.276 13.728 3.548 0.461 3.087 2.659 0.428 89.138 11.587 77.552 10.758
Hainan 0.842 6.694 4.166 2.528 0.430 2.098 0.469 1.629 300.362 51.121 249.241 193.559
Hebei 2.882 7.979 7.193 0.787 0.294 0.493 -0.244 0.737 27.292 10.189 17.103 25.582
Henan 2.834 13.099 9.175 3.924 0.632 3.292 0.646 2.646 138.482 22.299 116.182 93.391
Heilongjiang 19.126 101.792 80.709 21.083 4.794 16.290 11.138 5.151 110.233 25.064 85.169 26.934
Hubei 5.078 21.931 15.700 6.230 0.804 5.426 1.465 3.962 122.699 15.838 106.861 78.017
Hunan 7.265 22.875 22.680 0.196 2.522 -2.326 2.833 -5.159 2.693 34.713 -32.020 -71.009
Jilin 7.267 44.561 35.295 9.266 2.020 7.246 2.732 4.514 127.504 27.800 99.704 62.117
Jiangsu 0.744 3.817 2.376 1.441 0.389 1.052 -0.224 1.277 193.567 52.220 141.346 171.493
Jiangxi 7.681 28.871 25.800 3.071 2.325 0.746 8.400 -7.654 39.983 30.273 9.710 -99.642
Liaoning 3.613 14.450 12.568 1.882 0.958 0.924 1.232 -0.307 52.074 26.501 25.573 -8.510
Inner
Mongolia
16.813 69.169 59.223 9.946 2.081 7.864 1.884 5.981 59.157 12.380 46.777 35.573
Ningxia 0.111 0.430 0.322 0.108 0.001 0.107 0.026 0.081 97.600 0.965 96.635 73.286
Qinghai 0.355 1.645 1.321 0.324 0.009 0.315 0.131 0.184 91.209 2.430 88.779 51.881
Shandong 1.561 8.380 4.736 3.644 0.645 2.998 0.520 2.479 233.383 41.340 192.043 158.760
Shanxi 1.724 5.293 5.168 0.126 0.046 0.080 1.474 -1.394 7.283 2.648 4.634 -80.870
Shaanxi 5.670 18.534 18.994 -0.460 0.152 -0.612 0.107 -0.719 -8.113 2.677 -10.790 -12.672
Shanghai 0.034 0.097 0.084 0.013 0.001 0.012 -0.067 0.079 39.426 3.044 36.382 232.689
Sichuan 11.653 53.595 44.134 9.461 0.434 9.027 -2.276 11.303 81.193 3.728 77.465 96.999
Tianjing 0.055 0.256 0.152 0.104 0.011 0.094 0.027 0.067 191.215 19.566 171.650 122.423
Tibet 8.411 56.276 43.329 12.947 0.070 12.877 -4.541 17.417 153.925 0.837 153.088 207.069
Xinjiang 1.692 8.739 7.117 1.622 0.143 1.480 -0.118 1.597 95.851 8.429 87.422 94.380
Yunnan 14.727 85.799 58.003 27.796 1.299 26.497 -3.332 29.829 188.741 8.820 179.921 202.547
Zhejiang 3.936 13.144 12.104 1.039 0.863 0.177 4.466 -4.290 26.408 21.924 4.484 -108.988
Total/Average 155.590 739.213 581.683 157.530 31.033 126.497 48.704 77.793 101.247 19.945 81.301 49.999

Note: NFI=National forest inventory; NPP=Net primary production; Rh=Heterotrophic respiration; NEP=Net ecosystem production; NR=Non-respiratory carbon losses; NBP=Net biome production; △Cbiomass=Changes in forest biomass carbon storage; △Csoil=Forest soil carbon sequestration. The data here exclude Taiwan, Hong Kong and Macau of China.

According to the forest carbon balance principle, China’s forest soil carbon sequestration was calculated as 77.793×10¹² g C yr-1, or about 49.38% of the total NEP. Average soil carbon sequestration was 49.999 g C m-2 yr-1. The forest soils of Yunnan and Tibet had high soil carbon sequestration rates of about 29.829×10¹² and 17.417×10¹² g C yr-1, respectively. The forest soils of Jiangxi, Hunan, Zhejiang, Fujian, Anhui, Shanxi, Shaanxi, Guangxi and Liaoning were carbon sources with a total carbon emission about 25.507×10¹² g C yr-1. The average soil carbon sequestration rates of different provinces or regions varied from -108.988 to 232.689 g C m-2 yr-1, and those of Shanghai, Tibet and Yunnan were comparatively higher (Table 3). Because of the unique tree species composition, rich vegetation types, special distribution area and rare biological productivity, Yunnan and Tibet’s forests played a significant carbon sequestration role in China.

4 Discussion

4.1 Biomass increment, net ecosystem production and carbon losses of China’s forests

Many studies have been carried out to estimate the vegetation carbon sequestration of China’s forests based on the NFI and the volume-to-biomass methods (Fang et al., 2001a; Pan et al., 2004). However, because the methods used to establish the relationship between volume and biomass were different among the studies, the results had some differences. By using linear regression equations, the biomass increment of China’s forests was estimated to be 75.2×10¹² g C yr-1 during 1977-2003 (Fang et al., 2007). In our study, the biomass increment was about 48.704×10¹² g C yr-1 during 2004-2008. The method used by Fang was based on linear regression equations, but we used hyperbolic equations. This was the significant difference between our study and Fang’s study. Because the relationship between volume and biomass changes with differences in the forest age, site conditions, forest stand density, and forest stand conditions (Schroeder et al., 1997; Xu et al., 2007), it was difficult to derive the equations that would accurately reflect the relationships between volume and biomass.
The key problem in NEP estimation is to calculate soil respiration. So far, there is no good way to estimate soil respiration at a regional level. Raich and Nadelhoffer (1989) suggested that total belowground carbon allocation (TBCA) could be estimated from the difference between annual rates of soil respiration and aboveground litterfall, and Davidson’s research generally agrees with previous work (Davidson et al., 2002). In addition, a global relationship between the heterotrophic and autotrophic components of soil respiration was established by Bond-Lamberty (2004). The above relationships provided a useful method that can help constrain estimates of terrestrial carbon budgets, but only a small number of samples for each of forest type were used and the differences between different forest types were not considered in their study, which could lead to suspect results. Chen et al. (2008) analyzed the regional patterns of soil respiration in China’s forests, and the R2 value of relationship between litterfall and Rs is 0.299, significantly lower than that obtained with Eq. (4)-(5). These results suggest that predicting TBCA from litterfall data may be acceptable for global scale modeling and for obtaining rough estimates, but may not always provide reliable estimates at the small scale (Gower et al., 1996). This is a flaw. In the future, we need to strengthen the studies of TBCA, heterotrophic and autotrophic respiration for different forest types in China in order to improve the precision of forest sequestration evaluation.
The carbon emission from China’s forest fires was estimated to be 10.19×10¹² g C yr-1 (about 1077 g C m-2 yr-1) from 1959 to 1992 based on the fire-affected forest area (Wang et al., 2001). Another study estimated that the carbon emission was 20.24×10¹²-28.56×10¹² g C yr-1 (about 8560-12079 g C m-2 yr-1) from 1991 to 2000 based on the fire-burned forest area (Tian et al., 2003). The “burned area” was considered as the forest fire area regardless of whether trees were burned to death or harmed by the fire; while the “affected area” includes only the area in which the trees are burned to death. Because the evaluation methods and parameters were different and the burned area actually includes the affected area, Tian’s estimate was far higher than Wang’s. Based on Wang’s research, we estimated that the carbon emission by fire was about 1.526×10¹² g C yr-1 (about 1080 g C m-2 yr-1). As the evaluation parameters were the same as those used by Wang, the main reasons for the obvious decrease of carbon emissions during the 7th NFI should be related to the continuous improvement of China’s forest fire prevention level, which has led to a gradual decrease in the forest fire area in recent years.

4.2 Soil carbon sequestration by China’s forests

The main challenges to understanding carbon dynamics in forest soils lie in the long duration of the growth cycle in forests (Hart and Solins, 1998). Many studies on large-scale forest carbon balance often used a method based on a simple hypothesis, assuming that soil carbon sequestration and vegetation carbon sequestration have a fixed ratio (Kauppi et al., 1992) or remain unchanged (Turner et al., 1995). However, as soil carbon is a part of the forest ecosystem carbon cycle and associated with vegetation succession, and is influenced by past events at the same time, these hypotheses can only produce a preliminary approximation (Liski et al., 2002). Gradually, modeling methods were used in the studies of large-scale soil carbon sequestration. The land-based and atmosphere-based methods were two main methods for studying the soil carbon sequestration. While the first method can provide information on which ecosystems and regions are accumulating carbon and which are losing carbon to the atmosphere, the second method can provide aggregated information on the regional-scale carbon balance on a monthly time scale but it cannot give any information about which ecosystems are contributing to the sink or the processes involved (Janssens et al., 2003).
Based on land-based approaches incorporating direct inventories of carbon on the ground, reconstructions of land use change, and ecosystem models, Pacala et al. (2001) estimated the soil carbon sequestration of U.S.’s forests to be 12.15-60.73 g C m-2 yr-1. According to the national inventories of annual stem-volume increments and harvests, Janssens et al. (2003) estimated the soil carbon sequestration of Europe’s forests to be 21 g C m-2 yr-1. In addition, based on an empirical regression method for scaling-up soil carbon inventory data, Piao et al. (2009) estimated the spatio-temporal patterns of soil carbon changes and found a small soil carbon sequestration of China’s forests to be 3.08±3.15 g C m-2 yr-1 during 1982-1999, among which the evergreen forests of southern China were a carbon sink (16.92±6.15 g C m-2 yr-1), while the northern deciduous forests were a carbon source (13.85±3.08 g C m-2 yr-1) because of a stronger warming trend and net deforestation during the 1980s and 1990s. By using a chronology sequence method, Schlesinger (1990) estimated that global soil carbon accumulation of 0.4 Pg C yr-1 occurs mainly in forest soils and the long-term rate of carbon storage varies from 0.2 g C m-2 yr-1 in some polar deserts to 12.0 g C m-2 yr-1 in some forests in upland ecosystems. Because the accumulation rates in Schlesinger’s study do not include the accumulation of undecomposed organic matter on the soil surface, the results should be a little lower than other results.
In this study, the soil carbon sequestration of China’s forests during 2004-2008 was about 49.999 g C m-2 yr-1 and a little higher than the values given in the studies summarized above. But this result was small compared to estimates obtained using a more direct method based on ecological measurements in 11 forests along a north-south gradient across Europe, which was about 110 g C m-2 yr-1 (Janssens et al., 2003). With the increases of afforestation, reforestation and conversion of farmland to forest after 1998, the biomass and soil carbon storage of China’s forests began to increase rapidly, and the NBP and soil carbon sequestration were relatively high during the 7th FID compared with Piao’s results from counterbalancing changes in evergreen and deciduous forests (Piao et al., 2009).

5 Conclusions

The assessment of the potential for soil carbon sequestration in forest ecosystems requires a thorough understanding of the biogeochemical mechanisms responsible for carbon stocks and fluxes at different scales (Metting et al., 2001). In this regard, the choice of methods is critical so that results are reliable, comparable and extrapolatable (Lal, 2005). NFI serves as the main method of obtaining data on the quantity, quality and structural changes of forest resources. Given that a direct estimation of China’s forest soil carbon sequestration seemed difficult to achieved, we estimated the carbon sequestration capability of forest soil according to the forest ecosystem carbon balance principle based on the NFI and the estimations of NEP, biomass increment and NR. This method is a useful supplement and complementary to the current evaluation method of forest carbon sequestration based on the NFI, and it can provide an important scientific basis for the estimation of China’s forest soil carbon sequestration and help to develop better forest management strategies. This study can promote comparable studies on forest soil carbon sequestration with consistent research methods at the regional scale based on NFI, and it would be conducive to achieving a more accurate estimation regarding forest carbon sequestration.

We thank the Chinese Ecosystem Research Network for providing the research data.

[1]
Baker J M, Ochsner T E, Venterea R T, et al. 2007. Tillage and soil carbon sequestration-What do we really know? Agriculture, Ecosystems & Environment, 118(1-4): 1-5.

[2]
Bazrgar A B, Ng Aeryn, Coleman Brent, et al. 2020. Long-term monitoring of soil carbon sequestration in woody and herbaceous bioenergy crop production systems on marginal lands in Southern Ontario, Canada. Sustainability, 12: 3901. DOI: 10.3390/su12093901.

DOI

[3]
Bond-Lamberty B, Wang C K, Gower S T. 2004. A global relationship between the heterotrophic and autotrophic components of soil respiration? Global Change Biology, 10(10): 1756-1766.

DOI

[4]
Chen G S, Yang Y S, Lu P P, et al. 2008. Regional patterns of soil respiration in China’s froests. Acta Ecologica Sinica, 28(4): 1748-1761. (in Chinese)

[5]
Davidson E A, Savage K, Bolstad P, et al. 2002. Belowground carbon allocation in forests estimated from litterfall and IRGA-based soil respiration measurements. Agricultural and Forest Meteorology, 113(1-4): 39-51.

DOI

[6]
Dixon R K, Solomon A M, Brown S, et al. 1994. Carbon pools and flux of global forest ecosystems. Science, 263(5144): 185-190.

PMID

[7]
Dunne J A, Saleska S R, Fischer M L, et al. 2004. Integrating experimental and gradient methods in ecological climate change research. Ecology, 85(4): 904-916.

DOI

[8]
Fang J, Chen A, Peng C, et al. 2001. Changes in forest biomass carbon storage in China between 1949 and 1998. Science, 292(5525): 2320-2322.

PMID

[9]
Fang J Y, Guo Z D, Piao S L, et al. 2007. Terrestrial vegetation carbon sinks in China, 1981-2000. Science in China (Series D): Earth Sciences, 50(9): 1341-1350.

[10]
Fang J Y, Ke J H, Tang Z Y, et al. 2001. Implications and estimations of four terrestrial productivity parameters. Acta Phytoecologica Sinica, 25(4): 414-419. (in Chinese)

[11]
Fang J Y, Liu G H, Xu S L. 1996. Biomass and net production of forest vegetation in China. Acta Ecologica Sinica, 16(5): 497-508. (in Chinese)

[12]
Ghasemi A F. 2018. Soil carbon sequestration and understory plant under needle and broadleaved plantations (Case study: Shahed Forest Park of Malayer City). Ecopersia, 6(1): 1-10.

[13]
Gower S T, Pongracic S, Landsberg J J. 1996. A global trend in belowground carbon allocation: Can we use the relationship at smaller scales? Ecology, 77(6): 1750-1755.

DOI

[14]
Hart S C, Sollins P. 1998. Soil carbon and nitrogen pools and processes in an old-growth conifer forest 13 years after trenching. Canadian Journal of Forest Research, 28(8): 1261-1265.

DOI

[15]
Janssens I A, Freibauer A, Ciais P, et al. 2003. Europe’s terrestrial biosphere absorbs 7% to 12% of European anthropogenic CO2 emissions. Science, 300(5625): 1538-1542.

PMID

[16]
Kauppi P E, Mielikäinen K, Kuusela K. 1992. Biomass and carbon budget of European forests, 1971 to 1990. Science, 256(5053): 70-74.

PMID

[17]
Lal R. 2005. Forest soils and carbon sequestration. Forest Ecology and Management, 220(1-3): 242-258.

DOI

[18]
Liski J, Perruchoud D, Karjalainen T. 2002. Increasing carbon stocks in the forest soils of western Europe. Forest Ecology and Management, 169(1-2): 159-175.

DOI

[19]
Liu G H, Fu B J, Fang J Y. 2000. Carbon dynamics of Chinese forests and its contribution to global carbon balance. Acta Ecologica Sinica, 20(5): 733-740. (in Chinese)

[20]
Luo T X. 1996. The distrubition patterns and modeling of biomass and net primary production in China main forests. Diss., Beijing, China: Chinese Academy of Sciences. (in Chinese)

[21]
Luyssaert S, Schulze E D, Börner A, et al. 2008. Old-growth forests as global carbon sinks. Nature, 455(7210): 213-215.

DOI

[22]
McCarl B A, Metting F B, Rice C. 2007. Soil carbon sequestration. Climatic Change, 80(1-2): 1-3.

DOI

[23]
Metting F B, Smith J L, Amthor J S, et al. 2001. Science needs and new technology for increasing soil carbon sequestration. Climatic Change, 51(1): 11-34.

DOI

[24]
Pacala S W. 2001. Consistent land- and atmosphere-based US carbon sink estimates. Science, 292(5525): 2316-2320.

[25]
Pan Y D, Luo T X, Birdsey R, et al. 2004. New estimates of carbon storage and sequestration in China’s forests: Effects of age-class and method on inventory-based carbon estimation. Climatic Change, 67(2-3): 211-236.

DOI

[26]
Piao S L, Fang J Y, Ciais P, et al. 2009. The carbon balance of terrestrial ecosystems in China. Nature, 458(7241): 1009-1013.

DOI

[27]
Raich J W, Nadelhoffer K J. 1989. Belowground carbon allocation in forest ecosystems: Global trends. Ecology, 70(5): 1346-1354.

DOI

[28]
Schimel D S. 1995. Terrestrial ecosystems and the carbon cycle. Global Change Biology, 1(1): 77-91.

DOI

[29]
Schlesinger W H. 1990. Evidence from chronosequence studies for a low carbon-storage potential of soils. Nature, 348(6298): 232-234.

DOI

[30]
Schroeder P, Brown S, Mo J M, et al. 1997. Biomass estimation for temperate broadleaf forests of the United States using inventory data. Forest Science, 43(3): 424-434.

[31]
State Administration of Forestry of China. 2006. Chinese forestry statistical yearbook (1999-2003). Beijing, China: China Forestry Publishing House. (in Chinese)

[32]
State Administration of Forestry of China. 2010. Chinese forestry statistical yearbook (2004-2008). Beijing, China: China Forestry Publishing House. (in Chinese)

[33]
Tian X R, Shu L F, Wang M Y. 2003. Direct carbon emissions from Chinese forest fires, 1991-2000. Fire Safety Science, 12(1): 6-10. (in Chinese)

[34]
Turner D P, Koerper G J, Harmon M E, et al. 1995. A carbon budget for forests of the conterminous United States. Ecological Applications, 5(2): 421-436.

DOI

[35]
Vermeulen S, Bossio D, Lehmann J, et al. 2019. A global agenda for collective action on soil carbon. Nature Sustainability, 2: 2-4.

DOI

[36]
Wang B, Huang J Y, Yang X S, et al. 2010. Estimation of biomass, net primary production and net ecosystem production of China’s forests based on the 1999-2003 National Forest Inventory. Scandinavian Journal of Forest Research, 25(6): 544-553.

DOI

[37]
Wang S, Chen J M, Ju W M, et al. 2007. Carbon sinks and sources in China’s forests during 1901-2001. Journal of Environmental Management, 85(3): 524-537.

PMID

[38]
Wang X K, Feng Z W, Zhuang Y H. 2001. CO2, CO and CH4 emissions from forest fires in China. Scientia Silvae Sinicae, 37(1): 90-95. (in Chinese)

[39]
Wang X K, Zhuang Y H, Feng Z W. 1998. Estimation of carbon-containing gases released from forest fire. Advances in Environmental Science, 6(4): 1-15. (in Chinese)

[40]
Wang Y H, Liu K X, Wu Z P, et al. 2020. Comparison and analysis of three estimation methods for soil carbon sequestration potential in the Ebinur Lake Wetland, China. Frontiers of Earth Science, 14(1): 13-24.

DOI

[41]
Wang Y X. 1999. Study on regional carbon cycle of forest ecosystem in China. Diss., Beijing, China: Chinese Academy of Sciences. (in Chinese)

[42]
Xu X L, Cao M K, Li K R. 2007. Temporal-spatial dynamics of carbon storage of forest vegetation in China. Progress in Geograhpy, 26(6): 1-16. (in Chinese)

[43]
Yu G R. 2003. Global change, carbon cycle and storage in terrestrial ecosystem. Beijing, China: China Meteorological Press. (in Chinese)

[44]
Zeng W S, Chen X Y, Pu Y, et al. 2018. Comparison of different methods for estimating forest biomass and carbon storage based on national forest inventory data. Forest Research, 31(1): 66-71. (in Chinese)

[45]
Zhang Y X. 2006. Change analysis on Chinese forest construction from 1950 to 2003. Journal of Beijing Forestry University, 28(6): 80-87. (in Chinese)

[46]
Zhao D H, Li J L, Qi J G, et al. 2006. An overview of current methods to estimate carbon budget of terrestrial ecosystems. Acta Ecologica Sinica, 26(8): 2655-2662. (in Chinese)

[47]
Zhao M, Zhou G S. 2005. Estimation of biomass and net primary productivity of major planted forests in China based on forest inventory data. Forest Ecology and Management, 207(3): 295-313.

DOI

[48]
Zhou G S, Wang Y H, Jiang Y L, et al. 2002. Estimating biomass and net primary production from forest inventory data: A case study of China’s Larix forests. Forest Ecology and Management, 169(1-2): 149-157.

DOI

[49]
Zhou G Y, Liu S G, Li Z A, et al. 2006. Old-growth forests can accumulate carbon in soils. Science, 314(5804): 1417. DOI: 10.1126/science.1130168.

DOI

Outlines

/