Industry Ecology and Regional Development

Estimating the Spatial and Temporal Changes in the Green Development Level in Beijing during 2006-2016

  • LUN Fei , 1 ,
  • LI Hong 2 ,
  • HU Qiyuan 1 ,
  • GAO Xiang 1 ,
  • ZHA Sihan 1 ,
  • HUO Wei 1 ,
  • ZHANG Dan 3 ,
  • XIAO Xiao , 1, *
Expand
  • 1. College of Land Science and Technology, China Agricultural University, Beijing 100193, China
  • 2. Institute of Plant Nutrition and Resources, Beijing Academy of Agriculture and Forestry Sciences, Beijing 100097, China
  • 3. Institute of Geographic Sciences and Natural Resources Research, Chinese Academy of Sciences, Beijing 100101, China
* XIAO Xiao, E-mail:

LUN Fei, E-mail:

Received date: 2021-08-23

  Accepted date: 2021-10-27

  Online published: 2022-01-08

Supported by

The National Natural Science Foundation of China(41801202)

The National Natural Science Foundation of China(41911530693)

Abstract

Green development is an important way to achieve global sustainable development goals, and has become one of the main research hotspots in recent years. Balancing economic development and environmental protection has turned out to be a great challenge in Beijing, the capital of China, which can provide some suggestions on ecological civilization construction and green development for other cities. However, there have been limited studies on this crucial topic. Therefore, based on the statistical data for Beijing from 2006 to 2016, this paper constructed the green development evaluation system of Beijing, and used the Projection Pursuit Model and spatial analysis method to analyze the spatial and temporal changes in its green development level. We also aimed to further explore the influences of key factors on green development. Our results illustrated that: (1) the overall and average levels of green development in Beijing showed significant increasing trends; (2) there are obvious spatial differences in green development among districts in Beijing, with the outer districts showing higher values; and (3) the environmental condition and human consumption were two important factors driving the green development in Beijing.

Cite this article

LUN Fei , LI Hong , HU Qiyuan , GAO Xiang , ZHA Sihan , HUO Wei , ZHANG Dan , XIAO Xiao . Estimating the Spatial and Temporal Changes in the Green Development Level in Beijing during 2006-2016[J]. Journal of Resources and Ecology, 2022 , 13(1) : 161 -172 . DOI: 10.5814/j.issn.1674-764x.2022.01.017

1 Introduction

The world has witnessed remarkable economic increases over last few decades, and GDP per capita increased from 5503.67 USD in 2000 to 10925.73 USD in 2020 (IBRD, 2021). Meanwhile, this soaring economic development inevitably led to some serious environmental issues, such as water pollution, air pollution, ecosystem degradation, biodiversity losses, and so on (Ahmed, 2012; Taşkın et al., 2020). For example, more than half of global wildlife has disappeared due to habitat losses. To achieve a balance between environment protection and economic development, the concept of “Sustainable Development” was proposed by the World Commission on Environment and Development (WECD) in 1987. This principle highlighted achieving economic and social development within environmental and biophysical limits (Zhu and Shi, 2016). Then, the concept of “green development” was pointed out by Pearce (Cheng et al., 2019). In addition, some international programs began to focus on how global sustainable development could be achieved, such as the Millennium Development Goals. In 2015, the Sustainable Development Goals (SDGs) were proposed to achieve a better and more sustainable future and aim to address global challenges of poverty, inequality, climate change, environmental degradation, peace and justice (Holden et al., 2017). These 17 SDGs are interconnected in the three dimensions of economy, society and environment (Dong and Zhang, 2016; Gupta and Vegelin, 2016; Lv et al., 2018; Li et al., 2020).
The theoretical origins of green development can be traced back to the “Global Green New Deal” concept proposed by the United Nations in October 2008, which was a response to the economic crisis. The idea was that countries should take a long-term view when formulating economic stimulus plans, build a green system and promote sustainable development, thereby promoting green change. After that, green development was believed to be a blueprint for achieving global sustainable development, and it was the symbiosis among economy, society and environment, with limited consumption and emissions (Hu, 2017; Feng et al., 2017). In addition, in 2011, the United Nations Industrial Development Organization (UNIDO), which is dedicated to the construction of global industrialization and industrial development, formulated a more authoritative concept of green development. UNIDO proposed that green development is not at the expense of the natural systems and humans, and its fundamental importance is to include environmental, climatic and social factors in the consideration of production and development. Green development is about upgrading industries and increasing production capacity to meet the material needs of human society without increasing the burden of resource consumption and pollution (UNIDO, 2011). Under the advocacy and promotion of international organizations, scholars have also conducted corresponding research on the connotation and role of green development, and although the current scope of the concept of green development has not yet been unified, the current research on the definition of the concept of “green development” is mainly focused on the “resource-saving, environment-friendly and ecologically sound”. Although the current research on the concept of green development is extensive, it mainly focuses on the three dimensions of resource conservation, environmental friendliness and ecological well-being. Pei et al. (2018) argue that green development can meet one or more of these dimensions. Therefore, this study is based on the research of Pei et al. (2018) on the connotation of green development, and this paper defines green development as a collection of industries or enterprises that are conducive to resource conservation, environmental friendliness and ecological goodness.
At the same time, with the principle of sustainable development, global scientists have focused on evaluating their green development levels. For example, Cracolici et al. (2018) evaluated the sustainable well-being in Italy by the activity analysis model; Sun et al. (2020) evaluated the inclusive green growth levels of 285 cities in China during the period of 2003-2015, with the help of the Luenberger index; and Liu et al. (2020) established the agricultural green production assessment index system, and then discussed agricultural green production levels in China during the period of 1978-2017. Meanwhile, many other scientists aimed to explore the factors that have influenced green development, and they suggested the main factors include regional well-being (Cracolici et al., 2018), environmental supervision (Hu and Liu, 2013), management practices (Wang et al., 2018), and technical levels (Su and Zhang, 2020). Besides, industry transformation and local natural resources have also shown great impacts on promoting green development (Feng et al., 2017; Cheng and Ge, 2020; Liu et al., 2020).
A reasonable green development evaluation system can scientifically and effectively evaluate the level of urban development, and can also be effective for allocating natural resources. Thus, evaluating the green development level in cities had attracted lots of attention. Benetto et al. (2009) took ecological security as the core index of green development and evaluated the green development status of small sewage treatment plants. Cracolici et al. (2018) evaluated the green development level of different regions in Italy according to the welfare indicators of regional sustainable development. Zhou et al. (2015) established a regional low-carbon Green Development Index System to explore the operation of a low-carbon economy in different provinces of China. On the basis of previous studies, this paper defines green development as a social and economic development model based on the concept of environmental protection and sustainable development, integrating economic value, ecological value and social value; and thus establishes an evaluation system based on the three dimensions of green production, green living and green environment, which is more logical than other alternatives. In addition, the Projection Pursuit Model (PPM) is widely used in multi-index evaluation research, as it is more reliable and rigorous than traditional methods. For example, Meng et al. (2019) conducted a comprehensive evaluation of the ecological compensation effect in the Xiaohong River Basin using PPM. Wang and Yang (2021) applied PPM to provide a comprehensive assessment between Sichuan and Chongqing. Compared with the more general methods, the application of PPM is more mature and reliable.
China has already become the second largest economy in the world, and its domestic GDP per capita has increased more than 60-fold since 1978. Meanwhile, this rapid economic development has consumed massive amounts of natural resources and also poses great threats to local ecosystems (Chen et al., 2019; Fernandes et al., 2020). At present, China has also become the largest energy consumer and carbon emitter (Long and Ji, 2019), and it also presents a relatively low score in the Environmental Performance Index (Li and Chen, 2012; Li et al., 2019). Therefore, it is of great significance to balance economic development and environmental protection in China.
Beijing is the capital of China, and as an important window to the outside world, it represents the country and plays a pioneering role in the development of the whole country. In 2014, policy makers put forward the vision of making Beijing a livable city and building a resource-saving and environment-friendly society. In 2015, China directly adopted “green development” as one of the five major concepts of economic and social development, and effectively integrated it into the whole process of economic development. Therefore, promoting green development in Beijing is in line with Beijing's own development needs. In 2013, Beijing ranked first in the country in terms of China’s Eco-Cities (GECI); however, it only ranked 13th in the GECI, which excludes economic indicators, with the level of ecological civilization significantly lagging behind economic development (Huang and Li, 2017). The environmental problems induced by economic development are becoming increasingly prominent, such as illegal construction, air pollution and traffic congestion. Green development is the key to solving these problems.
In Beijing, mountains and plains coexist with different natural endowments and a wide range of economic and social development levels. The suburban areas are beautiful but lagging behind in terms of economic development, while the urban areas are highly urbanized but have ecological and environmental problems. The existing provincial evaluation reports take the whole of Beijing as the evaluation unit, and that makes it difficult for individual regions to address specific issues, which need to be discussed and analyzed in terms of functional areas. Therefore, a clear positioning and localized evaluation system which is oriented to the main functional areas can provide a more meaningful guide for grassroots ecological construction. This paper is dedicated to highlighting the scientific nature of indicators and their weights, overcoming the generality of existing indicators, and analyzing the current situation of green development in each of the functional areas in Beijing with more reasonable and targeted indicators. It also identifies the factors influencing green development in Beijing based on the differences in the levels of green development of each region.
The paper proceeds with the following sections. Section 2 provides the data and evaluation methods. The results mainly show the green development state and the spatial-temporal characteristics from 2006 to 2016 in Section 3. The discussions of the main findings are provided in Section 4. As the concluding section, the major contributions and conclusions are summarized in Section 5.

2 Data and method

2.1 Study area

Beijing, the capital of China, is located at 116°20'E and 39°56'N. Its built-up area is 1485 km2 and there are 16 districts which are divided among four functional zones. 1) The core of functional zone (CFZ) is located in the center of Beijing, including Dongcheng and Xicheng. 2) The functional expansion zone (FEZ) is an export-oriented economic service area, and it includes the four districts of Chaoyang, Fengtai, Shijingshan and Haidian. 3) The urban development zone (UDZ) is located in the east and south of Beijing, including Fangshan, Tongzhou, Shunyi, Changping and Daxing. 4) The ecological reservation zone (ERZ) is the ecological barrier and water source of Beijing, including Mentougou, Huairou, Pinggu, Miyun and Yanqing (Fig. 1). The GDP per capita in Beijing had grown from 49.50 thousand yuan in 2006 to 57.27 thousand yuan in 2016. The PM2.5 concentration of each functional zone has shown a downward trend, while the per capita energy consumption is still increasing. The data used in this paper were mainly obtained from the second agricultural census (2006) and the third agricultural census (2016) in Beijing. We also collected some statistical data from the Beijing Statistical Yearbook (2007-2017).
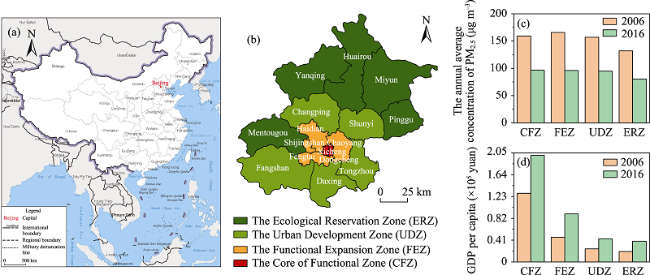
Fig. 1 The study area and its associated green development indicators. (a) Location of the study area in China; (b) Locations of the functional zones in the study area; (c) Average concentrations of PM2.5 of each functional zone in 2006 and 2016; (d) GDP per capita of each functional zone in 2006 and 2016.

Note 1: Here and elsewhere in this essay, CFZ means the core of functional zone, includes Dongcheng and Xicheng; FEZ means the functional expansion zone, includes Chaoyang, Fengtai, Shijingshan and Haidian; UDZ means the urban development zone, includes Fangshan, Tongzhou, Shunyi, Changping and Daxing; and ERZ means the ecological reservation zone, includes Mentougou, Huairou, Pinggu, Miyun and Yanqing.

2.2 The green development evaluation index system for Beijing

2.2.1 The Green Development Index System

Based on a previous study, it is known that the connotation of green development includes high economic dynamism, resource conservation, environmental friendliness and ecological goodness (Huang and Li, 2017), while green development can be divided into different types according to its content. Therefore, this paper classifies Beijing's green development into green production, green living and green environment from the social and economic perspectives (Pei et al., 2018), and discusses the green development situation in Beijing mainly from these three dimensions. At the same time, local administrators have proposed the indicator systems of “Green Development” in Beijing in 2017, which serve as the basis for evaluating the level of ecological civilization in our study. In addition, the SDGs emphasized the health of human life (Goal 3), clean energy (Goals 6 and 7) and sound infrastructure (Goals 9 and 11). Therefore, this paper established the regional green development evaluation index system, with three dimensions and 21 indicators (Table 1), by combining Beijing’s Green Development Indicators with the SDGs emphasis. In addition, the statistical indicators suitable for Beijing’s green development were selected by combining data from the two agricultural censuses, and the indicators can reflect the economic development, social development and ecological development of Beijing. Among them, the green production dimension mainly includes eight indicators, which are closely related to local production; the green living dimension includes eight indicators, which are closely related to human consumption; and finally, the five indicators of the green environment dimension are mainly related to the environment. Ultimately, there are 7 positive indicators and 14 negative indicators in this evaluation index system.
Table 1 The evaluation index system of green development in Beijing
Dimension Indicator Negative or positive
Green
Production
P1: Energy consumption per GDP Negative
P2: Electricity consumption per GDP Negative
P3: Water supply per GDP Negative
P4: Energy consumption per unit area Negative
P5: Electricity consumption per unit area Negative
P6: Water consumption per unit area Negative
P7: GDP per capita Positive
P8: GDP per unit area Positive
Green
Living
L1: The number of cars per capita Negative
L2: The number of cars per unit area Negative
L3: Household energy consumption per capita Negative
L4: Household water consumption per capita Negative
L5: The number of public libraries per ten
thousand people
Positive
L6: The number of hospitals per ten thousand people Positive
L7: The number of stadiums per ten thousand people Positive
L8: The harmless treatment rate of household waste Positive
Green
Environment
E1: The density of population Negative
E2: The coverage rate of forest Positive
E3: The annual average concentration of SO2 Negative
E4: The annual average concentration of NO2 Negative
E5: The annual average concentration of PM2.5 Negative

2.2.2 The Projection Pursuit Model

The projection pursuit theory, which was proposed in the late 1960s, can be used to project the higher dimensional data into the lower dimensions of the original data. At present, the Projection Pursuit Model (PPM) is mainly used to calculate known sample data without setting the weights in advance. This paper used the PPM to calculate the weight coefficient of each indicator in the above system (Table 1), and the more detailed methods were as follows.
All indicators were standardized by the following formula (1).
${{{x}'}_{ij}}=\left\{ \begin{matrix} \frac{{{x}_{ij}}~-\text{min}\ {{x}_{j}}}{\text{max}\ {{x}_{j}}-\text{min}\ {{x}_{j}}}~\begin{matrix} {} & {} \\ \end{matrix}\left( ~{{x}_{ij~}}\text{ is the Positive Index} \right) \\ ~~\frac{\max {{x}_{j}}-{{x}_{ij}}}{\max {{x}_{j}}-\min {{x}_{j}}}\begin{matrix} {} & {} \\ \end{matrix}~\left( ~{{x}_{ij~}}\text{ is the Negative Index} \right) \\ \end{matrix} \right.$$\left( i=1,2,\cdots,nj=1,2,\cdots,m \right)$
In formula (1), xij is the original data,${{{x}'}_{ij}}$ is the standardized data, max xj is the maximum xj of all data, min xj is the minimum xj, n is the number of samples, m is the number of indicators, i is the current count of samples and j is the current count of indicators. Then, the green development projection indicator function is constructed by formula (2).
${{Z}_{i}}=\underset{j=1}{\mathop{\overset{n}{\mathop{\mathop{\sum }^{}}}\,}}\,{{a}_{j}}{{{x}'}_{ij}}\begin{matrix} {} & {} \\ \end{matrix}\left( i=1,2,\cdots,n;\ j=1,2,\cdots,m \right)$
In formula (2), Zi is the one-dimensional projection value with aj as the projection direction, ${{{x}'}_{ij}}$ is the standardized data, n is the number of samples, m is the number of indicators, i is the current count of samples and j is the current count of indicators. Then, we constructed the projection objective function for green development by formula (3).
$Q(a)=S(a)\times D(a)$
In formula (3), we define the objective function as Q(a), S(a) is the standard deviation of the projection values Zi, D(a) is the density of the projection values Zi, which is calculated as formulas (4) - (6).
$S\left( a \right)=\sqrt{\underset{i}{\mathop{\overset{n}{\mathop{\mathop{\sum }^{}}}\,}}\,\frac{{{\left( {{Z}_{i}}-E \right)}^{2}}}{n-1}}\begin{matrix} {} & {} \\ \end{matrix}\left( i=1,2,\cdots,n \right)$
$D\left( a \right)=\underset{i=1}{\mathop{\overset{n}{\mathop{\mathop{\sum }^{}}}\,}}\,\underset{k=1}{\mathop{\overset{n}{\mathop{\mathop{\sum }^{}}}\,}}\,\left( R-{{r}_{ik}} \right)\times u\left( R-{{r}_{ik}} \right)\begin{matrix} {} \\ \end{matrix}~\left( i,k=1,2,\cdots,n \right)$
$u\left( t \right)=\left\{ \begin{matrix} 1,\begin{matrix} {} & {} \\ \end{matrix}t\ge 0 \\ 0,\begin{matrix} {} & {} \\ \end{matrix}t<0 \\ \end{matrix} \right.$
$t=R-{{r}_{ik}}$
In formulas (4) - (7), E is the mean value of the projection values Zi, R is the radius of the density, usually taken as 0.01, rik =| zi - zk | is the distance between the two projection values, u(t) is the unit step function, n is the number of samples, m is the number of indicators, i and k is the current count of samples.
Finally, the optimal projection direction aj can be calculated by formula (8), which is the constraint equation.
$\left\{ \begin{matrix} \text{max }Q\left( a \right)=S\left( a \right)\times D\left( a \right) \\ \underset{j=1}{\mathop{\overset{m}{\mathop{\mathop{\sum }^{}}}\,}}\,a_{j}^{2}=1 \\ \end{matrix} \right.$
In formula (8), max Q(a) is the maximum value of Q(a), aj is the weight of each index, m is the number of indicators and j is the current count of indicators. Substituting it into formula (2), we can obtain the comprehensive evaluation value Zi for each region and then analyze the green development levels of different regions based on Zi.

2.2.3 The Green Development Index

The Green Development Index (GDI) is the most direct indicator for comparing the levels of green development among regions. Therefore, this article established the Beijing green development evaluation system and calculated the GDI based on the comprehensive evaluation value (Zi) of each region above and the weights of each indicator obtained using the PPM, and then further analyzed the temporal and spatial characteristics of green development in Beijing. The specific calculation process follows formula (9).
$GD{{I}_{i}}=\frac{{{Z}_{i}}}{\underset{i=1}{\mathop{\overset{n}{\mathop{\mathop{\sum }^{}}}\,}}\,a_{i}^{{}}}\times 100$
In formula (9), GDIi indicates the level of regional green development, Zi is the one-dimensional projection value with the best projection direction, ai is the indicator weighting, n is the number of indicators and i is the current count.

3 Results

3.1 The index assignment of green development in China

The weight scores did not present significant differences among the three dimensions of GDI (Table 2); however, the detailed indicators presented great variations. Industrial production was strongly associated with energy and water consumption, and thus their consumption played an important role in local green production. Specifically, water consumption per unit area (P6) contributed the largest share of local green production, followed by energy consumption per unit area (P4); meanwhile, the weight of GDP per capita (P7) had a very low score of 0.059. There were only a few differences among the detailed indicators for the green living dimension, with the largest score for the level of green development. The number of stadiums per ten thousand people (L7), the number of cars per unit area (L2) and the number of cars per capita (L1) also presented large scores due to their high levels of energy consumption. The weights of the remaining indicators ranged from 0.1254-0.1551. Meanwhile, the indicators of the green environment dimension had relatively larger scores; in particular, the forest coverage (E2) had the largest weight of 0.3722, followed by the density of population (E1).
Table 2 The evaluation index system of green development in Beijing and the indicator and dimension scores
Dimension Indicator Weight
Green
production
1.3900
P1: Energy consumption per GDP 0.1200
P2: Electricity consumption per GDP 0.0654
P3: Water supply per GDP 0.0800
P4: Energy consumption per unit area 0.3132
P5: Electricity consumption per unit area 0.2306
P6: Water consumption per unit area 0.3668
P7: GDP per capita 0.0590
P8: GDP per unit area 0.1622
Green
living
1.4100
L1: The number of cars per capita 0.1800
L2: The number of cars per unit area 0.2347
L3: Household energy consumption per capita 0.1263
L4: Household water consumption per capita 0.1551
L5: The number of public libraries per ten thousand people 0.1254
L6: The number of hospitals per ten thousand people 0.1279
L7: The number of stadiums per ten thousand people 0.3193
L8: The harmless treatment rate of household waste 0.1422
Green
environment 1.3281
E1: The density of population 0.3327
E2: The coverage rate of forest 0.3722
E3: The annual average concentration of SO2 0.1961
E4: The annual average concentration of NO2 0.2148
E5: The annual average concentration of PM2.5 0.2123

3.2 The temporal change of green development in Beijing

Green development in Beijing presented an obviously fluctuating and increasing trend during the period of 2006-2016. The average score of GDI had jumped from 54.28 in 2006 to 65.28 in 2016, thanks to the great improvement in the green living and environment dimensions. Moreover, the highest GDI in Beijing had increased from 71.46 (Huairou) in 2006 to 84.67 (Yanqing) in 2016, while the lowest GDI did not presented a clear increase during this period, with its GDI in the narrow range of 34.39-35.57 (Dongcheng). In addition, our study period can be divided into three stages: 1) the rapid development stage from 2006 to 2008, 2) the stable stage of 2008-2013 and 3) the fast development stage after 2013 (Fig. 2). For the first stage, the total GDI score increased from 54.28 to 59.46, mainly because the 2008 Beijing Olympic Games resulted in the improvement of local ecosystems. Specifically, the total score of the green environment dimension increased from 15.81 in 2006 to 20.13 in 2008. For the next stage between 2008 and 2013, the total scores of GDI in Beijing remained stable at around 59, and the three dimensions of GDI presented limited fluctuation during this period. However, the score of GDI had increased by 10% from 2013 to 2016, and it reached 65.28 in 2016, thanks to the improvement of the green environment and living dimensions. For the period of 2006-2016, the total score of GDI increased by about 20%, about two-thirds of which was contributed by the great improvement in the local environment. In particular, the total score of GDI had increased by 9.5% from 2006 to 2008, which was mainly due to the dimension of green environment (83%). Subsequently, the total score of GDI increased by 2.9% during the period of 2008-2013, while the score of the green living dimension decreased. On the contrary, the GDI score of green living presented an obvious increasing trend from 2013 to 2016, thanks to the increase of the green development dimension.
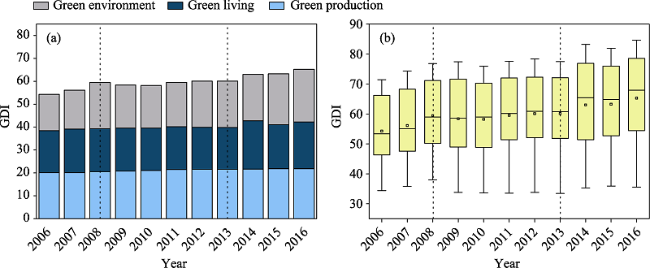
Fig. 2 The overall trend of green development in Beijing during the research period. (a) The green development index of Beijing from 2006 to 2016; (b) Box diagram of the green development index in Beijing from 2006 to 2016.

3.3 The index assignment of green development in Beijing

From the spatial viewpoint, the green development level presented obvious spatial differences in Beijing. The Moran’s I of Beijing’s green development amounted to 0.98 (>0), which clearly shows that the green development in Beijing had obvious spatial correlation during the study period. The outer zones of Beijing presented higher GDI than the inner zones in 2016, thanks to their better environment (Fig. 3). Specifically, the GDI scores of the UDZ and the ERZ were relatively higher compared with the CFZ and the FEZ. In 2016, the GDI scores of all districts in the UDZ and the ERZ exceeded 60, while the remaining districts were less than 57. Except for Mentougou, the remaining four districts in ERZ had a GDI of larger than 80. However, the GDI scores in CFZ were less than 40, and specifically for Dongcheng it was 35.57. For the period of 2006-2016, the GDI of ERZ presented a significant increase of 19%, about one-half of which was contributed by the green environment dimension. Besides, the GDI of Shijingshan presented the largest increase of 41% and it reached 56.43 in 2016; however, Fangshan had the largest growth rate, with an increase of 16.04 during the study period. At the same time, the growth rates of Yanqing and Daxing were relatively large (Fig. 4). Individual districts in the UDZ and the FEZ also presented some increases of GDI during this period. Specifically, the GDI of the UDZ had increased by 25% from 2006 to 2016, and its average was 68.86 in 2016; for the GDI of the FEZ, it increased from 45.32 in 2006 to 54.37 in 2016. However, the CFZ did not present the clear increase of GDI during this period, and the GDIs were stable at 35.8 for Dongcheng and Xicheng.
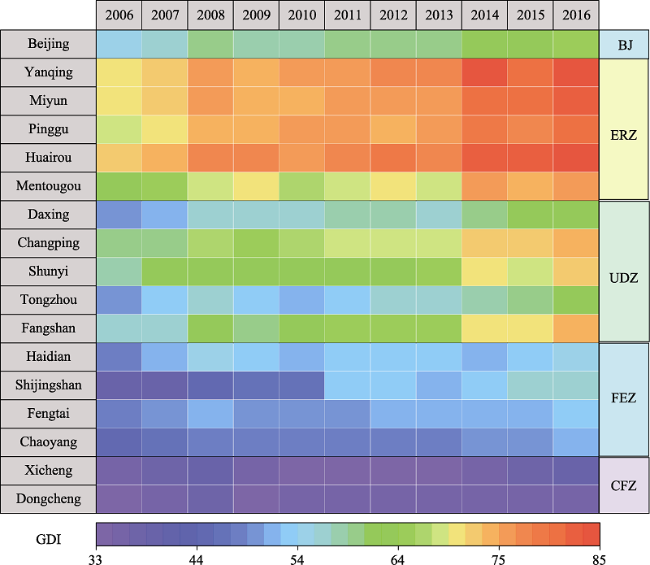
Fig. 3 The Green Development Index (GDI) in Beijing from 2006 to 2016
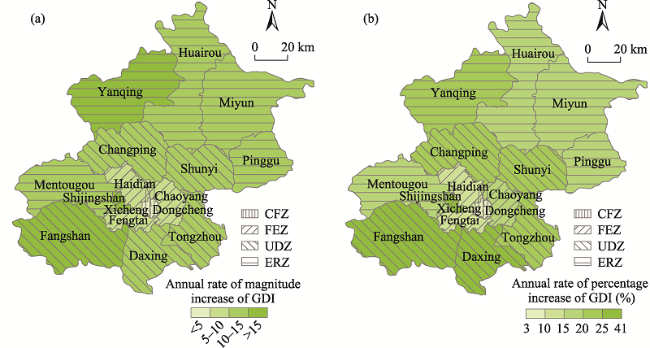
Fig. 4 Changes in the green development in Beijing during the study period. (a) Annual rate of magnitude increase of green development in Beijing; (b) Annual rate of percentage increase of green development in Beijing.

3.4 The dominant indicators of green development in Beijing

From 2006 to 2016, the average level of green development in Beijing significantly improved, and its dominant indicators also changed considerably. There were obvious differences among the dominant indicators and their associated GDIs for the different functional zones. Our research showed that the green environment dimension played the most important role in the green development of Beijing from 2006 to 2016 (Fig. 5); however, the dominant dimension changed from the green production dimension in 2006 to the green environment dimension in 2016. More specifically, the increase in the green environment dimension contributed the largest share (66%) in Beijing during these 10 years, followed by the green living dimension. With the improvement of environmental quality, the green environ ment gradually became the dominant dimension of the green development for all the functional zones in Beijing.
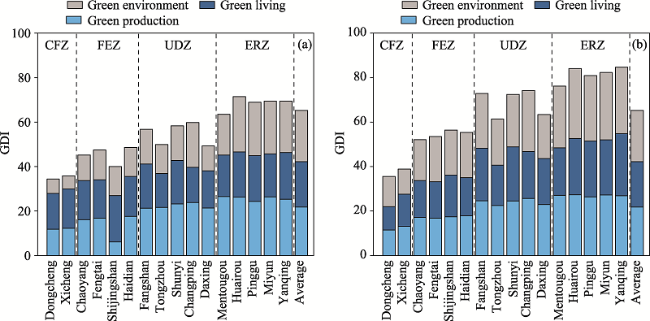
Fig. 5 Comparison of green development components in Beijing. (a) The composition of green development in 2006; (b) The composition of green development in 2016.
However, the leading dimension of green development presented great differences among the different districts, due to their distinct economic and social levels (Fig. 6). Comparing the GDIs of 2006 and 2016, we found that the improvement of infrastructure in the ERZ, especially the improvement in the quantity and quality of hospitals (L6) and stadiums (L7), had improved the green development in the ERZ to some extent, resulting in the highest level of green development of the GDI at 83.40, about 25% higher than the overall level of Beijing. This was closely related to the positioning of the functional zone. In addition, the increases of energy consumption (L3) and water consumption (L4) led to a decline in the level of green development outside the ERZ. It is worth noting that environmental improvement was an important manifestation of green development in the CFZ, but the increases of cars (L1), domestic energy use (L2 and L3), and the density of population (E1), as well as a decrease of the forest coverage rate (E2), limited the improvement in green development in the CFZ. Although the GDI of the FEZ (54.93) was higher than that of the CFZ, it was lower than the overall level of Beijing (66.53), with the significant improvement of energy consumption (P4) and the E2 being the main reasons for the increase of green development.
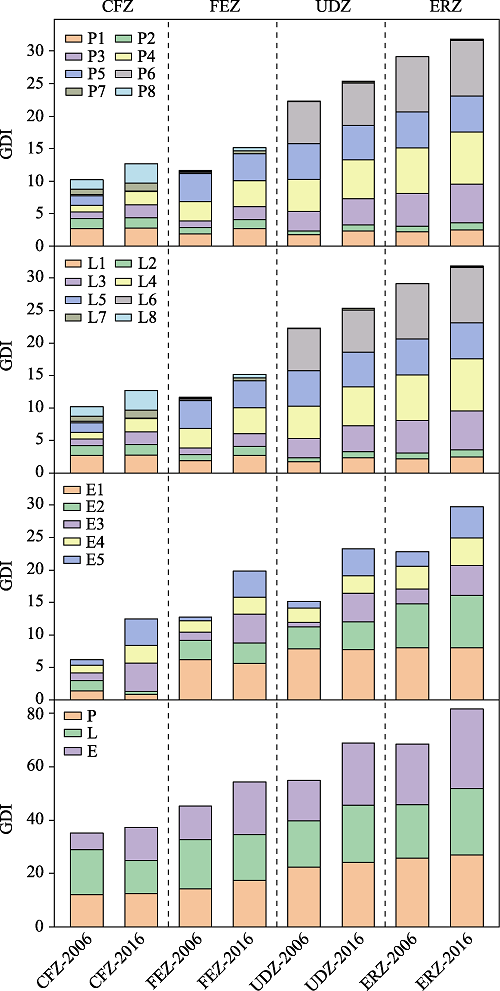
Fig. 6 Detailed charts of the green development score composition of each functional area in Beijing in 2006 and 2016
In general, the CFZ and the FEZ showed downward trends of their green living dimension, while the GDI of the green living dimension in the UDZ and the ERZ had increased. In particular, the GDI of the ecological conservation areas increased by 21%, and the green living dimension contributed about 40% to the green development. The green environment dimension led to the increases of green development in the CFZ and the FEZ, especially considering their reductions of SO2 (E3), NO2 (E4) and PM2.5 (E5). In addition, the green living and green environment were two important dimensions for green development in the UDZ.

4 Discussion

Considering local ecological and environmental capacity and resource carrying capacity, green development is important for achieving sustainable development. This paper discussed the relationship between the ecological environment and economic development in Beijing, using the GDI of each functional zone for the coverage rate of forest (E2), the annual average concentration of PM2.5 (E5), the number of hospitals per ten thousand people (L6), the number of stadiums per ten thousand people (L7) and GDP per capita (P7) in Beijing during 2006-2016. Finally, it further analyzed the factors currently obstructing green development and policy recommendations for improving the future green development in Beijing.

4.1 Environmental protection and economic development

It is important to explore the relationship between environmental protection and economic development. Rapid economic development in the past neglected the ecological priority of urban spatial layout planning, which has been excessively sloppy. Green development is facing the challenges of resource shortages, environmental pollution and ecological damage. From 2006 to 2016, haze was one of the serious pollution problems in Beijing, and its core feature was the relatively large value of E5. From Fig. 7, E2 and E5 were inversely related in Beijing during our study period. This indicated that E2 was an important factor in achieving ecological safety functions, especially in the ERZ. In addi tion, as the northern and western parts of Beijing were the main sources of wind and sand, the E2 in the ERZ located in this region was more important for Beijing’s ecological security. Meanwhile, E2 and P7 were inversely correlated in areas with higher levels of economic development (the CFZ), while they were positively correlated in areas with a better ecological environment (the ERZ and the UDZ). These relationships suggested that economic levels are generally lower in areas with better ecological safety functions, while higher economic levels are concentrated in areas with poorer ecological safety functions.
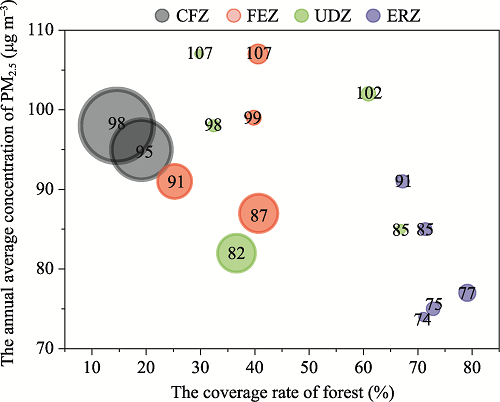
Fig. 7 Relationship between the coverage rate of forest (E2) and the annual average concentration of PM2.5 (E5) in function zones

Note: The size each bubble represents the level of GDP per capita (P7) and its color represents the functional zones.

Combining Fig. 7 and Fig. 8 shows that the ERZ was the ecological protection barrier of Beijing and it was the main area for green development in Beijing, which is consistent with the research results of Li et al. (2019). During the period of 2006-2016, the E2 in the ERZ had a very high value of 0.90 in 2016, and it had actively increased by about 19%, while the average score of E2 in Beijing increased from 0.45 in 2006 to 0.52 in 2016. Meanwhile, the economic and green development in the ERZ were limited, due to strict restrictions on the expansion of urban construction land, and thus the ERZ should make more effort to develop by better coordinating the relationship between ecological function and economic development.
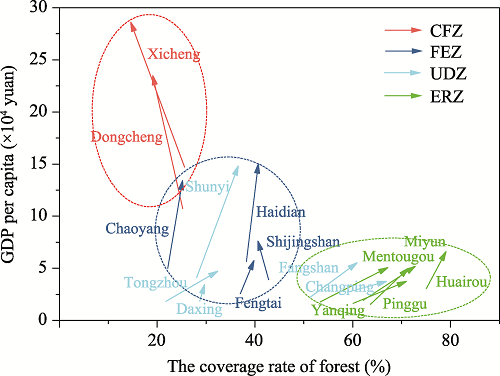
Fig. 8 Changes in the coverage rate of forest (E2) and the level of GDP per capita (P7) between 2006 and 2016

Note: The angle formed by the direction of each arrow and the abscissa can be used to characterize the rate of regional economic development and ecological development.

4.2 The barriers to green development in the ERZ

Since 2012, the economic development in China has required the promotion of an intensive and efficient production space, a livable and moderate living space, and a mountainous and clear ecological space, where ecological space refers to the functional areas that provide ecological services and areas with important ecological protection functions (China Development Report, 2013). Therefore, according to the functional area positioning and development requirements, the ERZ becomes the ecological protection barrier of Beijing and the main area for green development in Beijing. This paper discusses the main barriers to green development in the ERZ using energy use efficiency indicators (P1 and P3). The overall trend of energy use efficiency in the ERZ continued to increase over the study period (Fig. 9a, 9b). Specifically, all zones in the ERZ, except for Mentougou, showed upward trends in energy use efficiency (about 20%). However, compared to other functional zones, the energy use efficiency in the ERZ remains high, especially when compared to P1 in the CFZ. After analyzing the reasons, we found that the ERZ had more labor- intensive and resource-intensive industries during the study period, which are characterized by high input, high consumption and high output. This has led to a lack of resources for industrial development in the ERZ, which has affected the development of modern industries. Therefore, the high consumption of resources and the low efficiency of energy use are the main obstacles for the green development in the ERZ.
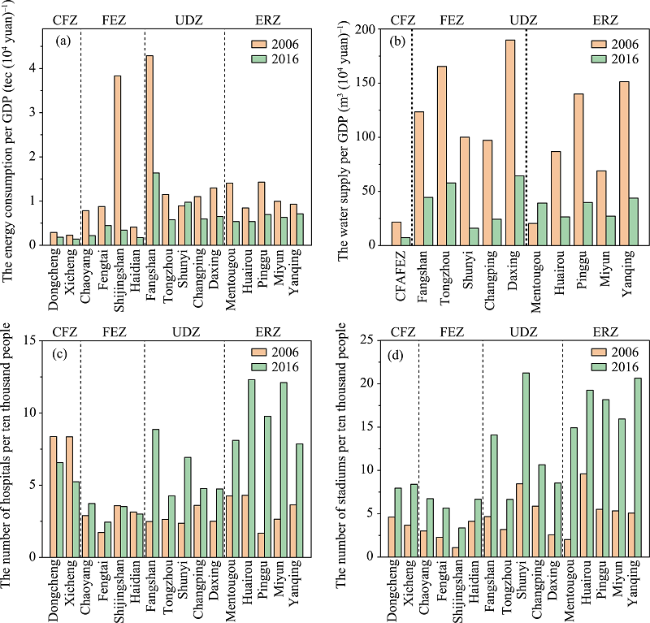
Fig. 9 Comparative situation of green development characteristic indexes in different regions of Beijing analyzed in 2006 and 2016. (a) The energy consumption per GDP in 2006 and 2016; (b) The water supply per GDP in 2006 and 2016; (c) The number of hospitals per ten thousand people in each functional zone; (d) The number of stadiums per ten thousand people in each functional zone.

Note: CFAFEZ means CFZ and FEZ, the two regions are shown together due to the small amount of water supply per GDP and the small intra-regional differences.

In addition, green living is one of the dominant factors affecting green development in the ERZ. Infrastructure increases the area’s attractiveness to modern industries and elites to a certain extent, which is conducive to regional green development. The relatively weak infrastructure in Beijing’s ecologically cultured areas has become an important factor limiting its green development. Compared with 2006, the number of infrastructure components in ERZ increased significantly by 2016, which became one of the main factors for its green development (Fig. 9c, 9d).
In summary, the relatively high consumption of resources and the relatively low efficiency of energy use in the ERZ are the main barriers affecting its green development. This paper suggests promoting its development from the dimensions of green living and green environment. Firstly, the government can reduce the burden of economic development in the ERZ by imposing taxes. Secondly, the government can increase its attractiveness to enterprises and elites through preferential policies. For example, the government can introduce laws on a reward and punishment system to reward enterprises that actively transform to modernization and green development, while adopting certain punitive measures for enterprises with a low resource consumption rate, and the government should strictly supervise the mitigation of enterprises with serious pollution problems. Finally, the relevant authorities should strengthen the public’s awareness of green living, such as using public transport and reducing household waste.

5 Conclusions

As the capital of China, the green development in Beijing is a direct reflection and also directly affects the level of ecological civilization in China. The GDI represents the current performance of green development and illustrates the historical progress of green transformation. Based on Beijing’s environmental indicator data and the PPM, this paper establishes Beijing’s green development evaluation index system, discusses the level of green development in Beijing from 2006-2016, analyses its spatial and temporal evolution according to the GDI and Moran’s I, and finally discusses the main factors affecting green development. The main conclusions are as follows.
In the construction of the green development evaluation index system, this paper refers to the indicators of the Beijing Green Development Index System by the Beijing government. Due to its comprehensive concept, green development should consider the environmental problems, economic development and social needs, and thus the green development evaluation index system is constructed with these three dimensions. In addition, this paper also uses PPM to obtain the weights of the evaluation system. Among them, the weight of the green living dimension is relatively high, at about 1.410.
In terms of the changes in GDI, Beijing’s green development during this period was steady, with its average and overall levels showing clear upward trends. There are obvious spatial differences in the rates and magnitudes of green development among the functional zones. In general, Beijing’s green development has increased from the inside out. At the same time, we found that the great improvement of the environment is the main reason for green development. In addition, green development is characterized by a clearly phased evolution, which can be divided into three stages: rapid (2006-2008), stable (2008-2012) and rapid (2012- 2016). With further exploration by the government, the dominant factors influencing Beijing’s green development have gradually shifted from the single dimension of green environment to a new model dominated by green environment and green living, while the contribution of green production is relatively limited. It is worth mentioning that the ERZ is the main bearing area of green development in Beijing, with the largest score of GDI. At the same time, the GDI increase in the UDZ was greater than the others, which is closely related to the developmental orientation of each functional zone.
The ecological environment, energy consumption and population density are important factors affecting the green development of Beijing. The improvement of the ecological environment, represented by the increase of forest coverage and the decrease of the concentration of PM2.5, dominated the green development of Beijing, especially after 2008. The increase of domestic energy consumption and inefficient application of non-clean energy seriously limit the green development. Effective green development tends to reduce the consumption of non-green energy sources as a means of improving the ecological environment in areas with a relatively well-developed social economy (i.e., the CFZ and the FEZ), while in areas with a relatively better ecological environment, green production enterprises should be developed to improve the level of economic development (i.e., the UDZ and the ERZ). With the rapid development of China and the increasing emphasis on the ecological environment, there is a certain amount of room for green development in Beijing. At the same time, the important ecological civilization policy provides the necessary conditions and exploration space for its development.
[1]
Ahmed E M. 2012. Green TFP intensity impact on sustainable east Asian productivity growth. Economic Analysis and Policy, 42(1): 67-78.

DOI

[2]
Benetto E, Nguyen D, Lohmann T, et al. 2009. Life cycle assessment of ecological sanitation system for small-scale wastewater treatment. Science of the Total Environment, 407: 11.016. DOI: 10.1016/j.scitotenv.2008.11.016.

DOI

[3]
Chen L L, Zhang X D, He F, et al. 2019. Regional green development level and its spatial relationship under the constraints of haze in China. Journal of Cleaner Production, 210: 376-387.

DOI

[4]
Cheng C Y, Ge C Z. 2020. Green development assessment for countries along the Belt and Road. Journal of Environmental Management, 263: 110344. DOI: 10.1016/j.jenvman.2020.110344.

DOI

[5]
Cheng Y, Wang J J, Wang Y P, et al. 2019. A comparative research of the spatial-temporal evolution track and influence mechanism of green development in China. Geographical Research, 38(11): 2745-2765. (in Chinese)

[6]
Cracolici M F, Cuffaro M, Lacagnina V. 2018. Assessment of sustainable well-being in the Italian regions: An activity analysis model. Ecological Economics, 143: 105-110.

DOI

[7]
Dong L, Zhang H B. 2016. Environmental objectives in the 2030 agenda for sustainable development and its implications on the world and China in environmental governance. China Population, Resources and Environment, 26(1): 8-15. (in Chinese)

[8]
Feng C, Wang M, Liu G C, et al. 2017. Green development performance and its influencing factors: A global perspective. Journal of Cleaner Production, 144: 323-333.

DOI

[9]
Fernandes S D C, Pigosso D C A, McAloone T C, et al. 2020. Towards product-service system oriented to circular economy: A systematic review of value proposition design approaches. Journal of Cleaner Production, 257: 120507. DOI: 10.1016/j.jclepro.2020.120507.

DOI

[10]
Gupta J, Vegelin C. 2016. Sustainable development goals and inclusive development. International Environmental Agreements: Politics, Law and Economics, 16(3): 433-448.

DOI

[11]
Holden E, Linnerud K, Banister D. 2017. The imperatives of sustainable development. Sustainable Development, 25(3): 213-226.

DOI

[12]
Hu A G. 2017. The new era of ecological civilization of socialism with Chinese characteristics. Forestry Economics, 39(12): 3-5. (in Chinese)

[13]
Hu Y M, Liu J K. 2013. Green development transition: Literature review and theory analysis. Contemporary Economic Research, (6): 33-42, 93. (in Chinese)

[14]
Huang Y, Li L. 2017. A comprehensive assessment of green development and its spatial-temporal evolution in urban agglomerations of China. Geographical Research, 36(7): 1309-1322. (in Chinese)

[15]
IBRD (International Bank for Reconstruction and Development). 2021. World Bank national accounts data and OECD National Accounts data files. https://data.worldbank.org.cn/indicator/NY.GDP.PCAP.CD?view=a)hart. Viewed 27 Oct 2021.

[16]
Li L, Chen B P. 2012. Ecological footprint and green development in China. China Population, Resources and Environment, 22(5): 63-65. (in Chinese)

[17]
Li W, Xi Y Q, Liu S Q, et al. 2020. An improved evaluation framework for industrial green development: Considering the underlying conditions. Ecological Indicators, 112: 106044. DOI: 10.1016/j.ecolind.2019.106044.

DOI

[18]
Li Y Y, Huang S, Zhang B, et al. 2019. Discussion on evaluation of ecological service value and ecological compensation mechanism of Beijing ecological conservation area. Chinese Journal of Environmental Management, 11(5): 94-99. (in Chinese)

[19]
Liu Y F, Sun D S, Wang H J, et al. 2020. An evaluation of China’s agricultural green production: 1978-2017. Journal of Cleaner Production, 243: 118483. DOI: 10.1016/j.jclepro.2019.118483.

DOI

[20]
Long X L, Ji X. 2019. Economic growth quality, environmental sustainability, and social welfare in China-Provincial assessment based on Genuine Progress Indicator (GPI). Ecological Economics, 159: 157-176.

DOI

[21]
Lv Y L, Wang Y C, Yuan J J, et al. 2018. Some thoughts on promoting the implementation of sustainable development goals in China. China Population, Resources and Environment, 28(1): 1-9. (in Chinese)

[22]
Meng Y, Liu M, Guan X J, et al. 2019. Comprehensive evaluation of ecological compensation effect in the Xiaohong River Basin, China. Environmental Science and Pollution Research, 26(8): 7793-7803.

DOI

[23]
Pei Q B, Gu L J, Bai Q. 2018. The connotation of green industry under the background of green development. Environmental Protection, 46(Z1): 86-89. (in Chinese)

[24]
Su S, Zhang F. 2020. Modeling the role of environmental regulations in regional green economy efficiency of China: Empirical evidence from super efficiency DEA-Tobit model. Journal of Environmental Management, 261: 110227. DOI: 10.1016/j.jenvman.2020.110227.

DOI

[25]
Sun Y H, Ding W W, Yang Z Y, et al. 2020. Measuring China’s regional inclusive green growth. Science of the Total Environment, 713: 136367. DOI: 10.1016/j.scitotenv.2019.136367.

DOI

[26]
Taşkın E, Tan İ, Minareci E, et al. 2020. Ecological quality status of the Turkish coastal waters by using marine macrophytes (macroalgae and angiosperms). Ecological Indicators, 112: 106107. DOI: 10.1016/j.ecolind.2020.106107.

DOI

[27]
UNIDO The United Nations Industrial Development Organization. 2011. Ministerial meeting 2011 details ministerial meeting on energy and green industry green industry initiative for sustainable industrial development. https://www.unido.org/news-centre/events/vienna-energy-forum/vienna-energy-forum-2011/ministerial-meeting-2011/ministerial-meeting-2011-details.

[28]
Wang M X, Zhao H H, Cui J X, et al. 2018. Evaluating green development level of nine cities within the Pearl River Delta, China. Journal of Cleaner Production, 174: 315-323.

DOI

[29]
Wang Q, Yang X. 2021. Evaluating the potential for sustainable development of China’s shale gas industry by combining multi-level DPSIR framework, PPFCI technique and RAGA algorithm. Science of the Total Environment, 780: 146525. DOI: 10.1016/j.scitotenv.2021.146525.

DOI

[30]
Zhou Y, Guo Y J, Yi P T, et al. 2015. Comprehensive evaluation method for operational situation of Chinese provincial low-carbon economy and its application. Technology Economics, 34(8): 52-57. (in Chinese)

[31]
Zhu B, Shi X Y. 2016. The comprehensive evaluation and strategies analyses of regional industry green transformation: Based on Fujian Povince’s data. Ecological Economy, 32(9): 100-105. (in Chinese)

Outlines

/