
Journal of Resources and Ecology >
Alpine Grassland Aboveground Biomass and Theoretical Livestock Carrying Capacity on the Tibetan Plateau
|
ZHANG Xianzhou, E-mail: zhangxz@igsnrr.ac.cn |
Received date: 2021-09-13
Accepted date: 2021-10-13
Online published: 2022-01-08
Supported by
The Second Tibetan Plateau Scientific Expedition and Research Program (STEP)(2019QZKK1002)
The National Natural Sciences Foundation of China(41807331)
The West Light Foundation of the Chinese Academy of Sciences(2018)
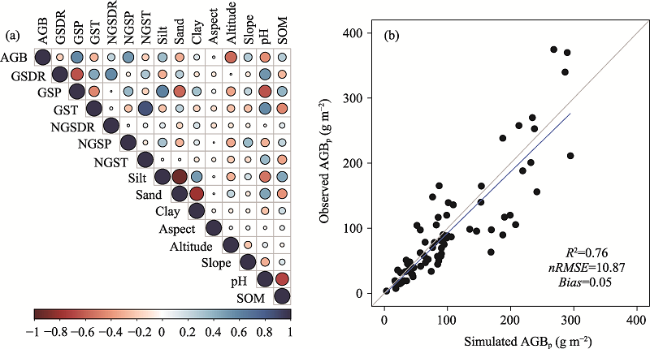
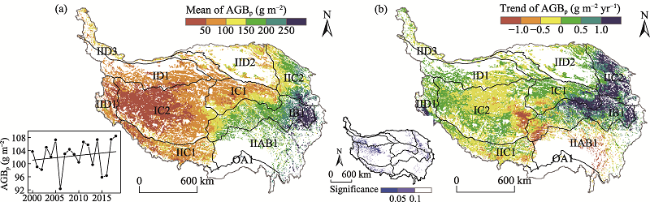
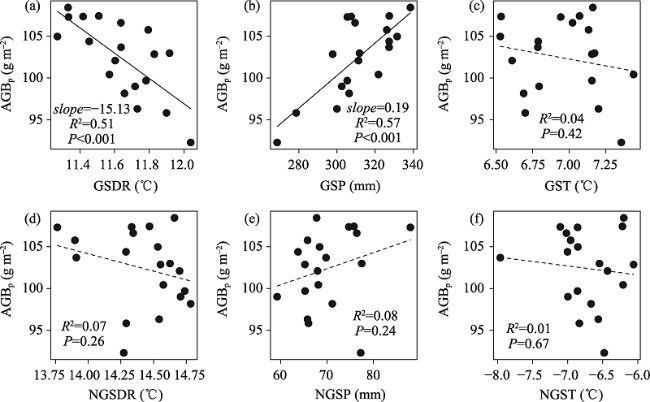
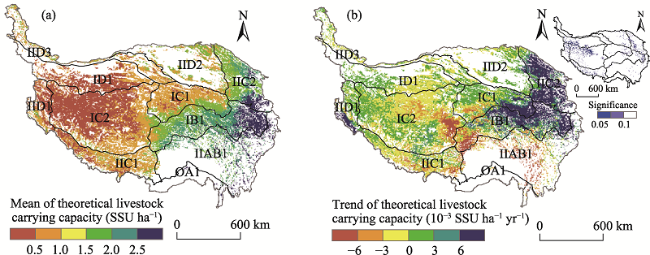
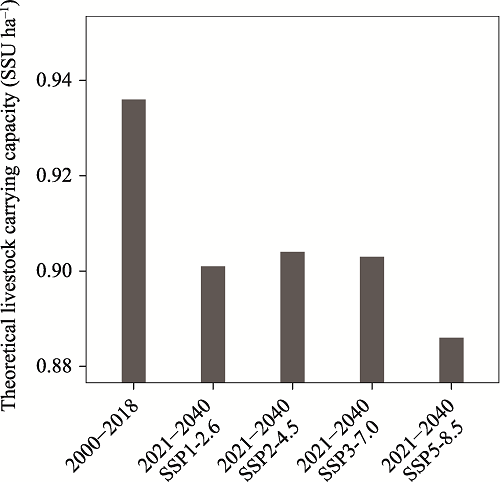
The accurate simulation and prediction of grassland aboveground biomass (AGB) and theoretical livestock carrying capacity are key steps for maintaining ecosystem balance and sustainable grassland management. The AGB in fenced grassland is not affected by grazing and its variability is only driven by climate change, which can be regarded as the grassland potential AGB (AGBp). In this study, we compiled the data for 345 AGB field observations in fenced grasslands and their corresponding climate data, soil data, and topographical data on the Qinghai-Tibetan Plateau (TP). We further simulated and predicted grassland AGBp and theoretical livestock carrying capacity under the climate conditions of the past (2000-2018) and future two decades (2021-2040) based on a random forest (RF) algorithm. The results showed that simulated AGBp matched well with observed values in the field (R2 = 0.76, P < 0.001) in the past two decades. The average grassland AGBp on the Tibetan Plateau was 102.4 g m-2, and the inter-annual changes in AGBp during this period showed a non-significant increasing trend. AGBp fluctuation was positively correlated with growing season precipitation (R2 = 0.57, P < 0.001), and negatively correlated with the growing season diurnal temperature range (R2 = 0.51, P < 0.001). The average theoretical livestock carrying capacity was 0.94 standardized sheep units (SSU) ha-1 on the TP, in which about 54.1% of the areas showed an increasing trend during the past two decades. Compared with the past two decades, the theoretical livestock carrying capacity showed a decreasing trend in the future, which was mainly distributed in the central and northern TP. This study suggested that targeted planning and management should be carried out to alleviate the forage-livestock contradiction in grazing systems on the Tibetan Plateau.
ZHANG Xianzhou , LI Meng , WU Jianshuang , HE Yongtao , NIU Ben . Alpine Grassland Aboveground Biomass and Theoretical Livestock Carrying Capacity on the Tibetan Plateau[J]. Journal of Resources and Ecology, 2022 , 13(1) : 129 -141 . DOI: 10.5814/j.issn.1674-764x.2022.01.015
Table 1 Estimated mean aboveground biomass (AGB) of alpine grassland on the Tibetan Plateau in various published studies |
| Time period | Study area (104 km2) | Methods | Variables considered | AGB (g m-2) | References |
|---|---|---|---|---|---|
| 1960-2002 | 147.74 | Century | Climate and soil data | 70.00 | Zhang et al., 2007 |
| 2002-2004 | 139.00 | Orchidee | Climate, soil and LAI data | 119.78 | Tan et al., 2010 |
| 1980-1990 | 113.60 | Area-weighted average | - | 58.11 | Ni, 2004 |
| - | 101.10 | Area-weighted average | - | 61.15 | Luo et al., 1998 |
| 2001-2004 | - | Filed observations | - | 59.30 | Yang et al., 2010 |
| 2001-2004 | 112.80 | Linear regression | EVI | 68.80 | Yang et al., 2009 |
| 1982-2006 | 129.50 | Exponential regression | NDVI | 74.11 | Ma et al., 2010 |
| 2005 | 122.80 | Exponential regression | NDVI | 43.33 | Xu et al., 2017 |
| - | 124.00 | Exponential regression | NDVI | 78.02 | Piao et al., 2004 |
| 1982-2013 | 154.48 | Exponential regression | NDVI | 104.40 | Jiao et al., 2017 |
| 2000-2014 | 151.11 | Random forest | Climate, terrain and NDVI | 77.12 | Zeng et al., 2019 |
| - | 132.00 | Random forest | Climate and NDVI | 78.40 | Xia et al., 2018 |
| 2000-2017 | - | Random forest | Climate, terrain and NDVI | 59.63 | Gao et al., 2020 |
Note: The conversion coefficient between plant biomass (AGB, unit: g m-2) and carbon (unit: g C) is 0.45 as reported by Piao et al. (2004). |
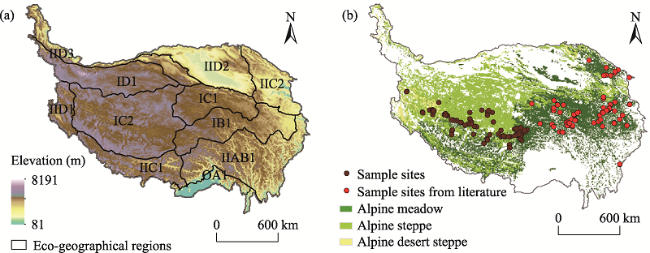
Fig. 1 Spatial distribution of eco-geographical regions and the sample sites on the Tibetan PlateauNote: (a) The eco-geographical regions of TP (Zheng, 1996) are the same as those listed in Table 2. (b) Sample sites in this study are from field observations and a previous study (Fu et al., 2017), which basically included all alpine grassland ecosystems on the TP. |
Table 2 List of abbreviations used in this study |
| Classification | Abbreviation | Meaning |
|---|---|---|
| Eco-geographical regions | TP | Tibetan Plateau |
| IB1 | Golog-Nagqu high-cold shrub-meadow zone | |
| IIAB1 | Western Sichuan-eastern Tibet montane coniferous forest zone | |
| IC1 | Southern Qinghai high-cold meadow steppe zone | |
| IC2 | Qiangtang high-cold steppe zone | |
| ID1 | Kunlun high-cold desert zone | |
| IIC1 | Southern Tibet montane shrub-steppe zone | |
| IIC2 | Eastern Qinghai-Qilian montane steppe zone | |
| IID1 | Nagri montane desert-steppe and desert zone | |
| IID2 | Qaidam montane desert zone | |
| IID3 | Northern slopes of Kunlun montane desert zone | |
| OA1 | Southern slopes of Himalaya montane evergreen broad-leaved forest zone | |
| Grass and livestock | AGBp | (Potential, only climate-derived) Aboveground biomass of the grassland |
| LCCT | Theoretical livestock carrying capacity | |
| SSU | The standardized sheep unit (daily feed of 1.33 kg hay in this study) | |
| Climate and soil | GSDR | Growing season (May to September in each year) diurnal temperature range |
| GSP | Growing season precipitation | |
| GST | Growing season temperature | |
| NGSDR | Non-growing season diurnal temperature range | |
| NGSP | Non-growing season precipitation | |
| NGST | Non-growing season temperature | |
| SOM | Soil organic matter |
Fig. 2 Correlation coefficients of grassland AGBp with 14 environmental factors (a) and the relationships between observed grassland AGBp and estimated AGBp on the TP based on the RF model (b) |
Table 3 The mean values and trends of grassland AGBp for each eco-region on the TP |
| Eco-geographical regions* | AGBp mean (g m-2) | AGBp trend (g m-2 yr-1) | ||
|---|---|---|---|---|
| Mean | Standard deviation (SD) | Mean | Standard deviation (SD) | |
| IB1 | 181.64 | 52.87 | 0.47 | 0.80 |
| ICI | 93.68 | 32.03 | 0.31 | 0.60 |
| IC2 | 53.81 | 24.90 | -0.11 | 0.30 |
| ID1 | 55.90 | 7.70 | 0.02 | 0.08 |
| IIAB1 | 196.47 | 46.29 | -0.23 | 0.69 |
| IIC2 | 167.11 | 44.29 | 1.04 | 0.59 |
| IIC1 | 80.47 | 25.17 | -0.16 | 0.29 |
| IID2 | 109.63 | 24.70 | 0.09 | 0.22 |
| OA1 | 228.15 | 35.00 | -0.53 | 0.48 |
| IID1 | 56.42 | 24.77 | 0.36 | 0.60 |
| IID3 | 92.39 | 23.35 | -0.02 | 0.11 |
| TP | 102.40 | 63.47 | 0.14 | 0.61 |
Note: * The eco-geographical regions of the TP are the same as indicated in Table 2. |
Fig. 3 The spatial and temporal patterns of AGBp on the TP from 2000 to 2018Note: The eco-geographical regions of the TP are the same as indicated in Table 2. |
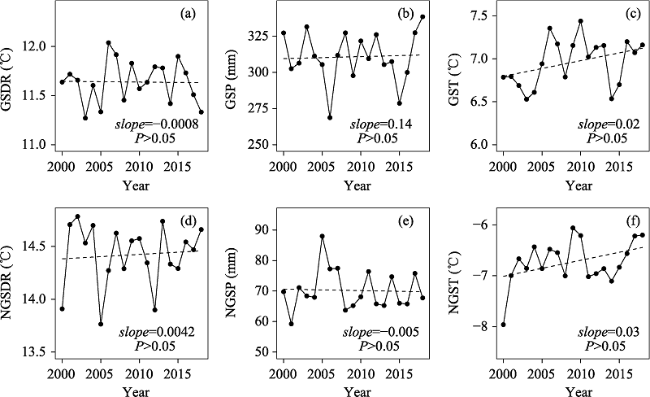
Fig. 4 The dynamics of growing season and non-growing season diurnal temperature, temperature, and precipitation on the Tibetan Plateau from 2000 to 2018.Note: The six climate variables from (a) to (f) are the same as indicated in Table 2. |
Fig. 5 Correlations between AGBp and climatic variables from 2000 to 2018 on the TPNote: The six climate variables are the same as indicated in Table 2. |
Fig. 6 The temporal-spatial patterns of the theoretical livestock carrying capacity from 2000 to 2018 on the TPNote: The eco-geographical regions of the TP are the same as indicated in Table 2. |
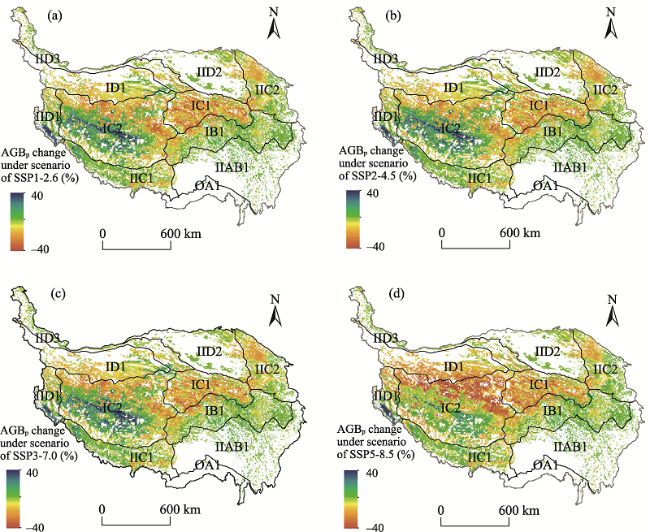
Fig. 7 The grassland potential aboveground biomass (AGBp) changes in different future climate change scenarios for each eco-region on the TP compared to the past two decadesNote: The eco-geographical regions of the TP are the same as indicated in Table 2. The different climate change scenarios of SSP1-2.6 SSP2-4.5, SSP3-7.0, and SSP5-8.5 (a-d) are the scenarios of low radiative forcing (2.6 W m-2), moderate radiative forcing (4.5 W m-2), medium to high radiative forcing (7.0 W m-2), and high radiative forcing (8.5 W m-2) in 2100 under the different social development conditions. |
Table 4 Grassland potential aboveground biomass (AGBp) changes in different future climate change scenarios for each eco-region on the TP compared to the past two decades (Unit: g m-2) |
| Eco-geographical regions* | SSP1-2.6 | SSP2-4.5 | SSP3-7.0 | SSP5-8.5 |
|---|---|---|---|---|
| IB1 | -2.70±9.54 | -2.24±9.31 | -2.16±9.60 | -2.40±10.10 |
| IC1 | -16.33±10.27 | -14.05±10.32 | -14.37±10.69 | -16.29±11.05 |
| IC2 | -0.67±18.05 | 0.81±18.09 | 0.63±18.76 | -11.51±17.43 |
| ID1 | -7.79±8.29 | -7.74±8.37 | -8.59±8.73 | -17.47±7.44 |
| IIAB1 | 2.75±5.73 | 2.48±5.64 | 2.84±6.07 | 2.28±6.07 |
| IIC2 | -7.11±8.8 | -8.14±8.54 | -8.43±8.28 | -6.01±9.10 |
| IIC1 | -0.98±9.29 | -0.72±9.31 | -0.22±9.45 | -1.24±8.96 |
| IID2 | -4.66±7.11 | -4.71±6.85 | -4.76±6.81 | -4.33±7.11 |
| OA1 | 1.94±2.69 | 1.30±1.93 | 1.61±2.28 | 0.93±2.01 |
| IID1 | 4.73±17.9 | 4.21±18.01 | 1.39±17.27 | -1.07±21.35 |
| IID3 | -5.03±8.21 | -4.18±7.24 | -4.11±7.46 | -5.27±8.00 |
| Tibetan Plateau | -3.75±13.82 | -3.05±13.7 | -3.25±14.05 | -7.96±14.14 |
Fig. 8 The theoretical livestock carrying capacity of alpine grasslands on the TP in the past two decades (2000-2018) and in the future two decades (2021-2040) under four climate change scenariosNote: The different climate change scenarios are the same as indicated in Fig. 7. |
| [1] |
|
| [2] |
|
| [3] |
|
| [4] |
|
| [5] |
|
| [6] |
|
| [7] |
|
| [8] |
|
| [9] |
|
| [10] |
|
| [11] |
|
| [12] |
|
| [13] |
|
| [14] |
|
| [15] |
|
| [16] |
|
| [17] |
|
| [18] |
|
| [19] |
|
| [20] |
|
| [21] |
|
| [22] |
|
| [23] |
|
| [24] |
|
| [25] |
|
| [26] |
|
| [27] |
|
| [28] |
|
| [29] |
|
| [30] |
|
| [31] |
|
| [32] |
|
| [33] |
|
| [34] |
|
| [35] |
|
| [36] |
|
| [37] |
|
| [38] |
|
| [39] |
|
| [40] |
|
| [41] |
|
| [42] |
|
| [43] |
|
| [44] |
|
| [45] |
|
| [46] |
|
| [47] |
|
| [48] |
|
| [49] |
|
| [50] |
|
| [51] |
|
| [52] |
|
| [53] |
|
| [54] |
|
| [55] |
|
| [56] |
|
| [57] |
|
| [58] |
|
| [59] |
|
| [60] |
|
| [61] |
|
| [62] |
|
| [63] |
|
| [64] |
|
| [65] |
|
| [66] |
|
| [67] |
|
| [68] |
|
| [69] |
|
| [70] |
|
| [71] |
|
| [72] |
|
| [73] |
|
/
| 〈 |
|
〉 |