Regional Geography and Ecological Changes

Quantitative Assessment of the Ecological Vulnerability of Baiyangdian Wetlands in the North China Plain

  • TIAN Jinghan , 1 ,
  • GUO Chenchen 2 ,
  • WANG Jianhua , 3, *
Expand
  • 1. College of Life Sciences, Cangzhou Normal University, Cangzhou, Hebei 061001, China
  • 2. College of Life Sciences, Hebei University, Baoding, Hebei 071002, China
  • 3. College of Politics and History, Cangzhou Normal University, Cangzhou, Hebei 061001, China
*WANG Jianhua, E-mail:

TIAN Jinghan, E-mail:

Received date: 2020-09-05

  Accepted date: 2021-02-16

  Online published: 2021-11-26

Supported by

The Key Research and Development Project by Science and Technology Program of Hebei(18273005)

Abstract

Quantitative assessment of vulnerability is a core aspect of wetland vulnerability research. Taking Baiyangdian (BYD) wetlands in the North China Plain as a study area and using the ‘cause-result’ model, 23 representative indicators from natural, social, sci-tech and economic elements were selected to construct an indicator system. A weight matrix was obtained by using the entropy weight method to calculate the weight value for each indicator. Based on the membership function in the fuzzy evaluation model, the membership degrees were determined to form a fuzzy relation matrix. Finally, the ecological vulnerability was quantitatively assessed based on the comprehensive evaluation index calculated by using a composite operator to combine the entropy weight matrix with the fuzzy relation matrix. The results showed that the ecological vulnerability levels of the BYD wetlands were comprehensively evaluated as Grade II, Grade Ⅲ, Grade IV, and Grade Ⅲ in 2010, 2011-2013, 2014, and 2015-2017, respectively. The ecological vulnerability of the BYD wetlands increased from low fragility in 2010 to general fragility in 2011-2013, and to high fragility in 2014, reflecting the fact that the wetland ecological condition was degenerating from 2010 to 2014. The ecological vulnerability status then turned back into general fragility during 2015-2017, indicating that the ecological situation of the BYD wetlands was starting to improve. However, the ecological status of the BYD wetlands on the whole is relatively less optimistic. The major factors affecting the ecological vulnerability of the BYD wetlands were found to be industrial smoke and dust emission, wetland water area, ammonia nitrogen, total phosphorus, rate of industrial solid wastes disposed, GDP per capita, etc. This illustrates that it is a systematic project to regulate wetland vulnerability and to protect regional ecological security, which may offer researchers and policy-makers specific clues for concrete interventions.

Cite this article

TIAN Jinghan , GUO Chenchen , WANG Jianhua . Quantitative Assessment of the Ecological Vulnerability of Baiyangdian Wetlands in the North China Plain[J]. Journal of Resources and Ecology, 2021 , 12(6) : 814 -821 . DOI: 10.5814/j.issn.1674-764x.2021.06.009

1 Introduction

Ecological vulnerability is one of the central issues in global change and sustainability research (Tian and Chang, 2012). The concept of “vulnerability” first appeared in a study of natural disasters in the late 1960s, and was first proposed in the field of geosciences by Timmerman in the 1980s. In the context of global environmental change and sustainable development, research on vulnerability has become a hotspot since the 1990s (Wang and Shi, 2019). The ecological vulnerability is widely considered to be the inverse of resilience, and a concept that has been most highly developed in ecological systems (Beroya-Eitner, 2016). It is defined as the degree to which a system is susceptible to experiencing harm, injury or damage due to exposure to a hazard, either a perturbation or a stress/stressor (de Lange et al., 2010; Beroya-Eitner, 2016). Research on ecological vulnerability in China, from exploring basic theories to multivariate empirical methods, is pluralistic and mainly reflected in the complexity of the research objects, regional differences and the diversity of technical solutions. Among many different kinds of empirical studies and evaluation indicator models, the “cause-result” model is the most widely applied, followed by the “exposure-sensitivity-adaptability” model, and the evaluation indicators are many and they are mainly derived from two factors: natural and human (Tian and Chang, 2012; Wang and Zhong, 2020). Nonetheless, both in theory and in practice, there are still many disputes regarding the characterization of vulnerability all over the world (Beroya-Eitner, 2016; Malekmohammadi and Jahanishakib, 2017). In particular, studies on wetland vulnerability remain relatively weak (Wang and Shi, 2019).
Wetlands are important for human well-being. The Baiyangdian (BYD) wetlands attract extensive attention due to their various ecological functions and services, especially in North China, which is a densely populated and water scarce region. The shortage of water resources in North China is a long-term intractable problem (Ge et al., 2017). Water has always been a chronic problem in resource allocation, ecological security and environmental sustainability in North China, and it is also one of the key issues affecting and restricting the future construction and development of Xiongan New Area (Xia and Zhang, 2017; Yu, 2018). As the lifeblood of this state-level new area (Liu et al., 2019), the importance of the BYD wetlands is obviously self-evident. Quantitative assessment of vulnerability is a core of wetland vulnerability research (Shang and Bai, 2012), yet no vulnerability study on the BYD wetlands has been reported thus far. Therefore, taking the BYD wetlands as a study area, and integrating entropy weight into a fuzzy evaluation model, the comprehensive and quantitative assessment of ecological vulnerability of the BYD wetlands is of theoretical and practical significance.

2 Methods

2.1 Study area

Located in the hinterland of the Beijing-Tianjin-Hebei region, the BYD wetlands are important sources of water regulation, flood control, pollution mitigation and ecological protection for the region. As the largest freshwater wetland area in the North China Plain, the BYD wetlands consist of more than 3700 streams and canals, and 143 lakes and ponds, whose bottom elevation ranges from 5.5 to 6.5 m (Zhuang et al., 2011). The BYD wetlands are bounded by 38°45′-39°02′N, 115°38′-116°07′E, with a total area of 366 km2 when the water level is 10.5m in Shifangyuan station above the Dagu sea level (Zhang et al., 2007). As a part of the ancient lake basin, the BYD wetlands lie in the low-lying area between Yongding River alluvial fan and Hutuo River alluvial fan, forming a large depression which catches eight main tributaries of the Daqing River system from Taihang Mountain (Fig. 1). On the basis of Quaternary alluvium, the soil developed mainly into swamp soil, cinnamon soil, fluvo-aquic soil and paddy soil. The vegetation consists of four subtypes including emergent, submerged, floating-leaved, and freely-floating aquatic vegetation. The region is characterized by a warm temperate and continental monsoon climate with an annual average temperature of 12.0 ℃, and annual average precipitation of 550-600 mm which varies greatly each year (Jiang et al., 2018). Within the wetlands, there are 39 pure water villages and 89 semi-water villages, with about 220000 residents (Yi et al., 2019). Around the wetlands, the dominant land use is farmland and the landscape structure is simple. Environmental pollution and ecological degradation in this region have been accelerating in the past several decades due to the continued pressures from rapid economic growth, industrialization and urbanization.
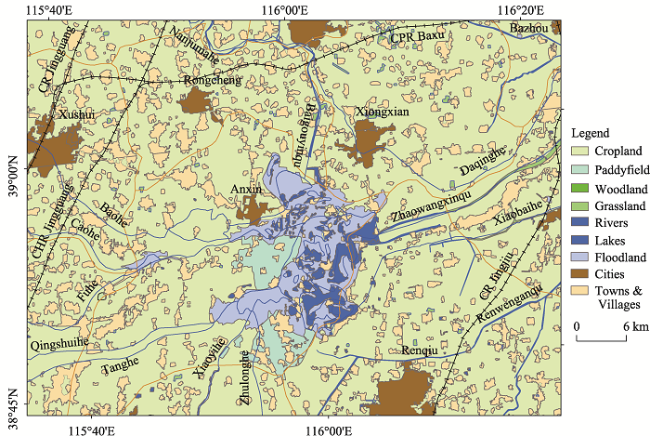
Fig. 1 Location of the BYD wetlands and land use and land cover types

2.2 Establishment of the evaluation indicator and criteria

Due to the complexity of study objects, the diversity of evaluation targets, and the uncertainty of the mechanisms influencing ecological vulnerability, there is no uniform indicator or standard system for vulnerability assessment or evaluation at present (Shang and Bai, 2012; Wang and Zhong, 2020). Every ecosystem is composed of the organisms and their environment. Considering that the environment is composed of air, water and soil, and is filled with a large number of spores and seeds which can germinate and grow once the conditions are suitable, we did not choose organisms as the indicators in our assessment model, but only evaluated the environmental elements, so it may also be called an environmental vulnerability assessment. However, it is difficult to separate environmental vulnerability from ecological vulnerability (Beroya-Eitner, 2016). The environmental limiting factors of the BYD wetlands are water shortage and pollution, so the selection of the evaluation indicators was mainly based on these two factors. By on-site surveys of the BYD wetlands during 2010-2017, with reference to the indicators commonly used in previous studies (Li et al., 2010; Yuan et al., 2011; Liu et al., 2014), and following the principles of representativeness, comprehensiveness, systematics and suitability (Li et al., 2010; Jin and Meng, 2011), an evaluation indicator system of ecological vulnerability for the BYD wetlands was finally constructed (Table 1). In this system, the vulnerability evaluation indicators are divided into two categories: cause and result. The cause is divided into natural cause and social cause, which represents the sensibility or influence of the system. The result includes sci-tech and economic elements, which represents its adaptive/recovery capacity or resilience (Li et al., 2010; Liu et al., 2014). The evaluation indicator set C = {c1, c2, …, cm}, and m = 23 (Table 1).
Table 1 Ecological vulnerability evaluation indicator system
Objective Item Element Indicator Number (*)
Ecological
vulnerability
assessment
for the BYD
wetlands
Cause Natural Annual average temperature c1 (+)
Total precipitation in summer c2 (+)
Wetland water area c3 (+)
Average water level c4 (+)
Shallow groundwater depth c5 (-)
Overall assessment of water quality c6 (-)
Social Permanganate index c7 (-)
Chemical oxygen demand c 8 (-)
Ammonia nitrogen c 9 (-)
Total phosphorus c 10 (-)
Mean composite pollution index c 11 (-)
Inland water breeding area c 12 (-)
Agricultural chemical fertilizer consumption c 13 (-)
Water consumption of industrial enterprises above a designated size c 14 (-)
Energy consumption of industrial enterprises above a designated size c 15 (-)
Total energy consumption c 16 (-)
Sulfur dioxide emission c 17 (-)
Industrial smoke and dust emission c 18 (-)
Rate of industrial solid wastes disposed c 19 (+)
Result Sci-tech Rate of industrial solid wastes comprehensively utilized c20 (+)
Energy consumption per unit industrial value added c21 (-)
Energy consumption per unit GDP c22 (-)
Economic GDP per capita c23 (+)

Note: * The indicators could be divided into positive indicators (+) and negative indicators (-) according to their properties. The higher the positive indicator value, the lower the ecological vulnerability, and the better the environmental quality or ecological status, while the negative indicator has the opposite relationship.

According to the actual data of each evaluation indicator, an evaluation criteria set S is determined (modified according to the literature of Yuan et al. (2011)). This method involves first calculating the average of each year as S3. Then, taking S3 as a standard, the value is increased and decreased by 10% and 30%, respectively, dividing the ecological vulnerability assessment criteria into five grades. For S = {S1, S2, …, Sn} (n=5), their meanings correspond to: Grade I, not fragile; Grade II, low fragile; Grade III, generally fragile; Grade IV, high fragile; and Grade V, severely fragile.

2.3 Construction of the fuzzy relation matrix

All of the data for the evaluation indicator set are primarily normalized, and a fuzzy relation matrix R is constructed.
$R={{({{r}_{jk}})}_{m\times n}}=\left[ \begin{matrix} {{r}_{11}} & {{r}_{12}} & \cdots & {{r}_{1n}} \\ {{r}_{21}} & {{r}_{22}} & \cdots & {{r}_{2n}} \\ \cdots & \cdots & \cdots & \cdots \\ {{r}_{m1}} & {{r}_{m2}} & \cdots & {{r}_{mn}} \\ \end{matrix} \right]$
where rjk is the membership degree of the jth indicator in the evaluation indicator set C to the kth grade in the evaluation criteria set S. In the formula, 0≤rjk≤1 ( j=1, 2, …, m; k=1, 2, …, n).
According to the maximum and minimum membership function from fuzzy set theory, whose membership function represents the degree to which the specified value belongs to the set in the fuzzy evaluation model (Wang et al., 2009), the membership degrees of the five grades of ecological vulnerability under the influence of a single factor are determined quantitatively.
The normalized expression of the membership degree rjk (Liu et al., 2017; Zhao et al., 2018) is:
For a positive indicator,
rjk = (Xjk ‒ Xmin) / (Xmax - Xmin)
For a negative indicator,
rjk = (Xmax ‒ Xjk) / (Xmax ‒ Xmin)
where Xjk is the original value; and Xmax and Xmin are the maximum and minimum of the jth indicator, respectively.
Finally, the five-grade membership function of each evaluation indicator is constructed in turn, the membership degree is obtained by substituting the evaluation factor data into the five-grade membership function, and ultimately 23 groups are obtained. Five numbers in each group are obtained to form a 5×23 fuzzy matrix.

2.4 Calculation of the weight of each indicator using entropy weight

The weight represents the importance of each evaluation indicator. The entropy weight method, which has been confirmed as an objective method for weight determination by previous studies (Zou et al., 2006; Zhao et al., 2018), is adopted in this evaluation to determine the weights. If the value of the evaluation indicator fluctuates greatly, then the calculated entropy value is small, indicating that the evaluation indicator has more information and the corresponding weight assigned to the evaluation indicator is large. On the contrary, if the differences between the values of a certain evaluation indicator are small, then the calculated entropy value is large, inferring that the indicator has less information and the weight assigned to the evaluation indicator is correspondingly small. By analogy, the weight of each evaluation indicator is determined according to the amount of information represented by that evaluation indicator. There are m evaluation indicators and n evaluation objects, and the information entropy of the jth indicator (Zou et al., 2006; Liu et al., 2014) can be defined as:
${{H}_{j}}=-K\underset{k=1}{\overset{n}{\mathop{\mathop{\sum }^{}}}}\,{{f}_{jk}}\ln {{f}_{jk}}\ (j=1,2,\cdots,m;\begin{matrix} {} \\ \end{matrix}k=1,2,\cdots,n)$
where K is a coefficient, and fjk is the ratio of the kth evaluation object value to the total evaluation object value of the jth indicator. In the formula, ${{f}_{jk}}=\tfrac{{{r}_{jk}}}{\underset{k=1}{\overset{n}{\mathop{\mathop{\sum }^{}}}}\,{{r}_{jk}}},\begin{matrix} {} \\ \end{matrix}K=\frac{1}{\ln n}$, and suppose when ${{f}_{jk}}=0,{{f}_{jk}}\ln {{f}_{jk}}=0$.
The entropy weight of the jth indicator can be defined as:
${{w}_{j}}=\frac{1-{{H}_{j}}}{m-\sum\limits_{j=1}^{m}{{{H}_{j}}}}$
where Hj is the information entropy of the jth indicator, and m is the number of evaluation indicators. In the formula, 0≤Wj≤1, $\underset{j=1}{\overset{m}{\mathop \sum }}\,{{w}_{j}}$ ≤1.
Using this formula, the weight matrix W, for W = {Wj} (j=1, 2, …, m) can be obtained.

2.5 Calculation of the fuzzy comprehensive evaluation index

Finally, the weight matrix W and the fuzzy relation matrix R are combined to produce the fuzzy comprehensive evaluation index matrix V.
V= W Ô R
In the formula (6), “Ô” represents the fuzzy composite operator, and the calculation is similar to the ordinary matrix calculation. There are two fuzzy composite operators which are used more widely: one is the “×” and “+”, the other is the “∧”and “∨”. They can be expressed as Ô (×, +) and Ô (∧,∨), respectively. According to our previous studies, a fuzzy evaluation model using the operator Ô (∧,∨) may lose more information than one using the operator Ô (×, +) (Wang et al., 2009). Therefore, the operator Ô (×, +) was finally chosen to carry out the matrix composite operation.

2.6 Data collection and processing

The evaluation indicator data are mainly collected from four sources: 1) The annual average temperature and summer precipitation data from Hebei Meteorological Service; 2) The wetland water area, average water level, and shallow groundwater depth data from Anxin County Water Conservancy Bureau; 3) The overall assessment of water quality, permanganate index, chemical oxygen demand, ammonia nitrogen, total phosphorus, and mean composite pollution index data from our field survey; 4) The relevant social and economic data from Hebei Economic Yearbook (2011‒2018) and the National Economic and Social Development Statistical Bulletin of Baoding City in 2010-2017. All of the data for the 23 indicators must be examined by the parameter correlation analysis (Wang et al., 2008) before the fuzzy evaluation calculation. Based on the entropy weight values, the data for 20 indicators are determined to participate in the computation of the final fuzzy comprehensive evaluation index. The land use data is provided by the Data Center for Resources and Environmental Sciences, Chinese Academy of Sciences (RESDC) (http://www.resdc.cn).

3 Results and discussion

3.1 Indicator weight

The weight of each evaluation indicator has been calculated by substituting the evaluation indicator data into formula (4) and formula (5) to obtain the weight matrix W (Table 2).
Table 2 Indicator weights for the ecological vulnerability assessment
Indicator Number Weight
Annual average temperature c1 0.0444
Total precipitation in summer c2 0.0432
Wetland water area c3 0.0508
Average water level c4 0.0441
Shallow groundwater depth c5 0.0429
Overall assessment of water quality c6 0.0442
Permanganate index c7 0.0465
Chemical oxygen demand c8 0.0433
Ammonia nitrogen c9 0.0489
Total phosphorus c10 0.0475
Mean composite pollution index c11 0.0397
Inland water breeding area c12 0.0429
Agricultural chemical fertilizer consumption c13 0.0430
Water consumption of industrial enterprises above a designated size c14 0.0411
Energy consumption of industrial enterprises above a designated size c15 0.0383
Total energy consumption c16 0.0440
Sulfur dioxide emission c17 0.0311
Industrial smoke and dust emission c18 0.0546
Rate of industrial solid wastes disposed c19 0.0473
Rate of industrial solid wastes comprehensively utilized c20 0.0465
Energy consumption per unit industrial value added c21 0.0331
Energy consumption per unit GDP c22 0.0354
GDP per capita c23 0.0471

3.2 Analysis of the indicator weights

Among multiple weighting methods for the ecological and environmental vulnerability assessment, the entropy weight method, which determines the weight of each indicator based on the amount of information provided by the observation values of the evaluation indicator, is currently considered to be the most objective weighting method (Zhao et al., 2018). For the wetland ecological vulnerability assessment, we used the entropy method to calculate the weight for each evaluation indicator. By comparing the entropy weight results, we found that the weight values of the evaluation indicators c18, c3, c9, c10, c19 and c23 were larger than the others, and the corresponding evaluation indicators were: industrial smoke and dust emission, wetland water area, ammonia nitrogen, total phosphorus, rate of industrial solid wastes disposed, and GDP per capita, respectively. The study showed that the first two indicators, industrial smoke and dust emission and wetland water area, both have weight values above 0.05 and contribute the most to the ecological vulnerability of the BYD wetlands in this period. These two are followed by ammonia nitrogen and total phosphorus content of water body, rate of industrial solid wastes disposed, and GDP per capita, each of which has a weight value of above 0.047. These indicators are considered to be the factors that have a greater impact on the ecological vulnerability of the Baiyangdian wetlands. They are all from social cause except for the wetland water area, which is a natural factor yet is regulated to a certain extent by human activities because of the upstream diversion and downstream gate control. The pollution of air, water and the natural environment will not only cause declining environmental quality, but also make the wetland ecology more fragile. On the contrary, a high-quality regional environment is bound to improve the wetland ecological situation. Therefore, the wetland ecological vulnerability is closely related to regional environmental conditions, and it is an indicator of regional environment quality. In other words, regulation of the wetland ecological vulnerability is a systematic project.

3.3 Fuzzy comprehensive evaluation index

After substitution of the evaluation indicator data into the fuzzy relation matrix R, using formula (6) to combine it with the weight matrix W by the composite operator, the fuzzy comprehensive evaluation index matrix V is obtained. According to the principle of maximum membership degree in the fuzzy set, the grade corresponding to the maximum value by the calculation of V is the final evaluation grade in the fuzzy comprehensive evaluation, which means the vulnerability grade. The membership degrees to Grade I- Grade V of the fuzzy comprehensive evaluation are shown in Table 3.
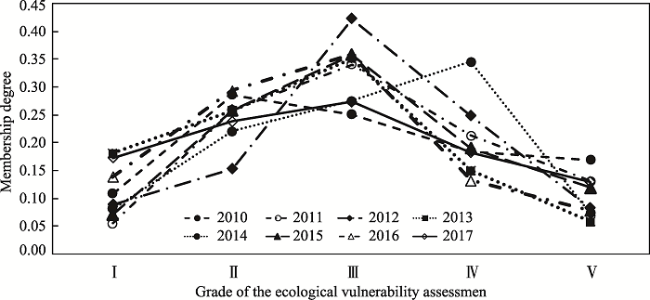
Table 3 Membership degrees to the five grades of the fuzzy comprehensive evaluation
Year
2010 0.11 0.29 0.25 0.18 0.17
2011 0.06 0.26 0.34 0.21 0.13
2012 0.09 0.15 0.42 0.25 0.08
2013 0.18 0.26 0.35 0.15 0.06
2014 0.08 0.22 0.28 0.35 0.07
2015 0.07 0.26 0.36 0.19 0.12
2016 0.14 0.29 0.36 0.13 0.08
2017 0.17 0.24 0.27 0.18 0.13

3.4 Assessment of the ecological vulnerability for the BYD wetlands

The distributions of the membership degrees to the five grades of the ecological vulnerability assessment for the BYD wetlands in the eight evaluated years are shown in Fig. 2. The higher the value, the bigger the membership degree to a certain grade. The results showed that the membership degrees of the BYD wetlands to Grade Ⅱ were higher than the other grades in 2010; during 2011-2013, the membership degree to Grade Ⅱ declined gradually, and that to Grade Ⅲ increased; in 2014, the membership degree to Grade Ⅳ increased obviously; and from 2015 to 2017, the membership degree to Grade Ⅳ significantly decreased, while that to Grade Ⅲ increased, which showed a measurable improvement of the ecological situation of the BYD wetlands during the years of 2015, 2016 and 2017. From a comprehensive analysis of the evaluation results above, the ecological vulnerability of the BYD wetlands was assessed as low fragility in 2010, general fragility in 2011-2013, and high fragility in 2014, which turned back into general fragility in the period of 2015-2017. The vulnerability grades for the periods of 2010, 2011-2013, 2014, and 2015-2017 were evaluated as Grade Ⅱ, Grade Ⅲ, Grade Ⅳ, and Grade Ⅲ, respectively.
Fig. 2 Grades of the ecological vulnerability assessment for the BYD wetlands in 2010-2017

3.5 Effect of intervening measures on the ecological vulnerability of the BYD wetlands

Many causes exist for the changes in ecological vulnerability of the BYD wetlands in this period, which can be summarized into two aspects. The first is the change in regional environmental quality. The ecological degradation and declining environmental quality in the Beijing-Tianjin-Hebei region has led the government and the public to pay more attention to natural conservation and environmental protection. A series of policies and strategies have been implemented, yet the improvement of environmental quality still objectively needs a process. Second, concrete intervening measures, such as water replenishment and pollution control, were taken to improve the ecological status and environmental quality of the BYD wetlands. For example, during the period from 2006 to 2010, the diversion of the Yellow River to the BYD wetlands occurred a total of four times, with a total amount of water replenishment of 4×10⁸ m3, effectively improving the ecological situation of the BYD wetlands. However, the flood of Daqing River in July 2012 not only increased the amount of water resources, but also brought in pollutants (sewage, garbage, etc.) from along the waterways. At the same time, the diversion of the Yellow River to send replenishing water into the wetlands was cancelled. Thus, the BYD wetlands reached the grade of high fragility in 2014. In 2015, 3.3×10⁷ m3 of water was transferred from the Xidayang Reservoir. In addition, the environmental pollution in the Beijing-Tianjin-Hebei region was briefly contained due to some administrative interventions and environmental protection strategies, which may also be an important reason for the significant improvement in the ecological condition of the BYD wetlands since 2015. However, owing to the regional environmental problems which have not been effectively solved, the overall ecological status of the BYD wetlands is relatively less optimistic.

4 Conclusions and prospects

It is commonly accepted that ecological vulnerability is on the rise due to massive urbanization, industrialization, and unwise utilization of natural resources around the world. By selecting the most representative indicators from natural, social, sci-tech, and economic elements, an evaluation indicator system was constructed. The indicator weights were determined using the entropy weight method, the membership degrees were calculated based on a fuzzy evaluation model, and the ecological vulnerability assessment of the BYD wetlands during 2010-2017 was finally accomplished. This study showed that, 1) The grade of the ecological vulnerability of the BYD wetlands was comprehensively evaluated as Grade Ⅱ, Grade Ⅲ, Grade IV, and Grade Ⅲ in 2010, 2011-2013, 2014, and 2015-2017, respectively; 2) The ecological vulnerability of the BYD wetlands increased from low fragility in 2010, to general fragility in 2011-2013, to high fragility in 2014, and then decreased to general fragility in 2015-2017; 3) From 2010 to 2017, the major factors influencing the ecological vulnerability of the BYD wetlands were industrial smoke and dust emission, wetland water area, ammonia nitrogen, total phosphorus, rate of industrial solid wastes disposed, and GDP per capita, etc. The results of this study illustrate that it is a systematic project to regulate wetland vulnerability and to protect regional ecological security.
However, there are still some defects and deficiencies which need to be improved in future studies, since the ecological vulnerability assessment remains quite broad and our study represents only a preliminary stage. Although it has proven to be suitable for the vulnerability assessment of the BYD wetlands, our model seems to have two main weaknesses: 1) As mentioned above, this vulnerability assessment does not include the biological indicators and other indicators which should be quantified and input into the evaluation model, such as the people’s awareness of ecological conservation or environmental protection. 2) Additional factors exist, such as the complexity of the wetland ecosystem, the uncertainty of the influences of natural, human and their coupled system, and the objective existence of adaptive, feedback and negative feedback regulation mechanisms of the ecological system, which caused fluctuations in some of the factors in the model, and affected the accuracy of the evaluation results to a certain extent. These are issues that need to be further studied in the future. Nevertheless, this model has proven to be effective initially, and needs to be tested and improved by more case studies until new models are created. In summary, ecological vulnerability is not easily quantifiable, yet further research on ecological vulnerability as well as risk assessments are essential and imperative, especially in the context of global change and rapid regional growth. The construction of an indicator system and the choice of an appropriate evaluation method may be the two critical steps in the process of quantitative vulnerability assessment. Both of these steps should follow the principle of objectivity to avoid being influenced by the subjective judgments of the evaluators.
[1]
Beroya-Eitner M A. 2016. Ecological vulnerability indicators. Ecological Indicators, 60: 329-334.

DOI

[2]
de Lange H J, Sala S, Vighi M, et al. 2010. Ecological vulnerability in risk assessment—A review and perspectives. Science of the Total Environment, 408(18): 3871-3879.

DOI

[3]
Ge Q S, Yang L S, Jin F J, et al. 2017. Carrying capacity of resource and environment of Xiongan New Area: Evaluation, regulation, and promotion. Bulletin of Chinese Academy of Sciences, 32(11): 1206-1215. (in Chinese)

[4]
Jiang L G, Lv P Y, Feng Z M, et al. 2018. Where should the start zone be located for Xiongan New Area? A land use perspective. Journal of Resources and Ecology, 9(4): 374-381.

DOI

[5]
Jin Y, Meng J J. 2011. Assessment and forecast of ecological vulnerability: A review. Chinese Journal of Ecology, 30(11): 2646-2652. (in Chinese)

[6]
Li B Y, Chen H B, Tang H P. 2010. Assessing ecological fragility with AHP and fuzzy integrated evaluation in autonomous prefectures of northern Xinjiang. Journal of Beijing Normal University (Natural Science), 46(2): 197-201. (in Chinese)

[7]
Liu D, Cao C X, Dubovyk O, et al. 2017. Using fuzzy analytic hierarchy process for spatio-temporal analysis of eco-environmental vulnerability change during 1990-2010 in Sanjiangyuan region, China. Ecological Indicators, 73: 612-625.

DOI

[8]
Liu H H, Wang N, Xie J C, et al. 2014. Assessment of ecological vulnerability based on fuzzy comprehensive evaluation in Weihe River Basin. Journal of Shenyang Agricultural University, 45(1): 73-77. (in Chinese)

[9]
Liu J G, Zhao D D, Ye B. 2019. Ecological attributes, restoration, and protection of the Baiyangdian in Xiong’an New Area. Acta Ecologica Sinica, 39(9): 3019-3025. (in Chinese)

[10]
Malekmohammadi B, Jahanishakib F. 2017. Vulnerability assessment of wetland landscape ecosystem services using driver-pressure-state- impact-response (DPSIR) model. Ecological Indicators, 82: 293-303.

DOI

[11]
Shang E P, Bai W Q. 2012. A review on the studies of wetland vulnerability assessment. Wetland Science, 10(3): 378-384. (in Chinese)

[12]
Tian Y P, Chang H. 2012. Bibliometric analysis of research progress on ecological vulnerability in China. Acta Geographica Sinica, 67(11): 1515-1525. (in Chinese)

[13]
Wang G, Shi Y H. 2019. Bibliometric analysis of international ecological vulnerability research situation. Environmental Impact Assessment, 41(2): 80-84. (in Chinese)

[14]
Wang J H, Lu X G, Jiang M, et al. 2009. Fuzzy synthetic evaluation of wetland soil quality degradation: A case study on the Sanjiang Plain, Northeast China. Pedosphere, 19(6): 756-764.

DOI

[15]
Wang J H, Lu X G, Tian J H, et al. 2008. Fuzzy synthetic evaluation of water quality of Naoli River using parameter correlation analysis. Chinese Geographical Science, 18(4): 361-368.

DOI

[16]
Wang Y J, Zhong L F. 2020. Research framework for ecosystem vulnerability: Measurement, prediction, and risk assessment. Journal of Resources and Ecology, 11(5): 499-507.

DOI

[17]
Xia J, Zhang Y Y. 2017. Water resource and pollution safeguard for Xiong’an new area construction and its sustainable development. Bulletin of Chinese Academy of Sciences, 32(11): 1199-1205. (in Chinese)

[18]
Yi Y J, Yang Y F, Zhang S H, et al. 2019. Habitat simulation of benthic macroinvertebrates in a shallow lake. Water Resources and Hydropower Engineering, 50(5): 90-96. (in Chinese)

[19]
Yu K J. 2018. Three comprehensive and innovative strategies to solve the water problems in Xiongan New District. Landscape Architecture Frontiers, 6(4): 4-12. (in Chinese)

[20]
Yuan M R, Zhuge Y P, Liu R. 2011. Fuzzy evaluation of Tai’an ecological vulnerability based on AHP. Environmental Science & Technology, 34(2): 173-177. (in Chinese)

DOI

[21]
Zhang S Z, Ma J, Li G B. 2007. The ecological problems and sustainable development countermeasures of the Baiyangdian Wetland. South-to- North Water Transfers and Water Science & Technology, (4): 53-56. (in Chinese)

[22]
Zhao J C, Ji G X, Tian Y, et al. 2018. Environmental vulnerability assessment for mainland China based on entropy method. Ecological Indicators, 91: 410-422.

DOI

[23]
Zhuang C W, Ouyang Z Y, Xu W H, et al. 2011. Impacts of human activities on the hydrology of Baiyangdian Lake, China. Environmental Earth Sciences, 62(7): 1343-1350.

DOI

[24]
Zou Z H, Yun Y, Sun J N. 2006. Entropy method for determination of weight of evaluating indicators in fuzzy synthetic evaluation for water quality assessment. Journal of Environmental Sciences, 18(5): 1020-1023.

DOI

Outlines

/