Regional Geography and Ecological Changes

Developing Regional Ecological Networks along the Grand Canal based on an Integrated Analysis Framework

  • XU Chuangsheng , 1 ,
  • CHENG Long 2 ,
  • SU Jie 2 ,
  • YIN Haiwei , 2, * ,
  • GUO Yiqiang 3
Expand
  • 1. Department of Territorial Spatial Ecological Restoration, Ministry of Natural Resources of the People’s Republic of China, Beijing 100035, China
  • 2. School of Architecture and Urban Planning, Nanjing University, Nanjing 210093, China
  • 3. Land Consolidation and Rehabilitation Center, Ministry of Natural Resources of the People’s Republic of China, Beijing 100035, China
*YIN Haiwei, E-mail:

XU Chuangshen, E-mail:

Received date: 2020-11-03

  Accepted date: 2021-02-24

  Online published: 2021-11-26

Supported by

The National Natural Science Foundation of China(51478217)

Abstract

As a complex social ecosystem network, the area along the Grand Canal has a prominent contradiction between the demand for economic development and the protection of natural resources, which means that there is an urgent need for ecological restoration and environmental protection. Using ArcGIS, Conefor, Linkage Mapper and other software platforms, this paper developed an integrated analysis framework, through loose coupling of the attribute-function-structure index system and a series of methods such as the least cost path, circuit theory and moving window search. Based on the framework, we resolve a series of scientific issues in developing regional ecological networks, such as the selection of ecological sources, the simulation of potential ecological corridors, the assessment of the importance of ecological sources and corridors, and the identification of key ecological nodes. Moreover, an overall conservation pattern of the regional ecological network is constructed. The results show that: 1) A total of 88 important ecological sources are identified in the study area. The patches with high centrality values are mainly concentrated in the southern mountainous area and the areas with abundant rivers and lakes. 2) A total of 138 important ecological corridors are identified, and they are not evenly distributed. Extremely important corridors mostly appear between important patches, and very important corridors are mainly distributed in the central area. 3) Fifteen ecological pinch points are extracted, and they are mainly concentrated in the northern part of the study area and eastern Zhejiang Province. The barriers are mostly concentrated in the southern and northern parts of the study area. 4) Combining the demands of ecological protection and socioeconomic development, we propose an overall ecological conservation pattern of “one axis, five sections, multiple cores and multiple nodes” to effectively guide future ecological restoration work. These results can provide a useful reference and spatial guidance for decision makers in terms of ecological restoration and cooperation on cross-regional ecological protection along the Grand Canal.

Cite this article

XU Chuangsheng , CHENG Long , SU Jie , YIN Haiwei , GUO Yiqiang . Developing Regional Ecological Networks along the Grand Canal based on an Integrated Analysis Framework[J]. Journal of Resources and Ecology, 2021 , 12(6) : 801 -813 . DOI: 10.5814/j.issn.1674-764x.2021.06.008

1 Introduction

Rapid urbanization has caused frequent ecological problems, such as the fragmentation of regional habitat patches, the reduction of biodiversity, and the serious occupancy of ecological space, which restrict the capacity of the ecosystem to provide services and undermine the sustainable development of urban and rural areas (Yin et al., 2011; Liu et al., 2018).
Ecological networks (ENs) can connect fragmented habitat patches with ecological sources and ecological corridors in an area to increase the richness of urban natural ecological landscapes, protect regional and urban biodiversity, and effectively improve the service quality of the ecological space (Bennett, 1990). ENs have been widely used in territorial and spatial planning, urban and rural planning, ecological planning and other fields, and they are a hot topic of research both in China and in other countries (Braaker et al., 2014; Xu et al., 2015; Shan et al., 2019).
At present, there are four main methods for constructing ecological networks: The layer-cake model (Yu, 1996), the least cost path (LCP) method combined with the gravity model or graph theory (Urban and Keitt, 2001; Pullinger and Johnson, 2010), the morphological spatial pattern analysis (MSPA) method (Vogt et al., 2009; Xu et al., 2015), and the circuit theory (CT) method (McRae, 2006; McRae and Beier, 2007; Ayram et al., 2014; Song and Qin, 2016; Liu et al., 2018; Fei et al., 2020). The LCP method constructs resistance surfaces for the habitat suitability of different species through land use types and terrains, and it uses GIS to simulate potential ecological corridors, making it possible to determine the locations and patterns of ecological corridors in a scientific manner (Liu et al., 2018). However, this method cannot precisely identify a width of the corridor or its relative importance. The MSPA method recognizes the spatial patterns of raster images based on mathematical morphology principles such as corrosion, expansion, and closed operations, and it divides a region into seven landscape types, including core areas and island patches, through image processing methods. This method, however, ignores the spatial heterogeneity of the landscape, and calculates the connection distance between nodes only by the Euclidean distance (Shan et al., 2019). The CT method simulates the movement or dispersal of organisms or genes in the landscape by analogy with electrons randomly walking in a circuit. It predicts the movement of organisms, and identifies the widths of ecological corridors and their key nodes (McRae, 2006; Song and Qin, 2016). CT-based calculation requires less data, has a simple process, and integrates the structural and functional corridors between habitat patches, to construct ecological networks more accurately. When there are insufficient migration data on the target species, CT can predict the multiple possibilities of species migration (McRae and Beier, 2007; Ayram et al., 2014; Braaker et al., 2014), and identify multiple potential paths between sources, becoming a major theory and method for ecological corridor design (Sutton-Grier et al., 2015; Shan et al., 2019). However, most ecological network construction studies rely on a single method of technical analysis and studies that integrate the above technical methods are still limited.
After establishing the ecological network pattern, determining the spatial priority of patches and corridors becomes very important for the protection and management of the network. At present, scholars in China and other countries mostly use spatial syntax (Wei et al., 2019), the landscape pattern index (Foltête et al., 2012), centrality (Carroll et al., 2012) or other methods to determine the spatial priority for the protection of ecological patches and corridors. Spatial syntax compares the flow of living things in an ecological network with the behavior of humans in urban space and evaluates the priority by identifying the axis system of the study area. The processed axis system, however, is an abstract connectivity mode with limited consideration for the differences in suitability among habitats. The landscape pattern index estimates the probability of biological diffusion between two habitat nodes based on the attributes of the patch, distance threshold and probability threshold, and it calculates the structural importance of the patch in the ecological network connection. The landscape pattern index, however, only considers the interaction of a single pair of source-target nodes, and it ignores the interactions of all sources in maintain the entire ecological network. Based on the analysis results of the LCP of CT, centrality analysis regards each least cost path as a circuit and each source as a node. It traverses all pairs of source regions and adds the accumulated current values generated by them to obtain the centrality values of the sources and corridors (Carroll et al., 2012). This method requires less data, the process is simple, and the interaction between all nodes and the target nodes has been considered. The centrality analysis has become a major method for identifying the protection priority of patches and corridors in the construction of the ecological network pattern.
The Grand Canal is a major project in China, connecting the north and the south of the country as well as ancient history and modern times. It is not only an important landscape belt and valuable heritage, but also a complex ecosystem network closely related to human survival and development (Yu et al., 2004; Yang et al., 2014). Although the Grand Canal is currently facing problems such as insufficient overall protection, the degradation and shrinkage of rivers and lakes, and the increasing risk of environmental pollution, the quality of the ecological environment along the Grand Canal has improved in recent years, and its ecological service functions have been enhanced, laying a foundation for people to gain access to high-quality ecological products. In this study, 34 prefecture-level cities along the Grand Canal are used as the research area. According to the technical process and framework for constructing the ecological network pattern, we develop an integrated analysis SCSAI framework, including selecting ecological sources based on the attribute-function-structure (AFS) index system; constructing the landscape resistance surface based on the multivariate data; simulating ecological corridors based on the LCP method; assessing the importance of ecological sources and corridors based on the Centrality Mapper tool and identifying key ecological nodes based on the CT and moving window search method (MWS). Based on the SCSAI framework, we resolve a series of scientific issues in the developing regional ecological networks along the Grand Canal, such as the selection of ecological sources, the simulation of potential ecological corridors, the assessment of the importance of ecological sources and corridors, and the identification of key ecological nodes. Moreover, an overall conservation pattern of the regional ecological network is constructed. This study can not only provide a useful reference and spatial guidance for decision makers to comprehensively improve the ecological service functions of important ecological spatial patterns, but it can also scientifically guide ecological restoration and cooperation on cross-regional ecological protection in areas along the Grand Canal.

2 Data and methods

2.1 Study area

We select 34 prefecture-level cities along the Grand Canal as the study area (Fig. 1a), which has a total area of approximately 3.084×10⁵ km2. The study area represents the intersection of the gradual expansion of the culture of the Grand Canal and the integration of regional culture. We use a GIS raster data statistics tool to analyze the areas and the proportions of different types of land use, and the results are as follows. The dominant land use type is farmland, which accounts for approximately 61.42% of the total study area. The second most dominant type is forestland, accounting for approximately 15.83%. Forestland generally forms a pattern of being “largely dispersed and occasionally concentrated”, and is mainly distributed in the hilly and mountainous areas of northern Zhejiang Province, the northern mountainous areas of Beijing and parts of Luoyang City, Henan Province. Impervious surfaces (mainly including urban and rural construction land and road networks) account for 14.28% of the total study area. Water bodies mainly consist of lakes, reservoirs, and river networks, and account for approximately 5.67%. The river and water system network in the southern part of the study area is crisscrossed with lakes and reservoirs, providing a basis for the blue ecological spatial pattern and blue corridor planning in the study area (Fig. 1b, Table 1).
Table 1 Land use type statistics
Land use type Area (km2) Proportion of area (%)
Farmlands 189454.14 61.42
Forests 48827.56 15.83
Shrubs 6000.32 1.95
Grasslands 1501.59 0.49
Wetlands 427.03 0.14
Water 17492.50 5.67
Impervious surfaces 44043.02 14.28
Bare land 691.94 0.22
Total 308438.10 100.00
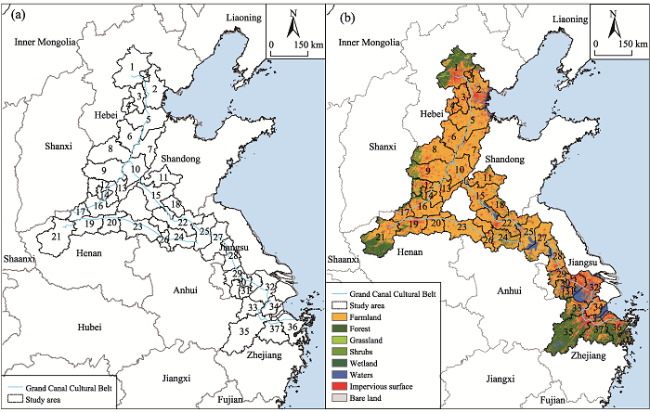
Fig. 1 Map of the study area (a) and land use and land cover (b)

Note: City code:1. Beijing; 2. Tianjn; 3. Langfang; 4. Xiong’an New District; 5. Cangzhou; 6. Hengshui; 7. Dezhou; 8. Xingtai; 9. Handan; 10. Liaocheng; 11. Tai’an; 12. Anyang; 13. Puyang; 14. Hebi; 15. Jining; 16. Xinxiang; 17. Jiaozuo; 18. Zaozhuang; 19. Zhengzhou; 20. Kaifeng; 21. Luoyang; 22. Xuzhou; 23. Shangqiu; 24. Suzhou (Anhui); 25. Suqian; 26. Huaibei; 27. Huai’an; 28. Yangzhou; 29. Zhenjiang; 30. Changzhou; 31. Wuxi; 32. Suzhou (Jiangsu); 33. Huzhou; 34. Jiaxing; 35. Hangzhou; 36. Ningbo; 37. Shaoxing.

The cities along the Grand Canal are endowed with rich cultural heritage resources, valuable canal navigation functions, and favorable regional development conditions. Meanwhile, they are densely populated areas and important economic zones in China, which inevitably leads to conflicts between the demand of socioeconomic development and the protection of natural resources. Thus, there is an increasingly urgent need to implement ecological restoration and strengthen environmental protection in these areas.

2.2 Data sources and preprocessing

The main data used in this study include a 30 m land cover dataset of the study area for 2017 (data source: National Science and Technology Infrastructure—National Earth System Science Data Center, http://www.geodata.cn), a high-resolution remote sensing satellite image (spatial resolution 2.0 m), a digital elevation model (data source: http://www.resdc.cn/data.aspx?DATAID=99), No.1 Luojia night-time light data for 2018 (Source: http://59.175.109.173:8888/index.html), the China City Statistical Yearbook 2019 and other related map data and materials. First, these data were converted to the WGS_1984_UTM_Zone_50N projected coordinate system. Second, all data were subsequently clipped to the study area, and resampled to obtain 100 m×100 m raster data.

2.3 Methods

Based on multisource data (such as land use, night-time light data (NLD), and the digital elevation model (DEM)), through loose coupling of the attribute-function-structure (AFS) index system, and a series of methods (such as the LCP, CT and the MWS methods), we develop an integrated analysis framework (SCSAI) to determine the overall conservation pattern of the regional ecological network along the Grand Canal (Fig. 2). The specific process is explained in detail in the following sections.
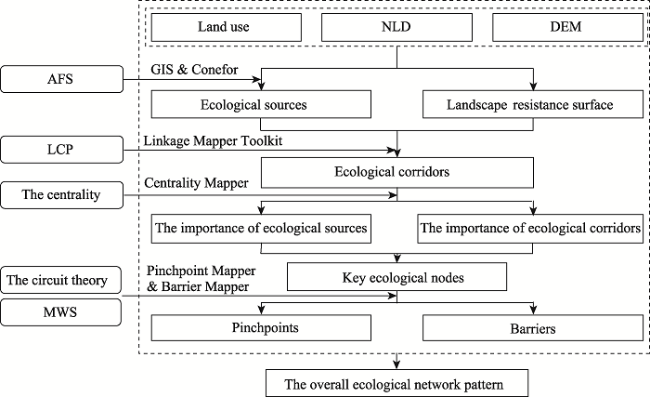
Fig. 2 SCSAI ecological network research framework

Note: AFS = “Attribution-function-structure” index system; LCP = Least cost path method; MWS = Moving windows search method; NLD = Night-time light data; DEM = Digital elevation model.

2.3.1 Selecting ecological sources based on the AFS index system

Ecological sources are habitat patches that play decisive roles in regional ecological processes and functions (McRae and Beier, 2007). Therefore, scientifically selecting the ecological sources is very important to the development of ecological networks. First, we select the ‘patch area’ to represent the ‘attribute’, the ‘ecosystem service value’ to represent the ‘function’, and the ‘landscape connectivity index’ (the integrated index of connectivity (dIIC) and probability of connectivity (dPC)) to represent the ‘structure’. Then, we construct the attribute-function-structure (AFS) index system (Zhu et al., 2020). Second, we calculate the annual ecological service value of each ecological patch (including five land use types: Woodlands, grasslands, shrubs, wetlands and water) based on the table of ecological service values per unit area of the Chinese ecosystem (Xie et al., 2015). Patches with ecological service values greater than 100 million RMB are selected as potential ecological patches. Third, we calculate the dIIC and dPC indices based on Conefor sensinode 2.6 software with 5000 m and 0.5 as the connectivity distance and probability threshold, respectively (Vogt et al., 2009; Wei et al., 2019; Zhu et al., 2020). Finally, these four indices are standardized by the range standardization method and combined with equal weights (0.25) using the GIS overlay operation to yield a habitat suitability map. Ecological patches with habitat suitability values in the top 20% are extracted as ecological sources in this study (Fig. 3a, Table 2).
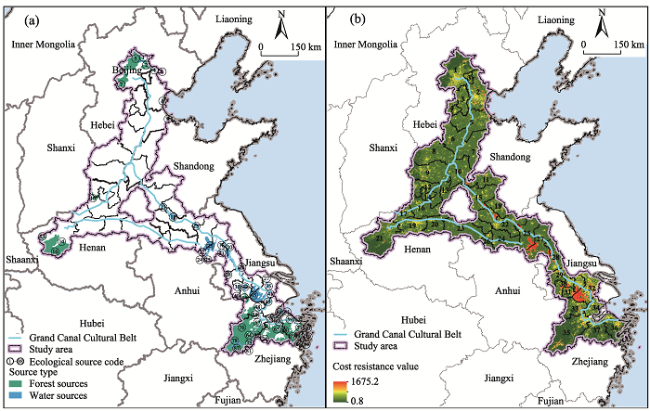
Fig. 3 Spatial distributions of ecological sources (a) and landscape resistance (b) Major water source code:

Miyun Reservoir;. Yuqiao Miyun Reservoir;. Guangang Wetland Park;. Nandagang Wetland Park;. Dushan Lake;. Weihan Lake;. Luhun Reservoir;. Luoma Lake;. Baima Lake;. Baoying Lake;. Nvshan Lake;. Hongze Lake;. Qili Lake;. Gaoyou Lake;. Changdang Lake;. Ge Lake;. Yangchenghu Lake;. Yangchenghu West Lake;. Jilin Lake;. Chenghu Lake;. Taihu Lake;. Duihekou Reservoir;. Didang Lake;. The mouth of Jiaxing;. Qiandao Lake;. Qiantang River. Same below.

Table 2 Habitat suitability and landscape resistance assignment scheme in the study area
Land use types Factor Classification Resistance value
Farmlands - - 150
Forests Area <10 ha 20
≥10 ha 1
Grasslands - - 50
Shrubs - - 40
Wetlands - - 1
Water Area <10 ha 20
10-100 ha 200
≥100 ha 1000
Construction land - - 600
Bare land - - 500

2.3.2 Constructing the landscape resistance surface based on multivariate data

A potential ecological network is determined by the quality of the sources or targets, and the landscape resistance of different land use types between the sources and targets (Kong et al., 2009). Topography, the intensity of human disturbance, etc. play important roles in the migration of species and the construction of landscape resistance surfaces (Matthews et al., 1988). However, most previous studies on landscape resistance surface construction were based only on land use types (Klar et al., 2012; Koen et al., 2012), and the effects of topography and human activity intensity on biological migration were not fully considered. Night-time light data (NLD) can represent the intensity and spatial distribution of human activities. In this study, based on the multisource data, including land use data, NLD, and the DEM (Equation 1), we construct the basic landscape resistance surface based on land use types (Table 2) and then combine normalized night-time light data (Equation 2) and the slope (Equation 3) to modify the basic landscape resistance to yield the final surface (Fig. 3b).
${{R}_{\text{final}}}={{R}_{i}}\times {{a}_{\text{light}}}\times {{a}_{\text{slope}}}$
where Rfinal is the modified grid resistance value, Ri is the resistance value of grid i, alight is the average light index of grid i, and aslope is the topographic slope coefficient.
${{a}_{\text{light}}}=1+\frac{TL{{L}_{i}}}{TL{{L}_{a}}}$
where TLLi is the average light index of grid i, and TLLa is the average light index of the study area.
${{a}_{\text{slope}}}=1+a\times {{S}_{i}}$
where Si refers to the percentage slope of grid i, and a is the resistance value coefficient of slope, which is 1 in this study.

2.3.3 Simulating ecological corridors based on the LCP method

The LCP method can simulate potential ecological corridors by calculating the cumulative resistance value based on the landscape resistance surface (McRae and Kavanagh, 2011), and this method is widely used in simulating species migration (Kong and Yin, 2008; Xu et al., 2015). In this study, we simulate potential ecological corridors (i.e., the least cumulative resistance cost path), based on the Linkage Mapper Toolkit in the ArcGIS software platform, and we use a 20,000 weighted cost distance as the potential ecological corridor width threshold (Fig. 4).

2.3.4 Assessing the importance of ecological sources and corridors based on the Centrality Mapper

The Centrality Mapper can assess all possible paths among the ecological sources in the study area, and obtain the ranking of the contribution that each source or corridor makes to maintain the connectivity of the entire ecological network. Specifically, we treat each least cost path as a circuit and each source as a node, take the weighted cost distance of each corridor as a resistance and assign it to each circuit. Then, we pair the ecological patches (sources and corridors), assign a current of 1 ampere to one patch, and ground the other patch to obtain the value of the current between the pair of patches. Based on the Centrality Mapper module in the Linkage Mapper Toolkit, we traverse all patch pairs, and calculate the accumulated current values to yield the final centrality value (i.e., the relative importance) of each patch (source or corridor) (McRae et al., 2008; Carroll et al., 2012; Fox et al., 2019) (Fig. 4).
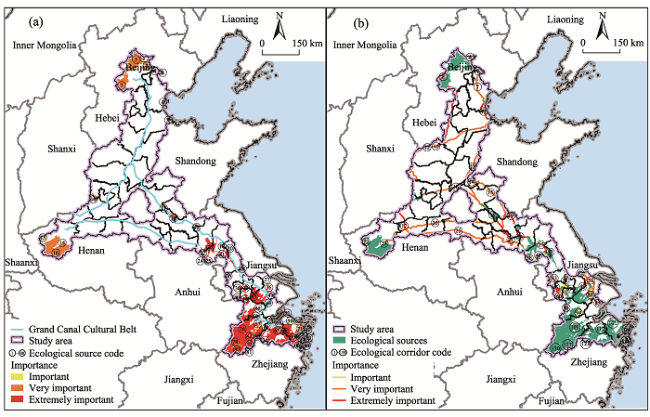
Fig. 4 Spatial distributions of the importance of ecological sources (a) and corridors (b)

2.3.5 Identifying key ecological nodes based on CT and the MWS Method

CT simulates the migration and dispersal of individual species or genes in the landscape by referring to the characteristics of electrons randomly walking in a circuit. It predicts the migration routes of species and identifies the widths of ecological corridors and their key ecological nodes. Ecological nodes, also known as “stepping stones/springboards”, are critical nodes connecting adjacent “sources” (McRae et al., 2012), which play key roles in the migration or dispersal of species in the landscape. They mainly include ecological pinch points and barriers.
An ecological pinch point refers to a bottleneck point in an ecological corridor, and it is a dense region of species migration (i.e., with high current density), which has an important structural function for the connectivity of the regional ecological network. Using the Pinchpoint Mapper module in the Linkage Mapper Toolbox, the ‘all to one’ mode is selected to iterate the calculation, and the 20000 weighted cost distance is set as the corridor width threshold. Then, the current density is divided into four categories based on the natural break point method, and the category with the highest current density is extracted as the ecological pinch point (Zhu et al., 2020) (Fig. 5a).
Barriers refer to regions that act as huge obstacles to the migration of organisms between sources, leading to tortuous paths of species dispersal and increasing the movement time and possible risks to the species. Their restoration can greatly enhance connectivity and reduce the resistance of ecological processes. Through the MWS method in the Barrier Mapper module, we identify all the barriers in the study area by selecting the “Maximum” mode, the search range size of 1000 m to 5000 m, and a 2000-m moving window (Liu et al., 2018) (Fig. 5b).
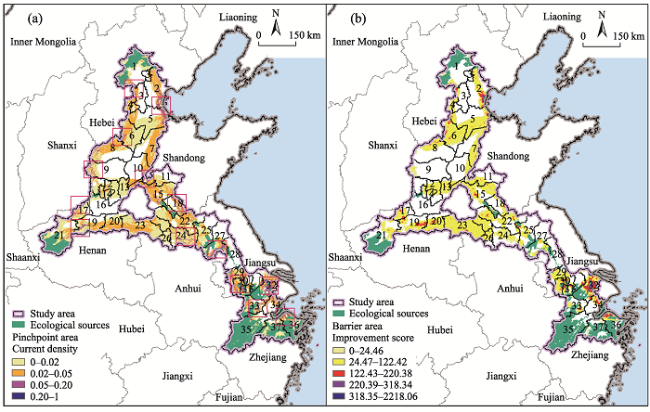
Fig. 5 Spatial distribution of ecological pinch points (a) and ecological barriers (b) in the study area

2.3.6 Developing the overall ecological conservation

Based on the identification results of important ecological entities (sources and corridors), and by comprehensively considering China’s national regional development strategies, the ecological environment background of the region along the Grand Canal, and the foundation of socioeconomic development, we construct the overall ecological conservation pattern along the Grand Canal and clarify the key areas that need to be renovated and restored (Fig. 6).
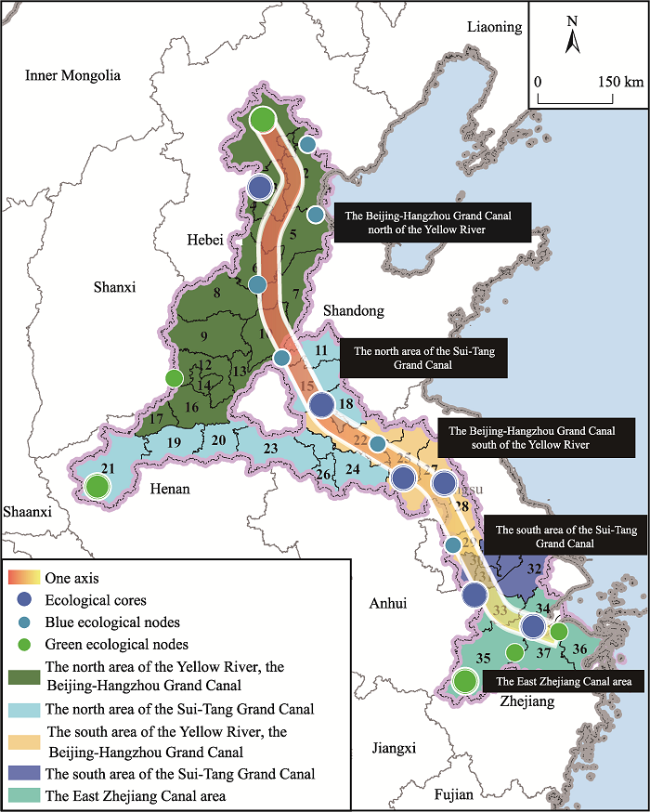
Fig. 6 The overall ecological network pattern of the region along the Grand Canal

3 Results

3.1 Spatial distribution of ecological sources and landscape resistance

A total of 88 important ecological sources were selected in the study area, with the area of each ranging from 3.1 km2 to 8106 km2, and covering a total area of 44044.03 km2. Among them are 32 forestland sources, mainly including the northern mountainous area of Beijing, the western mountainous area of Hebei, the eastern mountainous area of Zhejiang, the southern mountainous area of Luoyang, and important wetland parks and national forest parks, with a total area of 34157.87 km2. There are a total of 56 water sources, mainly distributed in the southern area, with a total area of 9886.16 km2 (Fig. 3a).
The top 10 cities in terms of the number of ecological sources are Ningbo (19), Hangzhou (15), Shaoxing (11), Suzhou (Jiangsu) (11), Huai’an (10), Huzhou (8), Wuxi (8), Changzhou (7), Beijing (6), and Tianjin (4) (Table 3). These cities are mainly located in the southern and northern parts of the study area, because the northern and southern regions have relatively abundant landscape resources with high forest coverage. The quantity and quality of the selected ecological sources exert great impacts on the protection of the regional ecological environment and biodiversity (Vogt et al., 2009). However, the forests are not evenly distributed, and face intense interference from rapid urbanization, showing a trend of habitat patch fragmentation. Therefore, the integrity of large woodlands, large lakes, nature reserves, forest parks, wetland parks, and other important habitat patches in the study area should be strictly protected. These results can provide practical implications for cooperation on cross- regional ecological protection.
Table 3 The number of ecological sources in each city
City Number of
ecological sources
City Number of
ecological sources
Ningbo 19 Luoyang 3
Hangzhou 15 Xuzhou 3
Shaoxing 11 Jining 2
Suzhou (Jiangsu) 11 Jiaxing 2
Huai’an 10 Suqian 2
Huzhou 8 Zhenjiang 2
Wuxi 8 Anyang 1
Changzhou 7 Cangzhou 1
Beijing 6 Hebi 1
Tianjin 4 Xinxiang 1
Yangzhou 4 Zaozhuang 1
Natural conditions and human activities have great impacts on the suitability of habitat and the value of landscape resistance. The value of landscape resistance is used as an index to quantitatively assess the suitability of habitat. The lower the value of landscape resistance is, the better the suitability of habitat and the lower the resistance to the migration of animals. The landscape resistance values throughout the study area are between 0.8 and 1675.2, with an average value of 215, indicating that habitat suitability is not good and ecological restoration is urgently needed. The regions with high resistance values are mainly concentrated in large lakes and urban and rural construction land. Because the farmlands in the study area account for 61% of the total study area, moderate resistance values are widely distributed throughout the region (Fig. 3b).

3.2 Assessment of the importance of ecological sources and corridors

According to the Centrality Mapper, which is used to determine the importance of sources, the average centrality value of habitat patches is 378.87, and the maximum value is 1968.45. The high-value areas are mainly concentrated in the southern mountainous area of the Grand Canal study area, the surrounding area of Taihu Lake and part of the central river network. The southern mountainous area and the surrounding areas of Taihu Lake play an irreplaceable role in the entire ecological network. They not only have a large number of large-area patches, but also have high density patches, and the connections are tight as well. Small patches serve as important stepping stones between large source patches. The less important source patches are mainly located in the northern and central regions. Since agricultural land is the dominant land use type in the northern and central areas, the number of habitat patches is small, and there are insufficient stepping stone patches for species migration. This situation results in a low probability of connection with other patches within the range. As a result, the patches play a less important role in the entire study area (Fig. 4a).
A total of 138 important ecological corridors were identified in the study area, with lengths ranging from 1 km to 837 km, a total length of 7621.73 km and a coverage area of 31219.97 km2. The southern part of the study area has dense ecological corridors and good landscape connectivity, mainly because there are many large habitat patches in the southern region, the distribution density is high, the resistance to biological migration is small, and the ecological corridors are wide, forming a closely connected circular ecological network. There are large vacant corridors in the central and northern parts, mainly due to the lack of habitat patches that function as stepping stones in these areas. Therefore, the distances between patches are too great to form effective connections (Fig. 4b).
Through the centrality analysis of corridors, the spatial distribution of extremely important corridors is similar to that of the source patches, and most of them appear between important patches. The very important corridors are mainly distributed in the center of the study area. The number of patches is relatively small, the number of corridors is small, the distances between corridors are great, and the ecological corridors are poorly developed, having low centrality and importance. According to the statistical analysis of the number of ecological corridors in the study area, the top 10 cities in the terms of number of ecological corridors are Suzhou (Jiangsu) (62), Changzhou (30), Wuxi (25), Hangzhou (21), Ningbo (15), Huai’an (14), Cangzhou (11), Jining (9), Shaoxing (9), and Zaozhuang (9) (Table 4). Among them, more than 10 of the extremely important ecological corridors are covered by Suzhou (Jiangsu), Wuxi, Changzhou, and Ningbo. Therefore, it is necessary to actively promote the protection and construction of municipal-scale ecological corridors.
Table 4 Statistics on the importance levels of the urban ecological corridors by city
City Important Very important Extremely important Subtotal City Important Very important Extremely important Subtotal
Anyang 2 1 0 3 Ningbo 3 1 11 15
Beijing 3 4 0 7 Puyang 1 0 0 1
Cangzhou 8 3 0 11 Shangqiu 2 0 0 2
Changzhou 6 13 11 30 Shaoxing 0 6 3 9
Dezhou 3 0 0 3 Suzhou (Jiangsu) 45 3 14 62
Handan 1 1 0 2 Tai’an 6 0 0 6
Hangzhou 5 8 8 21 Tianjin 4 3 0 7
Hebi 1 0 0 1 Wuxi 9 3 13 25
Hengshui 1 1 0 2 Xinxiang 0 1 0 1
Huzhou 0 1 6 7 Xingtai 2 2 0 4
Huai’an 4 6 4 14 Xiong’an New District 0 2 0 2
Huaibei 1 0 0 1 Suqian 2 2 0 4
Jining 7 2 0 9 Suzhou (Anhui) 5 3 0 8
Jiaxing 2 1 2 5 Xuzhou 4 4 0 8
Jiaozuo 0 1 0 1 Yangzhou 0 2 0 2
Kaifeng 2 0 0 2 Zaozhuang 6 3 0 9
Langfang 1 1 0 2 Zhenjiang 0 5 0 5
Liaocheng 4 0 0 4 Zhengzhou 5 3 0 8
Luoyang 2 1 2 5 Total 147 87 74 308
Important ecological corridors help connect patches in the landscape and maintain the continuity of nature, and they are temporary and permanent habitats and migration channels for many species (Dennis et al., 2004). Therefore, we should actively construct important ecological corridors at the regional scale, delimit the protection scope of the important ecological corridors of the Grand Canal, strengthen the overall structure of the ecological network, and create a blue and green regional ecological network system. We should cultivate the “important” corridors and potential corridors containing ecological pinch points to provide better possibilities for biological migration and dispersal. Additionally, we should strengthen the “very important” corridors, and add “stepping stone” patches to barrier areas and areas that are prone to fractures along some long corridors to improve the connections between patches. We should also maintain “extremely important” ecological corridors, strictly control the construction intensity and development mode of land within the protection scope of ecological corridors, reduce ecological pressure, ensure that the artificial environment minimizes damage to the natural ecology and optimize the regional and urban ecological structure.

3.3 Identification of ecological pinch points and barriers

A total of 15 ecological pinch points were extracted in the study area and their corresponding land uses were mainly small green spaces, urban parks, and farmland. Most key pinch points are distributed in ecological corridors, mainly in areas north of the Yellow River and eastern Zhejiang. There are few ecological sources in the north of the Yellow River, where the ecological corridors have a large cost distance, meaning that species dispersal is restricted. Ecological sources 8-12 are in the central part of the study area, which means that surrounding species have a high probability of migration. The close distances between some source patches in the eastern Zhejiang area lead to a high probability of dispersal and a high current density, thus these source patches become key ecological nodes (Fig. 5a). For high-density areas with ecological pinch points, we should control the internal disturbance of human activities to large-scale sources, enrich the structure of vegetation communities, and improve the habitat area and quality of small patches. It is necessary to control and guide planning, and reserve the potential development space of ecological corridors, especially land that has significant cutting and blocking effects on ecological corridors, such as construction land and transportation land.
The maximum improvement value of barriers in the study area is 2218.06 m. Compared with the pre-improvement situation, the least cost path can be reduced by up to 2218.06 m, indicating that the study area has great potential for improvement. Most barriers are concentrated in the southern area of the Sui-Tang Grand Canal, and some others are concentrated in the northern part of the study area. There are many barriers located in different corridors that need to be improved. Most of the barrier areas that are concentrated are densely populated and important economic areas in China (Fig. 5b). For areas with high-density barriers, construction land is the dominant land use type. Achieving ecological restoration without changing the land use type is a key issue that should be considered. For construction land, the current environment should be renovated, and ecological restoration measures such as greenery should be implemented. For increasing green coverage, the development of roof greening and vertical greening can be encouraged to increase the rate of green space within the area. For road barriers, corresponding wildlife passages, such as underground passages, tunnels and overpasses, should be established to minimize the obstruction caused by this type of land use with regard to the corridor.

3.4 Construction of the overall ecological network pattern

According to the Planning Outline for the Protection, Inheritance and Utilization of the Grand Canal Cultural Belt (hereinafter referred to as the “Outline”), the overall spatial layout of the Grand Canal has proposed the concept of “a river as a line, a city as a bead, stringing beads with lines, and beads forming a surface”. Based on the ecological network analysis results above, we can integrate the position features and administrative divisions of the Grand Canal, land use pattern, water system characteristics, river status, ecological background and basic conditions of socioeconomic development along the line, and build an overall ecological network pattern of “one axis, five sections, multiple cores and multiple nodes” (Fig. 6).
One axis: With the Beijing-Hangzhou Grand Canal and the East Zhejiang Canal as the backbone (including the connection between Baiyangdian in the Xiong’an New District, Hebei and the Grand Canal), this ecological axis connects the major development areas of Belt and Road construction, the Beijing-Tianjin-Hebei coordinated development area, the development area of the Yangtze River Delta Economic Belt and the five major areas of the Grand Canal Cultural Belt. At the same time, the axis connects the important ecological sources and ecological corridors in this study area.
Five sections: The five sections include the north area of the Yellow River of the Beijing-Hangzhou Grand Canal, the south area of the Yellow River of the Beijing-Hangzhou Grand Canal, the northern area of the Sui-Tang Grand Canal, the southern area of the Sui-Tang Grand Canal, and the East Zhejiang Canal area delineated by the “Outline”. Among them, the area north of the Yellow River of the Beijing-Hangzhou Grand Canal should emphasize land greening, the construction of riverside greenways and the treatment of water pollution in key river sections. The area south of the Beijing-Hangzhou Grand Canal should emphasize the construction of key riverside greenways and the treatment of water pollution in key river sections. The Hebei area should emphasize the waterfront ecological spatial pattern and greenway construction as well as the protection, monitoring and early warning system of important lakes. The Sui and Tang Grand Canal southern area and the Zhejiang East Canal area should emphasize the construction of the waterfront ecological spatial pattern and riverfront greenways.
Multiple cores: Important lakes (clusters) (Taihu Lake, Gaoyou Lake, Hongze Lake, Luoma Lake, Nansi Lake, etc.) along the Grand Canal are taken as the blue core of the ecological spatial pattern, forming an overall ecological pattern of “one axis connected to multiple cores”.
Multiple nodes: The intersection of the Grand Canal and major rivers and the main green ecosystems are taken as important ecological nodes. The blue ecological nodes mainly include the Miyun Reservoir, Changdang Lake, Ge Lake, Qiandao Lake, Dongping Lake, Weishan Lake, Jinji Lake, Chenghu Lake, Dianshan Lake, etc. and the green ecological nodes mainly include the mountainous areas in northern Beijing, the mountainous areas in western Hebei, the mountainous areas in eastern Zhejiang, the mountainous areas in southern Luoyang, and important wetland parks and national forest parks.

4 Discussion

The concept of ecological security has to do with ensuring the safety, health and sustainable development of resources, the environment and ecosystem services by strengthening the ecological process and seeking ways to guarantee ecological security (Chetkiewicz et al., 2006; Damschen et al., 2006). The ecological security pattern based on the ecological network has gradually become an important basis for guiding regional biodiversity protection and ecological space restoration and for improving ecological resilience (Liu and Chang, 2015; Correa Ayram et al., 2016; Peng et al., 2017). It is also a spatial allocation scheme for systematically optimizing the ecological spatial layout and improving the integrity and structural connectivity of the ecosystem (Vallecillo et al., 2018). Under the complex and fragile ecological pattern of the region along the Grand Canal, due to the rapid urban and rural construction activities that have taken place in a short period of time the fragile regional ecological environment faces huge challenges, such as the long-term overexploitation of water resources, biological habitat fragmentation, wetland degradation and atrophy and other ecological environmental problems. This paper characterizes the regional ecological network along the Grand Canal, which holds great and far-reaching significance for maintaining the integrity and health of the overall ecological process at the regional scale and promoting the regional sustainable development. It is possible to avoid the destruction of the regional ecological system as a result of ignoring the natural and biological processes during the rapid urbanization and the rural construction boom. In the “one axis connected to multiple cores” ecological security network in this study, the ecological corridor takes the Grand Canal as the axis. It is an important corridor connecting the mountainous areas of North China and the hilly areas of East China as well as an important area for the seasonal migration of various species, and where many lakes along the canal are important nodes of the ecological process. At the same time, the small green space, urban parks, farmlands and low-strength activity areas in the ecological network of the Grand Canal constitute potential corridors with a high probability, indicating that the corridor network has low quality and faces the risk of being blocked. Some high-intensity urban construction and land surface hardening in the corridors in the southern region hinder the ecological process in the network, and restoring these areas is an important task for consolidating the ecological security of the Grand Canal.
Ecological and environmental protection in the region along the Grand Canal requires multiple strategic measures, such as optimizing ecological sources, protecting ecological corridors, and restoring ecological pinch points and barriers, to improve the ecological networks and ecosystems in a systematic and integrated manner. Recognizing the priority of the ecological sources and corridors in the ecological network pattern is one of the basic paths to achieving cross-regional ecological restoration and environmental protection (Dennis et al., 2004). Based on multiple technical methods, this paper constructs a technical framework for ecological network integration analysis (SCSAI), scientifically identifies the ecological network pattern of the area along the Grand Canal, and evaluates the spatial priority of ecological patches and corridors, which is conducive to the protection and management of regional ecological security in a phased manner.
Transregional and multiscale ecological networks are the core content of ecological security pattern construction. However, most existing research results are problematic, for example, featuring unclear policies and power boundaries; thus, those results provide limited guidance for ecological protection practices. The construction of ecological security patterns holds great significance for solving multilevel ecological security problems (Peng et al., 2017). Taking administrative districts as the analysis objects is a convenient approach in terms of data acquisition and is also conducive to policy makers protecting the ecological network of different administrative districts and obtaining financial support from local governments. Based on the results on the identification of ecological sources and corridors, combined with administrative divisions, this paper provides a reference for the practice of ecological network protection in various cities and regions. However, the development of ecological networks and ecological security patterns is not entirely controlled by administrative boundaries, and the natural geographical environment and ecosystem services that determine the ecological security pattern based on administrative boundaries need to be considered with a more natural geographical scope. Future research can consider overcoming the restrictions imposed by administrative boundaries based on analyzing the ecological system from a greater range of natural geographical space.
The ecological spatial pattern of the Grand Canal is a complex social ecological system network with rich cultural heritage resources, continuous canal functions, and a high level of regional development. It meets people’s multifunctional demands for economic development, recreation and leisure, history and culture. In this research we constructed the overall pattern of the ecological network of the Grand Canal only from the ecological perspective of species migration: economic value, tourism value, historical value and other functions were not considered. In further research, it will be necessary to combine key natural and human resources to build a regional composite ecological network from the perspective of balancing ecological environmental protection, cultural heritage tourism, and green infrastructure services.

5 Conclusions

The region along the Grand Canal is an important economic zone in China. With economic growth, the explosion in population, rapid urban expansion, and the construction of various urban infrastructures, the ecological environment along the Grand Canal is facing increasing challenges. Thus, ecological restoration and environmental protection in this region are urgently needed. Through the loose coupling of the attribution-function-structure index system, this study constructed a comprehensive analysis framework (SCSAI) to solve a series of scientific problems in the development of the Beijing-Hangzhou Grand Canal regional ecological network.
The main conclusions are as follows: 1) A total of 88 important ecological sources are identified in the study area, and Ningbo has the largest number of ecological sources. The patches with high centrality values are mainly concentrated in the southern mountainous area and the areas with abundant rivers and lakes. 2) A total of 138 important ecological corridors are identified, however these corridors are not evenly distributed. The ecological corridors in the south are dense and well connected (Suzhou (Jiangsu) has the largest number of ecological corridors), while the corridors in the northern and central areas have many gaps. Extremely important corridors mostly appear between important patches, and very important corridors are mainly distributed in the central area. 3) A total of 15 ecological pinch points are extracted, and they are mainly concentrated in the northern part of the study area and eastern Zhejiang Province. The barriers that need ecological restoration are mostly concentrated in the southern and northern parts of the study area. 4) Combining the demands of ecological protection and socioeconomic development, we propose an overall ecological conservation pattern of “one axis, five sections, multiple cores and multiple nodes” to effectively guide future ecological restoration work along the Grand Canal. These results can provide a useful reference and spatial guidance for decision makers in terms of ecological restoration and cooperation on cross-regional ecological protection in areas along the Grand Canal.
[1]
Ayram C A C, Mendoza M E, Salicrup D R P, et al. 2014. Identifying potential conservation areas in the Cuitzeo Lake basin, Mexico by multitemporal analysis of landscape connectivity. Journal for Nature Conservation, 22(5): 424-435.

DOI

[2]
Bennett A F. 1990. Habitat corridors and the conservation of small mammals in a fragmented forest environment. Landscape Ecology, 4(2-3): 109-122.

[3]
Braaker S, Moretti M, Boesch R, et al. 2014. Assessing habitat connectivity for ground-dwelling animals in an urban environment. Ecological Applications, 24(7): 1583-1595.

[4]
Carroll C, McRae B H, Brookes A. 2012. Use of linkage mapping and centrality analysis across habitat gradients to conserve connectivity of gray wolf populations in western North America. Conservation Biology, 26(1): 78-87.

DOI PMID

[5]
Chetkiewicz C L B, St Clair C C, Boyce M S. 2006. Corridors for conservation: Integrating pattern and process. Annual Review of Ecology, Evolution, and Systematics, 37(1): 317-342.

[6]
Correa Ayram C A, Mendoza M E, Etter A, et al. 2016. Habitat connectivity in biodiversity conservation: A review of recent studies and applications. Progress in Physical Geography: Earth and Environment, 40(1): 7-37.

[7]
Damschen E I, Haddad N M, Orrock J L, et al. 2006. Corridors increase plant species richness at large scales. Science, 313(5791): 1284-1286.

PMID

[8]
Dan L, Qing C. 2015. Ecological security research progress in China. Acta Ecologica Sinica, 35(5): 111-121.

[9]
Dennis P, Fahrig L, Hobbs R, et al. 2004. Ecological networks and greenways:Concept, design, implementation. Cambridge, UK: Cambridge University Press.

[10]
Fei F, Yin H W, Kong F H, et al. 2020. Comparative analysis of ecological network pattern using 2d and 3d information in main urban area of nanjing, China. Acta Ecologica Sinica, 40(16): 5534-5545. (in Chinese)

[11]
Foltête J C, Clauzel C, Vuidel G. 2012. A software tool dedicated to the modelling of landscape networks. Environmental Modelling & Software, 38: 316-327.

[12]
Fox A D, Corne D W, Adame C G M, et al. 2019. An efficient multi-objective optimization method for use in the design of marine protected area networks. Frontiers in Marine Science, 6: 17. DOI: 10.3389/fmars.2019.00017.

DOI

[13]
Klar N, Herrmann M, Henning-Hahn M, et al. 2012. Between ecological theory and planning practice: (Re-) Connecting forest patches for the wildcat in Lower Saxony, Germany. Landscape and Urban Planning, 105(4): 376-384.

[14]
Koen E L, Bowman J, Walpole A A. 2012. The effect of cost surface parameterization on landscape resistance estimates. Molecular Ecology Resources, 12(4): 686-696.

[15]
Kong F H, Yin H W, Nakagoshi N, et al. 2010. Urban green space network development for biodiversity conservation: Identification based on graph theory and gravity modeling. Landscape and Urban Planning, 95(1-2): 16-27.

DOI

[16]
Kong F H, Yin H W. 2008. Developing green space ecological networks in Jinan City. Acta Ecologica Sinica, 28(4): 1711-1719. (in Chinese)

[17]
Liu J, Yin H W, Kong F H, et al. 2018. Structure optimization of circuit theory-based green infrastructure in Nanjing, China. Acta Ecologica Sinica, 38(12): 4363-4372. (in Chinese)

[18]
Matthews M J, O’Connor S, Cole R S. 1988. Database for the New York State urban wildlife habitat inventory. Landscape and Urban Planning, 15(1-2): 23-37.

[19]
McRae B H. 2006. Isolation by resistance. Evolution, 60(8): 1551-1561.

PMID

[20]
McRae B H, Beier P. 2007. Circuit theory predicts gene flow in plant and animal populations. Proceedings of the National Academy of Sciences of the USA, 104(50): 19885-19890.

[21]
McRae B H, Dickson B G, Keitt T H, et al. 2008. Using circuit theory to model connectivity in ecology, evolution, and conservation. Ecology, 89(10): 2712-2724.

PMID

[22]
McRae B H, Hall S A, Beier P, et al. 2012. Where to restore ecological connectivity? Detecting barriers and quantifying restoration benefits. Plos One, 7(12): e52604. DOI: 10.1371/journal.pone.0052604.

DOI

[23]
McRae B H, Kavanagh D M. 2011. Linkage mapper connectivity analysis software. Seattle, Washington, USA: The Nature Conservancy. Available at: http://www.circuitscape.org/linkagemapper.

[24]
Peng J, Zhao H J, Liu Y X, et al. 2017. Research progress and prospect on regional ecological security pattern construction. Geographical Research, 36(3): 407-419. (in Chinese)

[25]
Pullinger M G, Johnson C J. 2010. Maintaining or restoring connectivity of modified landscapes: Evaluating the least-cost path model with multiple sources of ecological information. Landscape Ecology, 25(10): 1547-1560.

[26]
Shan N, Zhou K X, Pan Y, et al. 2019. Research advances in design methods of biodiversity conservation corridors. Acta Ecologica Sinica, 39(2): 411-420. (in Chinese)

DOI

[27]
Song L L, Qin M Z. 2016. Identification of ecological corridors and its importance by integrating circuit theory. Chinese Journal of Applied Ecology, 27(10): 3344-3352. (in Chinese)

DOI PMID

[28]
Sutton-Grier A E, Wowk K, Bamford H. 2015. Future of our coasts: The potential for natural and hybrid infrastructure to enhance the resilience of our coastal communities, economies and ecosystems. Environmental Science & Policy, 51: 137-148.

[29]
Urban D, Keitt T. 2001. Landscape connectivity: A graph-theoretic perspective. Ecology, 82(5): 1205-1218.

[30]
Vallecillo S, Polce C, Barbosa A, et al. 2018. Spatial alternatives for Green Infrastructure planning across the EU: An ecosystem service perspective. Landscape and Urban Planning, 174: 41-54.

[31]
Vogt P, Ferrari J R, Lookingbill T R, et al. 2009. Mapping functional connectivity. Ecological Indicators, 9(1): 64-71.

DOI

[32]
Wei J X, Song Y, Wang Y C, et al. 2019. Urban green infrastructure building for sustainability in areas of rapid urbanization based on evaluating spatial priority: A case study of Pukou in China. Acta Ecologica Sinica, 39(4): 1178-1188. (in Chinese)

[33]
Xie G D, Zhang C X, Zhang L M, et al. 2015. Improvement of the evaluation method for ecosystem service value based on per unit area. Journal of Natural Resources, 30(8): 1243-1254. (in Chinese)

[34]
Xu F, Yin H W, Kong F H, et al. 2015. Developing ecological networks based on MSPA and the least-cost path method: A case study in Bazhong western new district. Acta Ecologica Sinica, 35(19): 6425-6434. (in Chinese)

[35]
Yang J, Zhang J C, Wu Y X, et al. 2014. Evolution of ecological environment in typical regions along the Beijing-Hangzhou Grand Canal. Beijing, China: Publishing House of Electronics Industry. (in Chinese)

[36]
Yin H W, Kong F H, Qi Y, et al. 2011. Developing and optimizing ecological networks in urban agglomeration of Hunan Province, China. Acta Ecologica Sinica, 31(10): 2863-2874. (in Chinese)

[37]
Yu K J, Li D H, Li W. 2004. The Great Canal regional ecological infrastructure: Strategy and approaches. Progress in Geography, 23(1): 1-12. (in Chinese)

[38]
Yu K J. 1996. Security patterns and surface model in landscape ecological planning. Landscape and Urban Planning, 36(1): 1-17.

[39]
Zhu J, Su J, Yin H W, et al. 2020. Construction of Xuzhou ecological network based on comprehensive sources identification and multi- scale nesting. Journal of Natural Resources, 35(8): 1986-2001. (in Chinese)

DOI

Outlines

/