
Journal of Resources and Ecology >
Trade-off and Synergy Relationships of Ecosystem Services and Driving Force Analysis based on Land Cover Change in Altay Prefecture
|
LIU Hao, E-mail: liu.hao@craes.org.cn |
Received date: 2021-02-14
Accepted date: 2021-05-06
Online published: 2021-11-26
Supported by
The National Natural Science Foundation of China(41871196)
The Scientific Research Project in Altay Prefecture, Xinjiang Uygur Autonomous Region of China(2019-529)
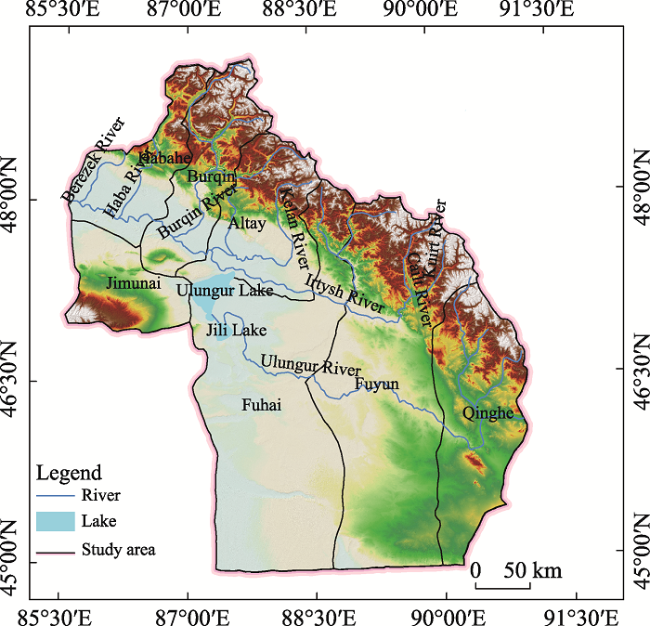
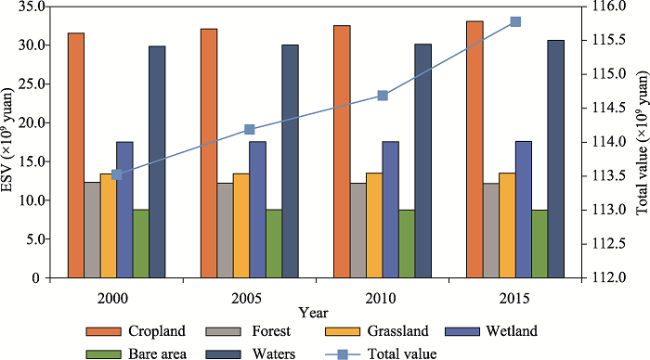
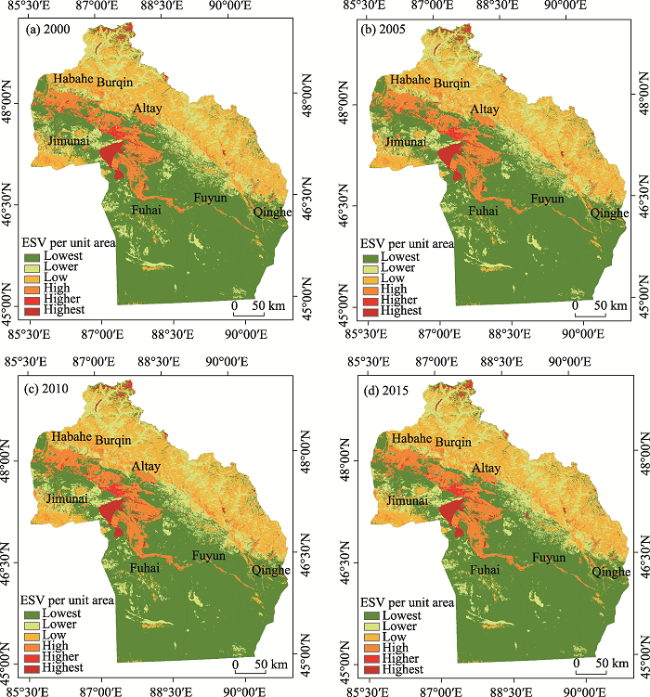
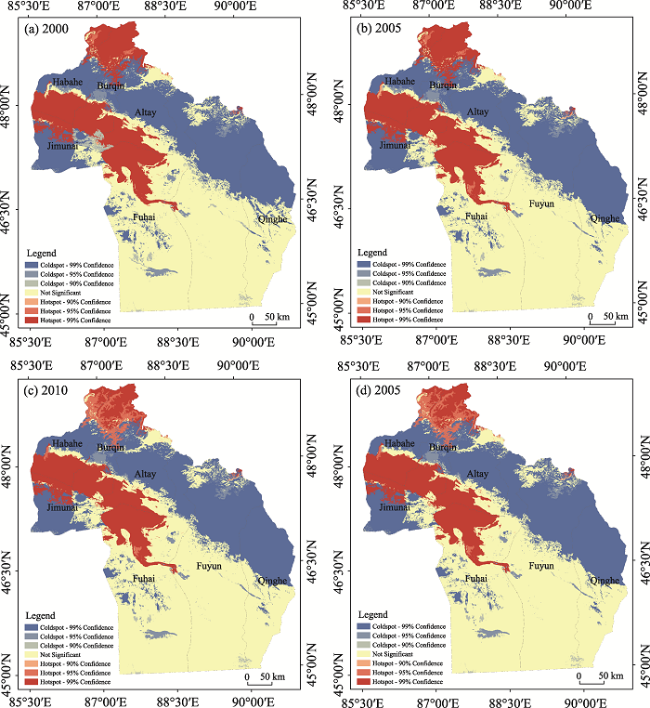
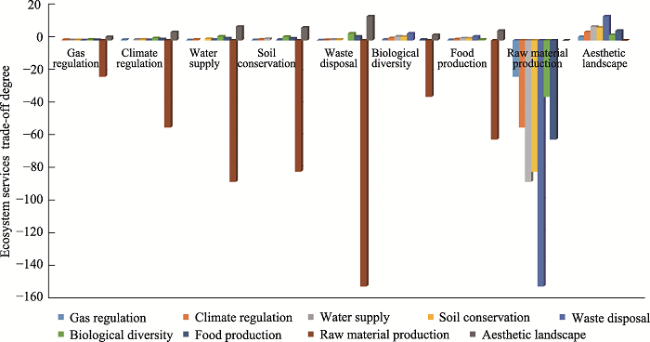
Altay Prefecture plays a vital role as an ecological barrier in Northwest China. Studying the ecosystem service value is of great significance for promoting regional green high-quality development and maintaining ecological security. Based on Global ESA land cover data from 2000 to 2015, the trade-off and synergy relationships and driving force factors between ecosystem services in Altay Prefecture were analyzed in this study. The analysis produced four main results. (1) The ecosystem service value in Altay Prefecture continued to increase from 113.521Ⅹ109 yuan in 2000 to 115.777Ⅹ109 yuan in 2015, for an increase of about 1.98%. (2) The distribution of ecosystem service value had obvious spatial agglomeration characteristics, with hot spot areas mainly concentrated in the "two rivers and one lake" and the mountainous areas in the northwest, while the cold spot areas were mainly the forest and grass-covered areas in the northern mountainous areas and within Jimunai County. (3) The trade-off and synergy relationship among ecosystem services was mainly synergistic, with a total of 77.78% of ecosystem service relative relationships showing a significant positive correlation at the 0.01 level. (4) Economic factors and industrial structure are important factors affecting ecosystem service value in Altay Prefecture. Ecosystem service value is positively correlated with per capita GDP and the output value of the tertiary industry, but negatively correlated with the output value of the secondary industry.
LIU Hao , SHU Chang , ZHOU Tingting , LIU Peng . Trade-off and Synergy Relationships of Ecosystem Services and Driving Force Analysis based on Land Cover Change in Altay Prefecture[J]. Journal of Resources and Ecology, 2021 , 12(6) : 777 -790 . DOI: 10.5814/j.issn.1674-764x.2021.06.006
Fig. 1 Location and basic features of Altay Prefecture |
Table 1 Coefficients of ESV per unit area in Altay Prefecture(Unit: yuan ha-1 yr-1) |
| Land use types | Regulating services | Supporting services | Provisioning services | Cultural services | Total | |||||
|---|---|---|---|---|---|---|---|---|---|---|
| Gas regulation | Climate regulation | Water supply | Soil conservation | Waste disposal | Biological diversity | Food production | Raw material production | Aesthetic landscape | ||
| Cropland | 2231.26 | 3971.64 | 2677.51 | 6515.27 | 7318.52 | 3168.39 | 4462.52 | 446.25 | 44.63 | 30835.98 |
| Forest | 1073.05 | 827.78 | 981.07 | 1195.68 | 401.63 | 999.47 | 30.66 | 797.12 | 392.43 | 6698.88 |
| Grassland | 599.54 | 674.49 | 599.54 | 1461.39 | 981.75 | 816.88 | 224.83 | 37.47 | 29.98 | 5425.87 |
| Wetland | 6131.70 | 58251.15 | 52800.75 | 5825.12 | 61930.17 | 8516.25 | 1021.95 | 238.46 | 18906.08 | 213621.62 |
| Bare areas | 0 | 0 | 102.20 | 68.13 | 34.07 | 1158.21 | 34.07 | 0 | 34.07 | 1430.73 |
| Water | 0 | 1566.99 | 69424.47 | 34.07 | 61930.17 | 8482.19 | 340.65 | 34.07 | 14784.21 | 156596.81 |
Table 2 Driving force factors of ESV’s change |
| Driving factors | Influence factors |
|---|---|
| Population factors | Total population (X1), urban population (X2), population density (X3), natural growth rate of population (X4), urbanization rate (X5) |
| Economic factors | Gross domestic product (X6), per capita GDP (X7), the output value of primary industry (X8), the output value of secondary industry (X9), the output value of tertiary industry (X10), the gross Industrial Value (X11), government revenue (X12), average annual salary of employees (X13), per capita income of rural households (X14) |
| Industrial structure factors | The proportion of primary industry (X15), the proportion of secondary industry (X16), the proportion of tertiary industry (X17) |
| Tourism factors | Number of domestic visitors (X18), tourism earnings (X19) |
| Agricultural factors | Crop yields (X20), number of livestock (X21), the proportion of gross agricultural value (X22), the proportion of gross forestry value (X23), the proportion of gross pastoral value (X24), the proportion of gross fishery value (X25) |
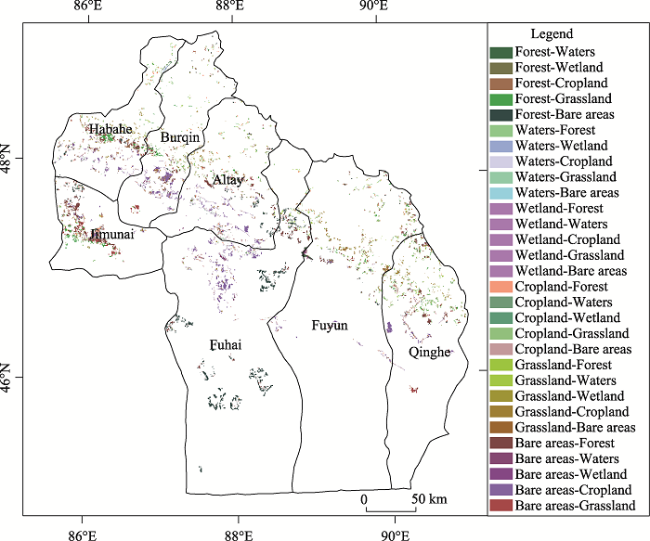
Fig. 2 Spatial variation of land use in Altay Prefecture from 2000 to 2015 |
Table 3 Land use transition matrix in Altay Prefecture from 2000 to 2015 (Unit: km2) |
| 2015 | 2000 | ||||||
|---|---|---|---|---|---|---|---|
| Grassland | Bare areas | Cropland | Forest | Wetland | Water | Sum | |
| Grassland | 24076.05 | 212.13 | 109.75 | 167.38 | 0.11 | 0.96 | 24566.38 |
| Bare areas | 49.53 | 60669.84 | 83.79 | 414.46 | 1.40 | 0.67 | 61219.67 |
| Cropland | 183.30 | 440.71 | 9934.19 | 128.13 | 5.71 | 1.88 | 10693.93 |
| Forest | 82.77 | 346.15 | 63.76 | 17591.30 | 1.68 | 4.10 | 18089.75 |
| Wetland | 0.20 | 1.05 | 4.21 | 3.06 | 802.25 | 3.86 | 814.62 |
| Water | 1.61 | 39.08 | 1.34 | 19.63 | 0.01 | 1884.45 | 1946.12 |
| Sum | 24393.45 | 61708.96 | 10197.05 | 18323.95 | 811.16 | 1895.91 | 117332.50 |
Fig. 3 ESVs of different land use types in Altay Prefecture from 2000 to 2015 |
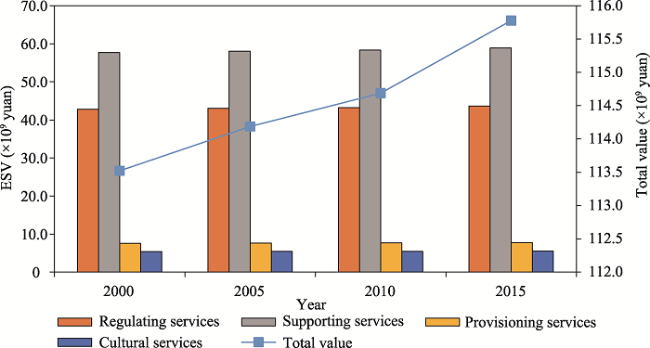
Fig. 4 ESVs of various ecosystem services in Altay Prefecture from 2000 to 2015 |
Fig. 5 The temporal and spatial distribution of ESV in Altay Prefecture from 2000 to 2015 |
Fig. 6 The cold and hot spot map of ESV in Altay Prefecture from 2000 to 2015 |
Table 4 Correlations between different ecosystem services in Altay Prefecture |
| Pearson correlation | Regulating services | Supporting services | Provisioning services | Cultural services | ||||||
|---|---|---|---|---|---|---|---|---|---|---|
| Gas regulation | Climate regulation | Water supply | Soil conservation | Waste disposal | Biological diversity | Food production | Raw material production | Aesthetic landscape | ||
| Regulating services | Gas regulation | 1 | 0.993** | 0.962** | 0.994** | 0.980** | 0.980** | 0.988** | 0.506* | 0.932** |
| Climate regulation | 1 | 0.967** | 0.996** | 0.986** | 0.991** | 0.994** | 0.441 | 0.936** | ||
| Water supply | 1 | 0.962** | 0.995** | 0.984** | 0.961** | 0.451 | 0.992** | |||
| Supporting services | Soil conservation | 1 | 0.984** | 0.989** | 0.998** | 0.414 | 0.924** | |||
| Waste disposal | 1 | 0.996** | 0.984** | 0.421 | 0.974** | |||||
| Biological diversity | 1 | 0.993** | 0.403 | 0.957** | ||||||
| Provisioning services | Food production | 1 | 0.382 | 0.921** | ||||||
| Raw material production | 1 | 0.502* | ||||||||
| Cultural services | Aesthetic landscape | 1 | ||||||||
Note:* means significance at P<0.05 level (both sides); **means significance at P<0.01 level (both sides). |
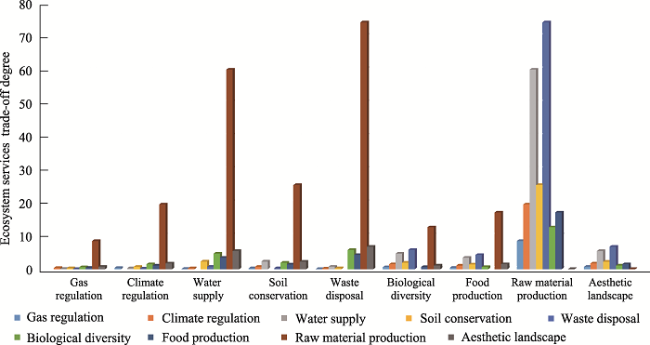
Fig. 7 Trade-off and synergy relationships between different ecosystem services from 2000 to 2005 |
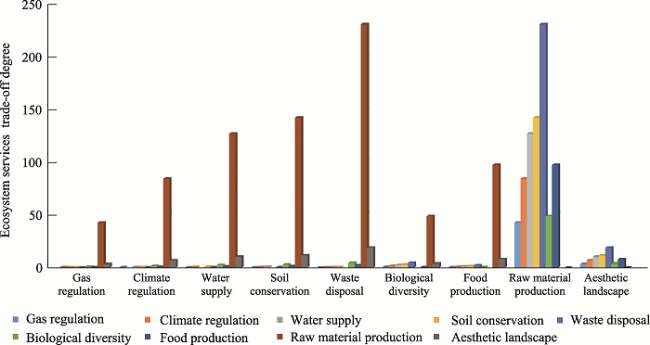
Fig. 8 Trade-off and synergy relationships between various ecosystem services from 2005 to 2010 |
Fig. 9 Trade-off and synergy relationships between various ecosystem services from 2010 to 2015 |
Table 5 Pearson correlations between ESVs and driving force factors |
| Variations | X1 | X2 | X3 | X4 | X5 |
|---|---|---|---|---|---|
| Correlation coefficient | 0.908 | 0.164 | 0.796 | 0.409 | ‒0.187 |
| Variations | X6 | X7 | X8 | X9 | X10 |
| Correlation coefficient | 0.985* | 0.995** | 0.994** | 0.959* | 0.983* |
| Variations | X11 | X12 | X13 | X14 | X15 |
| Correlation coefficient | 0.847 | 0.971* | 0.990* | 0.981* | ‒0.907 |
| Variations | X16 | X17 | X18 | X19 | X20 |
| Correlation coefficient | 0.671 | 0.309 | 0.971* | 0.982* | 0.939 |
| Variations | X21 | X22 | X23 | X24 | X25 |
| Correlation coefficient | ‒0.306 | 0.991* | 0.477 | ‒0.964* | ‒0.038 |
Note:* means significance at P<0.05 level (both sides); **means significance at P<0.01 level (both sides). |
Table 6 Regression models of various ecosystem services in Altay Prefecture |
| ESV (×107 yuan) | Regression equation |
|---|---|
| Regulating service value | $y=0.001{{x}_{7}}+425.679$ |
| Supporting service value | $y=0.001{{x}_{7}}+573.770$ |
| Provisioning service value | $y=0.193{{x}_{22}}-7.579\times {{10}^{-7}}{{x}_{9}}+1.453\times {{10}^{-9}}{{x}_{10}}+68.502$ |
| Cultural service value | $y=8.665\times {{10}^{-5}}{{x}_{14}}+54.045$ |
| Total value | $y=0.002{{x}_{7}}+1128.635$ |
| [1] |
|
| [2] |
|
| [3] |
|
| [4] |
|
| [5] |
|
| [6] |
|
| [7] |
|
| [8] |
|
| [9] |
|
| [10] |
|
| [11] |
|
| [12] |
|
| [13] |
|
| [14] |
|
| [15] |
|
| [16] |
|
| [17] |
|
| [18] |
|
| [19] |
|
| [20] |
Tsendbazar N E, de Bruin S,
|
| [21] |
|
| [22] |
|
| [23] |
|
| [24] |
|
| [25] |
|
| [26] |
|
| [27] |
|
| [28] |
|
| [29] |
|
| [30] |
|
| [31] |
|
| [32] |
|
| [33] |
|
| [34] |
|
| [35] |
|
/
| 〈 |
|
〉 |