Climate change is one of the important factors affecting vegetation dynamic variations. The hydrothermal condition is the primary limiting factor for vegetation growth (Ye et al.,
2020), which is also affected by radiation (Yao et al.,
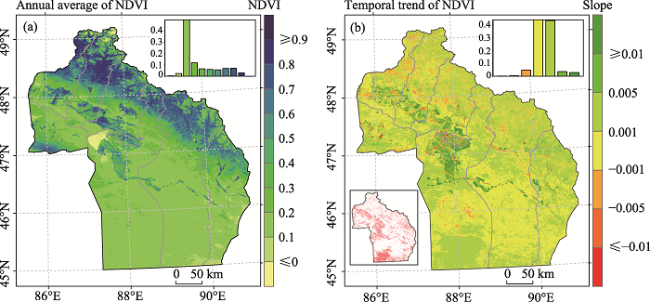
2018). Vegetation variation (
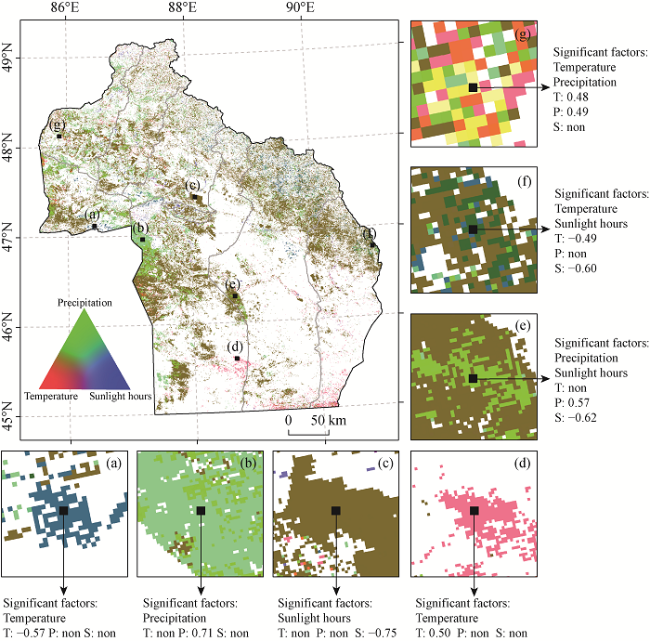
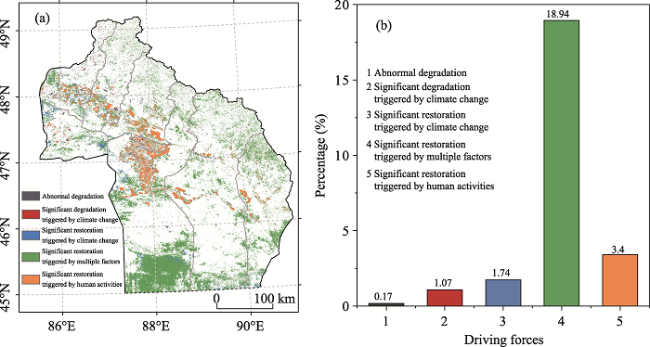
Fig. 3a) and its response to climate change (
Fig. 7) in Altay Prefecture can be explained from the following aspects. An appropriate temperature increase can promote the enzymatic activities related to photosynthesis (Davidson and Janssens,
2006; Sun et al.,
2020), accelerate the decomposition of organic matter (Kim et al.,
2012) and extend the growth period of vegetation (Piao et al.,
2007), with an evident promotion of photosynthesis. But higher temperatures will significantly affect the enzymatic activities of photosynthesis (Bao et al.,
2015) as well as the transpiration of vegetation and the transport of nutrients (Bao et al.,
2014), thus inhibiting the growth of vegetation. The increase of precipitation can increase soil moisture content, and soil water is a necessary medium for guaranteeing soil nutrient transportation (Sun et al.,
2020), so when light and CO
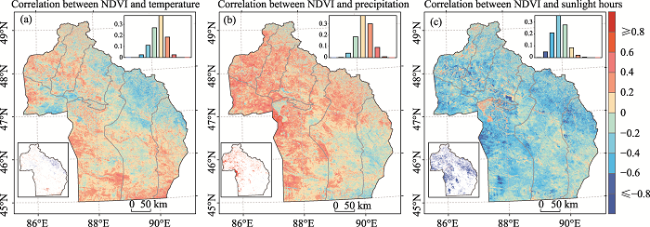
2 concentrations are sufficient, the soil water content determines the rate of photosynthesis. Therefore, the increase of precipitation played a crucial role in the restoration of vegetation. In addition, the sunlight hours can affect the amount of solar radiation the vegetation receives, and the radiation input would change the anaerobic soil conditions caused by high soil moisture content, thus indirectly affecting the photosynthesis of vegetation. In arid and semi-arid regions, precipitation is the main factor affecting vegetation growth, while temperature has little influence, which can explain why the area of NDVI is more significantly affected by precipitation than temperature in Altay (
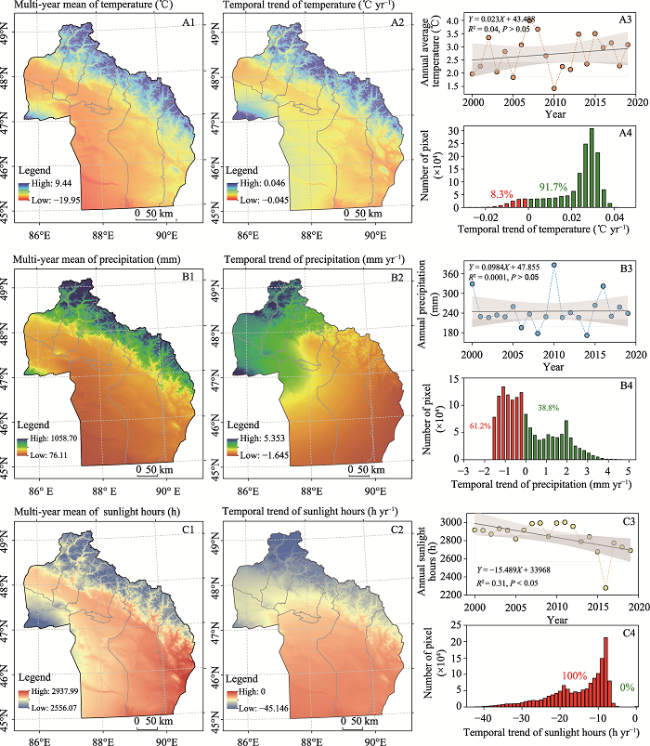
Fig. 6). The continuous increase in temperature may promote the circulation of the atmosphere, leading to an increase in precipitation (Qin et al.,
2005), which leads to the hydrothermal synchronization in the Altay Prefecture (
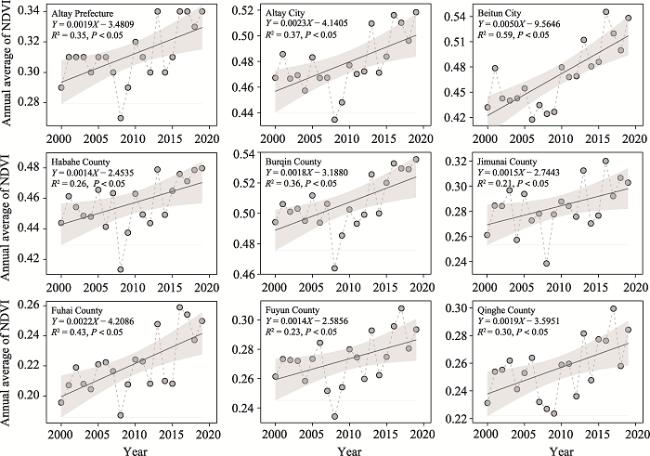
Fig. 5). Taking Jimunai County as an example, due to beneficial hydrothermal conditions, the NDVI of 58.68% of the areas improved, and significant improvement accounts for 19.95%. However, 5.39% of degradation occurred in this region, which may be caused by the fact that although the increase of precipitation improved the drought stress of the vegetation (Stefanie et al., 2017), the continuous increase of temperature also led to more intense evaporation in the arid region, which reduced the soil moisture content and inhibited the growth of vegetation (Shi et al.,
2014). For northern Altay in the mountains, the regional NDVI showed overall improvement which is mainly controlled by multiple factors, but since human activity is relatively difficult in the mountains, the NDVI dynamics is dominated by climate change. This may be due to rising temperatures in the region, leading to the permafrost melting, the precipitation increased and sunshine time decreased, the soil moisture was supplemented, the germination period of the vegetation was advanced, and the deciduous period was pushed back, resulting in an increase in the vegetation growth period (Oliva et al.,
2018), which was conducive to the vegetation prosperity. In addition, the vegetation type in this region is primarily coniferous forest, which absorbs water mainly through shallow root systems and does not depend on deep groundwater, so the increase of soil water is more conducive to its growth (Jiang et al.,
2017). The southern region of Altay is mainly desert with poor vegetation coverage, so in the past 20 years, as the temperature rose and the precipitation decreased, it was difficult to improve the vegetation situation, but it was also difficult for it to undergo extreme degradation relative to its initially poor state.
