Ecosystem Assessment in Altay Region

Impact of Land Use Changes on Habitat Quality in Altay Region

  • WANG Baixue , 1, 2 ,
  • CHENG Weiming 1, 2, 3, 4 ,
  • LAN Shengxin , 5, 6, *
Expand
  • 1. State Key Laboratory of Resources and Environmental Information System, Institute of Geographic Sciences and Natural Resources Research, Chinese Academy of Sciences, Beijing 100101, China
  • 2. University of Chinese Academy of Sciences, Beijing 100049, China
  • 3. Jiangsu Center for Collaborative Innovation in Geographical Information Resource Development and Application, Nanjing 210023, China
  • 4. Collaborative Innovation Center of South China Sea Studies, Nanjing 210093, China
  • 5. School of Economics and Management, University of Chinese Academy of Sciences, Beijing 100190, China
  • 6. Altay District Administration Office of Ili Kazak Autonomous Prefecture, Altay City, Xinjiang Uygur Autonomous Region 836599, China
*LAN Shengxin, E-mail:

WANG Baixue, E-mail:

Received date: 2021-02-14

  Accepted date: 2021-04-30

  Online published: 2021-11-26

Supported by

The Science and Technology Bureau of Altay Region in Yili Kazak Autonomous Prefecture(Y99M4600AL)

Abstract

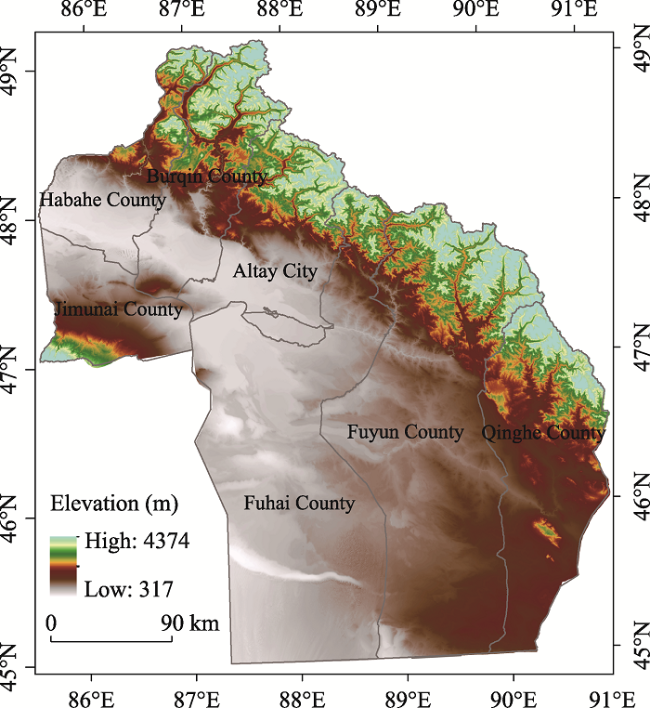
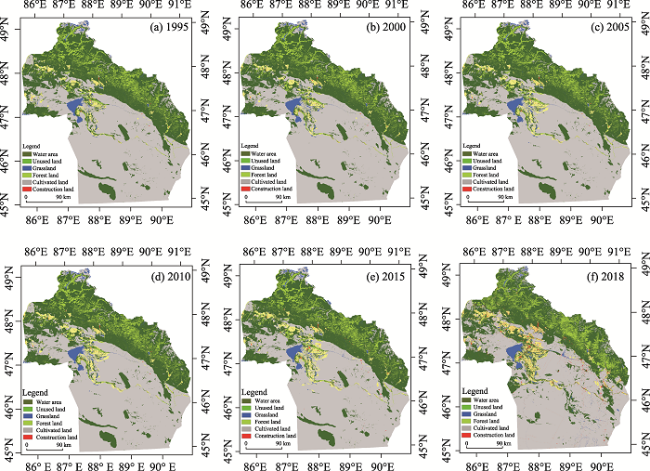
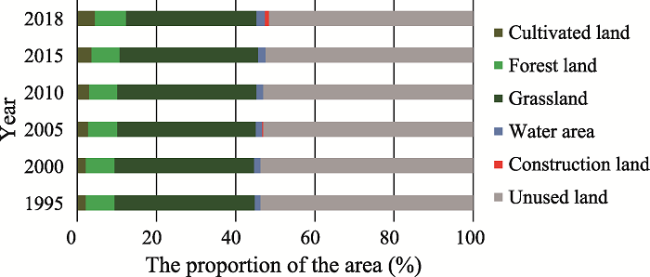
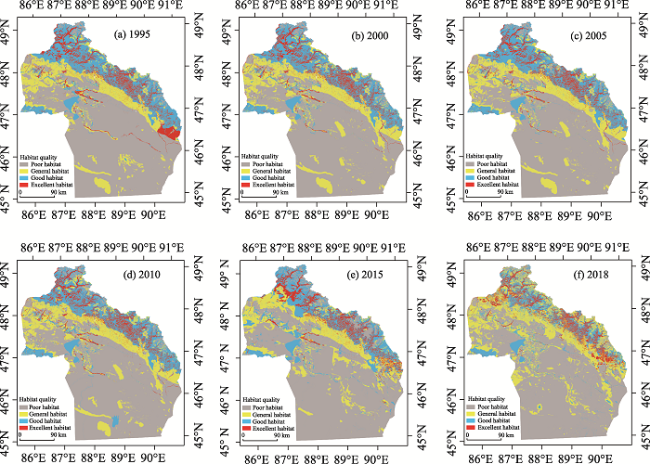
Altay region is located in the northern part of Xinjiang, and has complex and diverse internal geomorphic types, undulating terrain and a fragile ecosystem. Studying the impact of land use changes on habitat quality is of great significance to regional ecological protection and development, rational planning and utilization, and ensuring the sustainable development of the ecological environment. Based on the InVEST model, combined with land use panel data and topographic relief data of the Altay region, this paper studied the habitat quality from 1995 to 2018. The results show that cultivated land, water area and construction land increased gradually from 1995 to 2018, while grassland and unused land decreased. Forestland remained stable in the first five periods, but increased significantly in 2018. During 1995-2018, all land use types were transferred, mainly between cultivated land, forestland, grassland and unused land in the flat and slightly undulating areas. Poor habitat quality was dominant during 1995-2018. Habitat quality decreased significantly in 2015, which was related to the rapid expansion of cultivated and construction land as threat sources, as well as the decrease of forest and grassland as sensitive factors. However, habitat quality improved significantly in 2018, because a large amount of cultivated land and unused land were converted into forest land and grassland with high habitat suitability. Land use type has an important influence on habitat quality. The distribution characteristics of habitat quality for topographic relief types from good to bad were: large undulating area>medium undulating area>small undulating area>flat area>slightly undulating area. The findings of this study are of great significance for coordinating social, economic, and ecological development in this region and in similar areas.

Cite this article

WANG Baixue , CHENG Weiming , LAN Shengxin . Impact of Land Use Changes on Habitat Quality in Altay Region[J]. Journal of Resources and Ecology, 2021 , 12(6) : 715 -728 . DOI: 10.5814/j.issn.1674-764x.2021.06.001

1 Introduction

Since the 18th National Congress of the Communist Party of China, from the overall perspective of ecological civilization construction, General Secretary Xi Jinping put forward the thesis that “mountains, rivers, forests, cultivated land, lakes and grass are the community of life” and emphasized the importance of “coordinating the systematic management of mountains, rivers, forests, cultivated land, lakes and grasslands” and “carrying out the construction of ecological civilization in all directions, all regions and all processes”. In recent years, biodiversity has been making greater contributions to the global economy, human survival and human well-being (Rands et al., 2010; Dai et al., 2019). Biodiversity includes the diversity of animals, plants and mi-croorganisms at the levels of genetics, species and ecosystems. Biodiversity provides regulation and support for various ecosystem services (Ellis et al., 2019; Watson et al., 2019). However, with the increasing pressure of human activities on the natural environment (Terrado et al., 2016; Adger et al., 2018; Dai et al., 2019; Gaglio et al., 2019), biodiversity continues to decline. The degree of decline is now faster than in the past, it is expected that the rate of decline will continue to rise in the future (Wu et al., 2019; Mashizi and Escobedo, 2020), and this pressure had also brought significant changes to land use (Wu et al., 2015). Land use is one of the important risk factors affecting the quality of the natural environment and biological habitat (Corvalán, et al, 2005; Zhao et al, 2015). In particular, the expansion of agricultural land will aggravate the destruction of the natural environment and biological habitat and hinder the connectivity of habitat (Gao et al., 2017), thus increasing the fragmentation of the land (Postek et al., 2019). Research on land use and its impact on habitat quality, combined with decision support systems (DSSs), can help users plan and use land rationally, thereby protecting the environment (Kazak et al., 2018; Kazak and Hoof, 2018).
Land use change is one of the important factors affecting habitat quality (Janus and Bozek, 2019). It not only plays an important driving role in global social and economic changes, but also changes the composition and structure of habitats, and ultimately affects the material cycle and energy flow between habitat patches (Guo et al., 2010; Liu et al., 2014). According to the research of Dai et al. the interference by LULC (Land-Use/Land-Cover) changes on habitat quality leads to the decline of landscape connectivity and the intensification of land fragmentation (Dai et al., 2019) Therefore, understanding the impact of land use/cover change on habitat quality can provide an important reference for biodiversity conservation and land management by decision makers (Ahrends et al., 2015). Therefore, it is urgent to resolve the conflict between human activities and biodiversity conservation (Gong et al., 2019) on global, national, regional and local scales (Boykin et al., 2013).
Habitat quality is the ability of an ecosystem to provide all necessary goods and services in sufficient quantity for all its living environments (Niquisse and Cabral, 2018). It represents the overall ecological quality based on the spatial distances between habitat quality and the threats caused by human activities, which can be weighted to consider their impacts (Terrado et al., 2016; Peng et al., 2018). That is to say, habitat quality is the quality of natural resources closely related to human beings, and it is also the quality of the human living environment, including natural resources and various elements of the entire environment (Li, 1997). With the rapid development of the world population and social economy, people’s demand for land resources is increasing, and changes in the intensity and ways of land use have severely damaged the ecosystem, leading to the reduction and degradation of ecosystem service capabilities in many areas (McKinney, 2002; Forman et al., 2003; Fu and Zhang, 2014). Therefore, studying the relationship between land use changes and habitat quality changes can provide a basis for analyzing regional ecological environment changes, formulating regional ecological protection policies and achieving the sustainable use of land resources (Wu et al., 2015).
Currently, habitat quality assessment methods can be divided into two categories. One method involves obtaining habitat quality parameters through field surveys. This method investigates field samples, and on this basis a comprehensive evaluation index is built to evaluate the habitat quality of the study area. For example, Liu investigated and evaluated the biodiversity and habitat quality of Dunhuang West Lake Nature Reserve (Liu, 2009), Liu et al. conducted an investigation and analysis of the habitat quality of rivers in Yixing section of Taihu Lake Basin (Liu et al., 2012), and Yang et al. investigated the habitat quality of Laizhou Bay (Yang et al., 2014). However, the field survey sampling method tends to focus on the environments of small geographic areas or single species habitats, and this method is limited by time and manpower requirements, making it difficult to conduct long-term data analysis. The second method involves using models to evaluate the habitat quality of a study area based on land use data. Some common evaluation models include InVEST model (Integrated Valuation of Ecosystem Services and Trade-offs) (Kareiva et al., 2011), SoLVES model (Social Values for Ecosystem Services) (Sherrouse et al., 2014), MIMES model (Multiscale Integrated Earth Systems Model) (Boumans and Costanza, 2008), and ARIES model (Artificial Intelligence for Ecosystem Services) (Brown and Brabyn, 2012). Among them, the InVEST model provides more convenient data access, uses fewer parameters for analysis, and is easy to operate (Polasky et al., 2011). The habitat quality module of the InVEST model evaluates habitat quality by analyzing land use/cover maps and the threat degrees of different land use types to biodiversity. It is the most mature and widely applied model. This model evaluates the Biodiversity Status in the landscape, and uses LULC changes and biodiversity threat data combined with expert knowledge to obtain the consistent indicators of biodiversity responses to the threats (Terrado et al., 2016). According to the relative ranges and degradation degrees of different habitat types, the habitat quality determined by the InVEST model has been successfully used to maintain biodiversity. As a few recent examples, Polasky et al. (2011) quantified the changes in ecosystem services and biodiversity in Minnesota, in the United States; Gong et al. (2019) evaluated the changes in plant biodiversity in a mountainous area in the Bailong River Basin in Gansu Province; Liang and Liu (2017) investigated the changes in biodiversity caused by LULC changes in Zhangye, China; Mushet and others evaluated amphibious habitats with the parameterized InVEST model in the central plains of the United States from 2007 to 2012, and analyzed the characteristics and changing trends of amphibious habitats of various land use types (Mushet et al., 2014); Du and Rong used the two indicators of Habitat Quality Index and Habitat Degradation Index to represent the function of biodiversity, and analyzed the impact of land use changes on biodiversity in Shanxi Province (Du and Rong, 2015); Chen et al. calculated the impacts of background threat sources on habitat quality degradation using this model, and analyzed the impact of land use changes on habitat quality changes (Chen, 2016); and Liu and Xu compared the spatial-temporal evolution of habitat quality between Xinjiang Corps Region and Non-corps Region based on land use with InVEST model, and predicted the trend of habitat quality from 2018 to 2035 (Liu and Xu, 2020).
Using the InVEST model, many researchers have investigated the impact of land use changes on habitat quality, but such studies combined with characteristics of topography are still relatively few. Certain topographical features have a greater impact on the ecosystem, especially in the geographical units dominated by mountainous and large topography, the ecosystems will be relatively fragile. This will not only affect the mountain ecosystem services, but also the sustainable development of the region. Therefore, studying the impact of land use changes on habitat quality from the perspective of topography has important theoretical and practical significance for weighing and coordinating regional ecological protection and development. Based on previous studies, this paper considered the Altay region as the research object, using the habitat quality module of the InVEST model, and based on multi-period land use data and threat source data, the changes in the habitat quality index are analyzed from two aspects: Land use change and topographic relief. Exploring the relationship between land use change and habitat quality, and studying the distribution of regional habitat quality across topographic undulation categories, can provide references for the rational planning and utilization of regional land and the coordinated development of the ecological environment.

2 Study area

Altay region is located in northern Xinjiang Uygur Autonomous Region with the geographic scope of 85°31′36″- 91°04′23″E and 45°00′00″-49°10′45″N. Altay region is 402 km from east to west and 464 km from north to south with a total area of 1.18×10⁵ km², accounting for 7.1% of the total area of Xinjiang. It has jurisdiction over Altay City and Burqin, Fuyun, Fuhai, Habahe, Qinghe, and Jimunai counties, for a total of six counties and one city, all of which are border counties (cities) (Fig. 1). The Altay region includes the Altai Mountains in the north, the Shawuer Mountains in the west, and the Junggar Basin in the south. There are two major river basins between the mountains and the basin, the Irtysh River and the Wulungu River. The mountain area accounts for about 32% of the total area, with the lowest altitude of 365 m and the highest altitude of 4265 m. The Altay region, known as “Golden Mountain and Silver Water”, is rich in mineral and energy resources, which make it one of the important strategic reserves of metal resources in China. The grassland and forest areas are also relatively large, making it one of the six major forest areas in our country and also an important green protection and ecological safety zone. For example, there are currently 30 nature reserves of various levels in Altay region, including three National Nature Reserves and four Autonomous Regional Nature Reserves, such as Xinjiang Altay Mountain two River headwaters natural ecological reserve, etc. These nature reserves play a very important role in maintaining the ecological security of the Altay region. But in recent years, severe overloading and overgrazing of grasslands, over-exploitation by humans, and unreasonable use of natural resources have led to a continuous decline in environmental quality, bare ground, shrinking wetland areas, declining populations of animals and plants, and serious imbalances in ecological capacity. These changes have had a serious impact on local production and life quality, and the regional habitat quality has attracted more and more attention.
Fig. 1 Location and topography of the study area

3 Data and methods

3.1 Data sources

Based on the land use data from 1995 to 2018, this paper analyzes the spatial pattern and evolutionary characteristics of habitat quality in the study area. Data for the first five periods of land use are from the Resource and Environment Science and Data Center (http://www.resdc.cn/), and the land use data for 2018 come from the data center of the Ministry of Natural Resources. Referring to the LULC remote sensing monitoring data analysis system, the land use types are divided into six primary types: Cultivated land, forest land, grassland, water area, construction land and unused land, which include 24 secondary types. The land use raster data are all in grid format, the resolution is 100 m, the boundary data are represented by a 1: 250000 vector map and the coordinate system is unified as WGS_1984_Lambert_Conformal_Conic. Based on SRTM-DEM data with 90 m resolution and using the neighborhood analysis method and mean change point analysis method (Zhang et al., 2008; Wang and lv, 2009), the optimal statistical unit of topographic relief in Altay region is calculated as the grid size of 17×17 (2.3409 km²). The range of topographic relief in the study area is 0-1400 m and the average relief is 191.744 m. According to the classification of topographic relief in China, combined with the actual relief situation of Altay region, the topographic relief values are assigned to five levels, namely: Flat area (<30 m), slightly undulating area (30-70 m), small undulating area (70-200 m), medium undulating area (200-500 m), and large undulating area (500-1400 m) (Zhang et al., 2008; Wang and Lv, 2009).

3.2 Research methods

This paper used the Habitat Quality module in the InVEST model to evaluate the habitat quality of the study area. The InVEST habitat quality model can reflect biodiversity by evaluating the range of various habitat quality types or vegetation types and the degradation degree of each type. The main principle is to combine the sensitivity of various landscape types in the assessment area and the intensity of landscape threat factors to obtain the distribution of habitat quality. Habitat quality is closely related to land use changes. Human use of land changes the type of land use and affects the level of habitat quality. The greater the intensity of human activities, the greater the threat to the regional habitat quality, and the lower the level of habitat quality and biodiversity (Ouyang and Zheng, 2009; Cheng et al., 2019).
The degree of habitat quality is represented by the Habitat Quality Index. Habitat quality is based on the availability of living resources, the amount of reproduction and presence of organisms, and the ability of an ecosystem to provide suitable living conditions for individuals and populations. Its value is between 0 and 1; and the higher the value, the better the habitat quality. In other words, the assessment by this module reflects the influences of human activities on the eco-environment. The stronger the intensity of human activities, the greater the threat to the habitat and the lower the habitat quality and the biodiversity level in this region; on the contrary, the higher the habitat quality, the lower the interferences from human activities and the higher the biodiversity level in this region (Xie et al., 2018). This paper combines the sensitivity of different land use types to threat factors and the intensity of the external threats to calculate the habitat quality of the study area, thereby reflecting the suitability of the combination of human survival and sustainable development of the social economy (Ye and Liu, 2000). The specific calculation formula is as follows:
${{Q}_{xj}}={{H}_{j}}\left[ 1-\left( \frac{D_{xj}^{z}}{D_{xj}^{z}+{{k}^{z}}} \right) \right]$
where Qxj is the habitat quality of grid x in land use type j; Hj is the habitat suitability of land use type j; Dxj is the habitat degradation degree of grid x in land use type j; k is the half-saturation constant; z is the normalization constant, and usually takes the value 2.5; and the calculation formula of Dxj is as follows:
${{D}_{xj}}=\underset{r=1}{\overset{R}{\mathop{\mathop{\sum }^{}}}}\,\underset{y=1}{\overset{{{Y}_{r}}}{\mathop{\mathop{\sum }^{}}}}\,\left( \frac{{{\omega }_{r}}}{\underset{r=1}{\overset{R}{\mathop{\mathop{\sum }^{}}}}\,{{\omega }_{r}}} \right){{r}_{y}}{{i}_{rxy}}{{\beta }_{x}}{{S}_{jr}}$
where r is the threat source; R is the number of threat sources; y is the grid number of threat source r; x is the number of grids in the habitat; Yr is the number of grids occupied by threat sources; ωr is the weight of the threat source r, which represents the relative destructive power of a certain threat factor to all habitats, with a value range of 0-1; irxy is the threat level of the threat source value ry of the grid y to the habitat grid x; βx is the accessibility level of grid x, with a value range of 0-1, the larger the value, the easier it is to reach; and Sjr is the sensitivity of land use type j to threat source r, with a value ranging from 0 to 1, and the larger the value, the more sensitive. The model provides both linear and exponential recession calculation methods for the calculation of irxy:
${{i}_{rxy}}=1-\left( \frac{{{d}_{xy}}}{{{d}_{r\max }}} \right)$(if it is linear decay)
${{i}_{rxy}}=\exp \left[ -\left( \frac{2.99}{{{d}_{r\max }}} \right){{d}_{xy}} \right]$ (if it is exponential decay)
where dxy is the distance between grid x and grid y; and drmax is the influencing scope of the threat factor r.
By comprehensively considering the current situation of the study area, related research results and expert opinions (Du and Rong, 2015; Wu et al., 2015; Chen et al., 2016; Xie et al., 2018; Cheng et al., 2019; Liu and Xu, 2020), this paper regards cultivated land, urban land, rural residential areas, other construction land, and unused land that have a direct impact on quality habitat as the threat sources. The parameters that need to be set for the threat sources include: The longest threat distance, weight, and spatial attenuation type (Table 1). The sensitivity of land use types to threat sources is needed to determine the habitat suitability parameters of each land use type and the sensitivity parameters for each land use type to the threat sources (Table 2). The above parameters are based on the InVEST model user manual (Tallis et al., 2013), and in combination with previous research results (Wu et al., 2015; Liu et al., 2017; Zhong and Wang, 2017) and expert opinions, we finally obtained the corresponding parameter settings.
Table 1 Threat factors and their stress responses
Threat sources (r) The longest threat distance (drmax) Weight (wr) Spatial attenuation types
Cultivated land 4 0.6 Linear decay
Urban land 8 0.8 Exponential decay
Rural residential land 6 0.6 Exponential decay
Other construction land 7 0.7 Exponential decay
Unused land 4 0.4 Linear decay
Table 2 Sensitivity of land use types to habitat threat factors (Sjr)
Land use types Habitat suitability Threat sources
Cultivated land Urban land Rural residential land Other construction land Unused land
Cultivated land 0.5 0 0.8 0.6 0.7 0.4
Woodland 1.0 0.7 0.9 0.8 0.8 0.5
Shrubwood 1.0 0.6 0.8 0.7 0.7 0.4
Sparse woodland 0.9 0.7 0.9 0.8 0.8 0.5
Other woodland 0.8 0.7 0.9 0.8 0.8 0.5
High coverage grassland 0.9 0.6 0.7 0.7 0.7 0.7
Medium coverage grassland 0.8 0.7 0.8 0.8 0.8 0.7
Low coverage grassland 0.7 0.7 0.8 0.8 0.8 0.7
Water area 0.9 0.4 0.7 0.6 0.7 0.4
Urban land 0 0 0 0 0 0
Rural residential land 0 0 0 0 0 0
Other construction land 0 0 0 0 0 0
Unused land 0.3 0.4 0.6 0.5 0.6 0

Note: 0 means habitat quality is not sensitive to the indicated threat factor; 1.0 means habitat quality is highly sensitive to the indicated threat factor.

4 Results

4.1 Land use changes

Figures 2 and 3 show that the main land use types are unused land, grassland and forest land. The areas of these three types account for more than 90% of the study area. From 1995 to 2018, the land use change was mainly manifested as the increases of cultivated land, water area and construction land. Among them, cultivated land and water area showed slow increases year by year. Construction land increased slowly from 1995 to 2015, but it increased significantly in 2018, growing from 225.95 km² in 2015 to 1310.59 km² in 2018. Meanwhile, grassland and unused land showed decreasing trends from 1995 to 2018. Forest land remained basically stable in the first five phases and increased significantly in 2018, from 8529.66 km² in 2015 to 9335.70 km² in 2018.
Fig. 2 Distribution and changes of land use types in Altay region from 1995 to 2018
Fig. 3 Percentage of each land use type from 1995 to 2015
A transfer matrix was constructed for the six periods of the land use data (Table 3), and in combination with Fig. 2, it can be seen that the land use transfer from 1995 to 2000 mainly occurred between cultivated land, forest land, grassland and unused land. The transferred areas basically remained consistent, and the transfer-in and transfer-out areas were basically the same. The area of forest land converted to grassland was 1075.13 km² more than grassland converted to forest land. The area of unused land converted to grassland was 1093.23 km² more than grassland converted to unused land. From 2000 to 2005, cultivated land and forest land were mainly converted to grassland; while grassland was mainly converted to cultivated land and unused land. The area of cultivated land converted to grassland was significantly smaller than the area of grassland converted to cultivated land, while unused land was mainly converted to cultivated land and grassland. From 2005 to 2010, the transitions between grassland, forest land, cultivated land and unused land were still the main focus. However, unlike 2000-2005, the areas of unused land converted to grassland and grassland converted to unused land increased 1787.08 km² and 1452.07 km², respectively. Generally speaking, the area of unused land converted to other types was more than the area of others converted to it, which showed that more unused land was developed and utilized by people.
Table 3 Land use conversion matrix from 1995 to 2018 (Unit: km²)
Time periods Land use types Cultivated land Forest land Grassland Water area Construction land Unused land
1995-2000 Cultivated land 1952.71 88.42 325.92 6.49 22.97 214.12
Forest land 109.28 7780.80 1683.23 38.62 2.18 171.50
Grassland 288.49 608.10 36264.52 56.55 7.65 1824.83
Water area 0.77 9.10 14.00 1655.02 0 17.81
Construction land 2.55 1.57 6.71 0.56 75.10 1.93
Unused land 254.71 51.64 2918.06 144.57 6.30 60285.93
2000-2005 Cultivated land 2507.47 5.01 80.96 0.73 2.14 12.20
Forest land 22.09 8082.02 391.71 31.41 1.56 10.84
Grassland 338.27 95.06 40404.34 28.82 5.03 340.92
Water area 1.98 36.40 19.30 1803.78 0.02 40.33
Construction land 1.85 0.85 0.60 0 108.83 2.07
Unused land 549.07 1.05 214.80 23.67 8.08 61719.45
2005-2010 Cultivated land 2581.18 98.37 439.02 19.17 40.86 242.21
Forest land 76.56 6466.08 1497.95 67.40 4.93 107.61
Grassland 427.98 1917.89 36864.26 114.66 24.98 1792.99
Water area 14.46 42.24 93.86 1559.81 0.49 179.11
Construction land 23.91 4.33 10.13 0.39 79.93 6.97
Unused land 257.59 129.85 2001.88 256.16 7.21 59483.74
2010-2015 Cultivated land 2743.00 39.86 282.95 24.02 135.96 155.22
Forest land 328.31 5320.98 2607.48 126.52 36.17 237.78
Grassland 1200.46 2874.30 27032.12 334.37 220.01 9246.42
Water area 43.19 37.33 108.95 1631.90 4.40 191.10
Construction land 31.93 1.87 12.02 3.10 104.64 4.99
Unused land 1335.08 183.95 5242.75 465.03 309.35 54300.69
2015-2018 Cultivated land 3977.88 196.10 1046.99 53.74 270.17 146.96
Forest land 155.41 5007.30 3078.19 56.73 35.06 137.38
Grassland 587.27 3794.70 25898.31 240.72 254.79 4844.29
Water area 15.89 83.52 287.63 1842.31 27.33 334.64
Construction land 94.94 20.08 154.58 13.61 342.40 188.69
Unused land 364.20 231.92 8360.97 271.88 381.38 54961.99
The main land conversions from 2010 to 2015 were cultivated land to grassland; forest land to grassland; grassland to cultivated land, forest land and unused land; and unused land converted to cultivated land and grassland. Among them, the transfer-in and transfer-out between grassland and forest land were basically the same. There were obvious transitions between the six types of land use from 2015 to 2018. For example, the transfer-in between cultivated land and grassland was much greater than the transfer-out; the conversion between forest land and grassland was not significant; and the transfer of grassland to unused land was 3156.68 km² smaller than the reverse, indicating that more grassland was degraded into unused land. It is worth noting that the area of construction land converted into grassland and unused land in this period was also much larger than in the previous period, and the area of water area converted to unused land also increased year by year.
From 1995 to 2018, all land use types had been transferred. The areas of water area and construction land were relatively small, so the transferred areas were small. The areas of cultivated land and construction land increased significantly, by 2603.82 km² and 1223.91 km², respectively. However, grassland and unused land areas were reduced greatly, by 3030.83 km² and 2665.29 km², respectively. Among them, grassland was mainly transferred to forest land and unused land, while unused land was mainly transferred to grassland which led to the serious overloading and overgrazing of grassland, and also to over-exploitation and unreasonable utilization. The unreasonable behaviors of the people led to bare ground and a serious imbalance in ecological carrying capacity, and finally to the decline of ecological environmental quality.

4.2 Analysis of habitat quality

4.2.1 Spatial changes in habitat quality

The habitat quality is represented by the habitat quality index, which is in the range of 0-1. The higher the value, the better the habitat quality and the more complete the habitat, and also the more conducive to the higher biodiversity of the system. Habitat quality is often affected by the intensity of land use-as the intensity of land use increases, the threat sources of the habitat will also increase and their intensity will increase, which will cause the degradation of the habitat quality surrounding the threat sources. Using the habitat quality module in the InVEST model, according to formula (1), we obtained the habitat quality index values from 1995 to 2018, with the average values for each period were 0.31971, 0.31996, 0.31953, 0.32057, 0.31047, 0.31565, respectively. While the calculation results of the InVEST model do not have a standard classification threshold, the commonly used “Natural break method” can identify the classification intervals, group the similar values most appropriately, and maximize the differences between the various categories. Therefore, in ArcGIS 10.6, the habitat quality index was classified by the natural break method. Then the values were assigned to one of four levels from low to high, namely: Poor habitat [0, 0.5), General habitat [0.5, 0.8), Good habitat [0.8, 0.9), and Excellent habitat [0.9, 1.0] (Fig. 4).
Figure 4 shows that the data of the six periods were dominated by poor habitat quality, which was closely related to the largest proportion of unused land. Excellent habitat was mainly distributed in the forest land of the high-altitude area, mainly in the Altai Mountains. The habitat quality of grassland, water area and the transition zone between forest and grass belonged to the good habitat level. However, the general habitat areas were mainly distributed in grassland edge areas, the oasis at the edge of the desert, and the small pieces of forest land and grassland in the middle of the unused land. Finally, the habitat quality of cultivated land and unused land was at a poor level.
Fig. 4 Spatial distribution of habitat quality in Altay region from 1995 to 2018
From 1995 to 2010, the habitat quality remained basically unchanged, but it decreased significantly in 2015, which might have been related to the rapid expansion of cultivated land, construction land and the reduction of forest land and grassland coverage. Affected by human activities, the extension of the construction land and cultivated land occupied a large amount of grassland, while the grassland at the edge of unused land was degraded into unused land, resulting in the decline of habitat quality. Compared with 2015, the habitat quality in 2018 was significantly improved. This was because the implementation of the ecological protection policy in the study area resulted in a large amount of cultivated land and unused land being converted into forest land and grassland in 2015. This measure increased the coverage of forest land and grassland, improved the habitat suitability, and ultimately improved the habitat quality.

4.2.2 Changes in habitat quality of different land use types

Table 4 shows that from 1995 to 2018, the highest average value of habitat quality index was that of forest land, which means the forest land had the best habitat quality. It was followed by water area and grassland. The worst habitat quality was that of construction land. Table 4 also shows that the habitat quality index of forest land and unused land did not change significantly, and the water area showed a trend of decrease-increase-decrease. The habitat quality index of cultivated land and grassland remained basically unchanged from 1995 to 2010, and the cultivated land showed a downward trend in 2015 and 2018, while grassland first increased and then decreased. For construction land, it remained basically unchanged from 1995 to 2005, and continued to increase from 2010 to 2018. These changes in the habitat quality of cultivated land, grassland, water area and construction land might have occurred due to human factors, such as the continuous expansion of cultivated land and construction land, the reclamation and conversion of grassland to cultivated land and the over-exploitation of grassland converted to unused land, and water areas were artificially transformed into rivers channels, reservoirs, ponds, etc. Due to the transformations caused by human beings, the original state of the ecological environment was destroyed, and the habitats characterized by negatively disturbed land-use types were degraded to varying degrees. All of those changes resulted in declines in biodiversity and habitat quality index. However, the habitat quality had also been improved in some cases through positive human disturbances, such as returning farmland to forest land and grassland, and the implementation of relevant ecological protection policies. Although the forest land habitat quality index had been maintained at a relatively high level of above 0.95 from 1995 to 2018, the overall habitat quality of forest land showed a slow downward trend. This was because the forest land in Altay region was mostly distributed in high elevations with a large topographic relief. The mountain areas are not conducive to human activities such as reclamation and housing construction. However, due to logging, deforestation and other behaviors, the forest land began to degrade. At the same time, because of the limitations of topography, human activities cannot be carried out on a large scale. Furthermore, the forest land with a high coverage rate has a strong ability to resist interference, and coupled with the implementation and restoration of various ecological protection policies, the habitat quality of forest land was maintained at a high level.
Table 4 Average values of habitat quality index for each land use type
Land use type 1995 2000 2005 2010 2015 2018
Cultivated land 0.50557 0.50693 0.50410 0.50668 0.49928 0.49608
Forest land 0.98223 0.97848 0.97778 0.97522 0.98492 0.95765
Grassland 0.80085 0.79374 0.79457 0.79326 0.80373 0.77939
Water area 0.89169 0.80438 0.80368 0.88330 0.89225 0.86986
Construction land 0.02142 0.02317 0.02265 0.05028 0.05685 0.18469
Unused land 0.29955 0.30013 0.30021 0.30099 0.29862 0.30160

4.3 Topographic relief and habitat quality

In ArcGIS 10.6, we superimposed different levels of topographic relief data with the habitat quality raster maps for the six periods. The result shows the changes of habitat quality index in different topographic relief degrees (Fig. 5, Table 5).
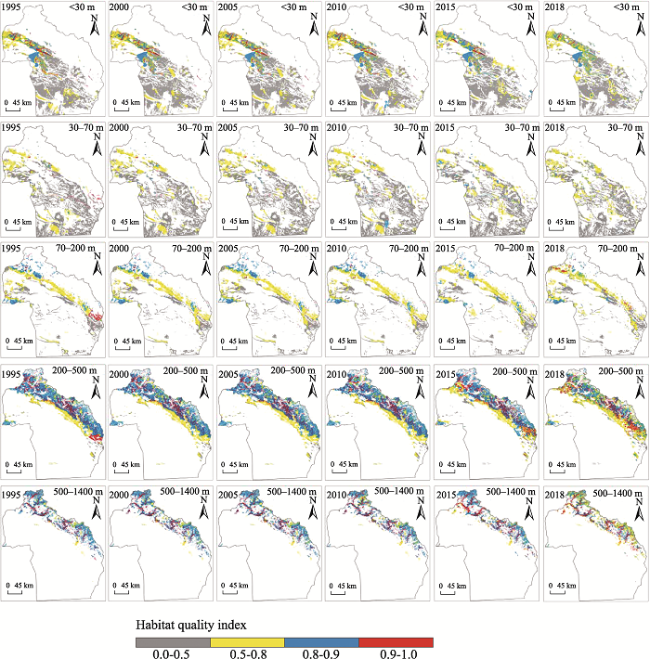
Fig. 5 Changes of habitat quality index in different topographic relief degrees
Figure 5 shows that the flat area and slightly undulating area were mainly poor habitat [0, 0.5). This was because these two areas were mainly unused land, while the unused land in the Altay region is mainly Gobi, Saline-alkali land, bare soil, bare rock gravel, etc., which are not conducive to vegetation growth. The habitat quality in the small undulating area was mainly poor habitat [0, 0.5) and general habitat [0.5, 0.8). As above, the poor habitat was mostly unused land, while the general habitat was the transition zone between grassland and unused land. The middle and large undulating areas were mainly good habitat [0.8, 0.9) and excellent habitat [0.9, 1.0]. Because these areas are higher in altitude, they were less disturbed by human factors, and the area ratios of forest land and grassland with better habitat quality were significant.
Table 5 Area changes of habitat quality grades in different topographic relief levels
Topographic relief Year Average habitat quality index The area proportion of each grade habitat quality (%)
Poor habitat
[0, 0.5)
General habitat [0.5, 0.8) Good habitat [0.8, 0.9) Excellent habitat [0.9, 1.0]
Flat area
(<30 m)
1995 0.42458 75.5 15.2 6.4 2.8
2000 0.42817 74.7 16.2 6.6 2.5
2005 0.42874 75.2 15.9 6.5 2.5
2010 0.43275 74.6 15.8 7.2 2.4
2015 0.42458 78 12.5 8.4 1.2
2018 0.43020 75.1 16.5 7.6 0.8
Slightly undulating area
(30-70 m)
1995 0.36651 85.2 12.4 1.3 1.1
2000 0.37199 83.4 14.4 1.5 0.7
2005 0.37301 83.4 14.5 1.5 0.6
2010 0.37886 82.4 14.6 2.4 0.6
2015 0.36710 85.6 11.4 2.7 0.3
2018 0.37366 83.5 14.2 2.1 0.2
Small
undulating area
(70-200 m)
1995 0.52156 53.5 27.6 13.6 5.2
2000 0.52499 50.9 32.4 14.2 2.5
2005 0.52414 51.0 32.3 14.6 2.1
2010 0.52589 50.7 32.8 14.2 2.4
2015 0.50835 55.1 31.6 11.8 1.6
2018 0.50619 55.7 31.2 9.8 3.2
Medium undulating area
(200-500 m)
1995 0.81678 8.1 18.5 53.3 20.1
2000 0.80672 8.4 22.0 52.1 17.4
2005 0.80293 9.1 21.7 52.5 16.6
2010 0.80156 9.5 22.8 50.3 17.4
2015 0.76779 16.2 24.0 40.5 19.3
2018 0.78841 9.2 38.2 33.1 19.5
Large
undulating area
(500-1400 m)
1995 0.83551 10.2 10.0 56.8 23.0
2000 0.82717 11.5 11.2 53.9 23.3
2005 0.82312 12.3 10.7 54.0 22.9
2010 0.81012 14.3 12.6 49.0 24.1
2015 0.78222 20.2 9.6 44.9 25.3
2018 0.80406 9.9 32.5 32.7 24.9
Combined with the data in Table 5, the habitat quality from good to bad showed the following sequence: Large undulating area>medium undulating area>small undulating area>flat area>slightly undulating area. Among them, in the flat area, the proportions of areas with poor habitat, general habitat and good habitat changed little from 1995 to 2010, but in 2015 and 2018, the proportion of excellent habitat declined significantly. In the slightly undulating area, there was basically no distribution of excellent habitat, poor habitat and general habitat were basically unchanged, and the good habitat showed an overall increasing trend. In the small undulating area, different habitat quality levels showed no significant changes from 1995 to 2010, but the poor habitat increased in 2015 and 2018. Except for the increase of excellent habitat in 2018, the other three levels of habitat quality decreased, which had a strong relationship with the conversion of grassland into cultivated land and unused land. In the middle undulating area, the general habitat increased year by year, from 18.5% in 1995 to 38.2% in 2018, while the trend for good habitat was the opposite, decreasing from the initial 53.3% to only 33.1% in 2018. Combined with the land use changes of different topographic relief levels, these changes were associated with the continuous decline of unused land and the increases of forest land and grassland. The proportions of the areas occupied by poor habitat and excellent habitat had not changed significantly, but the poor habitat area increased by 6.7% in 2015 compared with 2010, which might be related to the conversion of grassland into construction land and unused land in 2015. In the large undulating area, the proportions of areas with poor habitat and good habitat showed overall increasing trends, but the poor habitat area declined significantly in 2018, which might be related to the decrease in unused land and the increase in forest land in 2018. The general habitat presented fluctuating changes, but the changes were relatively small. The area proportion of excellent habitat remained basically unchanged, because the areas with large terrain undulations have higher altitudes, and the range of human activities in these areas was limited. Human influence on the natural ecology was less prominent, so the habitat quality was better maintained.

5 Discussion

In conclusion, the regional habitat quality is mainly affected by two factors. One is that a certain type of land cover itself serves as a habitat, and its suitability directly affects the quality of the habitat; while the other is the degradation degree of a certain habitat after being affected by the threat source. The InVEST model used in this paper provided a feasible method for habitat quantification and visually displayed the measurement results. From 1990 to 2018, the overall habitat quality in the study area improved. The main reason for the small amount of degradation in the early stage was that the expansion of cultivated land and construction land occupied grassland, and the expansion was mainly located at the edge of the basin. Cultivated land and construction land used as threats were growing rapidly, and their occupation of grassland would directly lead to the degradation of habitat quality. Zheng et al. and Fu et al. confirmed that land use changes will directly affect the values of regional ecosystem services (Zheng et al., 2010; Fu et al., 2014). Therefore, the study area should plan land use rationally to avoid the occupation of grassland for urban and cultivated land development. In addition, unused land can be properly developed to coordinate economic development and ecological environment protection, and promote the sustainable use of the land’s resources.
Before 2010, there was little change in habitat quality, and the local ecological environment was improved, which was related to the Three North Shelterbelt Project and the project of returning farmland to forest. These measures transformed part of the cultivated land and unused land into forest land and grassland with higher habitat quality. The increase of green area had improved the ecological environment in some areas, which had also been proven by previous studies (Xie et al., 2018; Liu and Xu, 2020; Zhang et al., 2020). In the future, it will be necessary to convert farmland to forest and grassland, construct ecological projects and establish nature reserves in accordance with local conditions to improve the quality of regional habitats.
In 2015, the habitat quality declined significantly. Affected by population growth and economic development, the construction land had expanded. However, the habitat suitability of construction land was at the lowest level, and the threat of construction land to the surrounding habitat was higher than those of cultivated land and unused land. From the long-term development point of view, we should take necessary measures to reasonably plan construction land, and to carry out land consolidation and intensive use of land in order to prevent the deterioration of the ecological environment.
In 2018, the habitat quality had been significantly improved. That improvement was directly related to the series of ecological protection measures carried out in recent years, such as the “battle to protect the blue sky”. In the future, we should adhere to the concepts of “protecting the ecological environment means protecting productivity”, “green water and green mountains are golden mountains and silver mountains,” and “ice and snow are also golden mountains and silver mountains”. We also should rationally plan land use to realize the sustainable development of natural resources and ecology.
In general, compared with previous related studies, the major innovation of this study was to introduce geomorphic factors to explore the habitat quality under different topographic relief degrees. However, the geomorphic types in Altay region are complex, and can be divided into northern mountainous area, central plain and southern desert. This study did not analyze the geomorphic units separately, and only introduced a geomorphic factor of topographic relief, which is also a deficiency of the current study. Moreover, due to data limitations, this study only considered the impact of internal threat sources on habitat quality in the study area, and did not consider the impact of external threat sources, which may lead to certain errors in the assessment results. At the same time, some parameter indicators ware obtained from previous research results and expert experience, the internal mechanisms of the habitat are complex, and different regions have large differences, which will also introduce uncertainty and affect the assessment results. In future research, different geomorphic units and different geomorphic factors will be analyzed separately, and the threat factors in the marginal portions of the study area will be combined at the same time. We will also further consider the internal mechanisms of habitat quality, and strengthen the local parameterization based on field survey data, in order to more accurately evaluate the spatiotemporal variation characteristics of habitat quality. In addition, this paper only studied the temporal and spatial characteristics of habitat quality from the perspective of land use types. In the future, we will combine this with other ecosystem modules to comprehensively consider the ecological effects of land use changes, in order to provide a scientific reference for the sustainable and healthy development of ecosystems in the Altay region.

6 Conclusions

On the basis of previous studies, land use data and topographic relief factors, taking Altay region as an example, this paper analyzed the temporal and spatial changes of land use. The Habitat Quality Module in the InVEST model was used to analyze the habitat quality from 1995 to 2018 from the aspects of land use change and topographic undulation. This analysis produced four main results.
The main types of land use in Altay region were unused land, grassland and forest land. From 1995 to 2018, the areas of cultivated land, water area and construction land increased gradually, while grassland and unused land decreased year by year. The forest land remained stable in the first five periods and increased significantly in 2018. During 1995-2018, all types of land use were transferred, and the transfers mainly occurred between cultivated land, forest land and unused land in the flat area and slightly undulating area. Among them, the transfer-out area of unused land was larger than its transfer-in, indicating that more unused land had been developed and utilized by people. Overgrazing degradation of grassland, continuous expansion and encroachment by cultivated land and construction land might be the main reasons for the decreases of grassland and unused land areas.
From 1995 to 2018, poor habitat quality [0, 0.5) dominated, which was closely related to the largest proportion of unused land. The excellent habitat quality areas were mainly distributed in the high-altitude forest land of the Altai Mountains. The habitat quality of grassland, water area and the transition zone between forest land and grassland belonged to the good habitat level. The habitat quality of grassland edge and small portions of forest land and grassland distributed in the middle of unused land was general habitat. The habitat quality of cultivated land and unused land was poor habitat. From 1995 to 2010, the habitat quality remained basically unchanged. In 2015, the habitat quality was significantly lower than before, which was related to the rapid expansion of threat sources (cultivated land and construction land) and the reduction of sensitive factors (forest land and grassland). The significant improvement in habitat quality in 2018 was due to the conversion of large amounts of cultivated land and unused land into forest land and grassland with higher habitat suitability in 2015, which improved the overall habitat suitability and habitat quality in the study area.
The type of land use had an important impact on habitat quality. The forest land had the best habitat quality, followed by water area and grassland. The worst habitat quality was construction land. Over the past 20 years, cultivated land, grassland, water area and construction land had been disturbed by human factors in both positive and negative directions, and their habitat quality levels had fluctuated in different states. For example, the continuous expansion of cultivated land and construction land; grassland had been reclaimed and converted into cultivated land; and water areas had been artificially transformed into canals, reservoirs and ponds. In addition, there were many other negative disturbances. However, after returning farmland to forests and grasslands and the implementation of relevant ecological protection policies, the degree of habitat degradation declined and the quality of habitat had been improved.
The distribution characteristics of habitat quality in topographic relief categories from good to bad were: Large undulating area > medium undulating area > small undulating area > flat area > slightly undulating area. The flat area and slightly undulating area were dominated by poor habitat because these areas were mainly cultivated land and unused land. The unused land in Altay region was mainly Gobi, saline-alkali, etc., which is not conducive to vegetation growth. Poor habitat suitability and low biodiversity ultimately led to poor habitat quality. The small undulating area was mainly poor habitat and general habitat, and the poor habitat was mostly unused land, while the general habitat was the transition zone between grassland and unused land. The medium and large undulating areas were mainly good habitat and excellent habitat.
[1]
Adger W N, Adams H, Kay S, et al. 2018. Ecosystem services, well-being and deltas: Current knowledge and understanding. In: Nicholls R J, Hutton C W, Adger W N (eds.). Ecosystem Services for Well-Being in Deltas. Cham: Palgrave Macmillan. DOI: 10.1007/978-3-319-71093-8_1.

DOI

[2]
Ahrends A, Hollingsworth P M, Ziegler A D, et al. 2015. Current trends of rubber plantation expansion may threaten biodiversity and livelihoods. Global Environmental Change, 34: 48-58.

DOI

[3]
Boumans R, Costanza R. 2008. The Multiscale Integrated Earth Systems model (MIMES): The dynamics, modeling and valuation of ecosystem services. Issues in Global Water System Research, 2(2): 56-58.

[4]
Boykin K G, Kepner W G, Bradford D F, et al. 2013. A national approach for mapping and quantifying habitat-based biodiversity metrics across multiple spatial scales. Ecological Indicators, 33: 139-147.

DOI

[5]
Brown G, Brabyn L. 2012. The extrapolation of social landscape values to a national level in New Zealand using landscape character classification. Applied Geography, 35(1-2): 84-94.

DOI

[6]
Chen Y, Qiao F, Jiang L. 2016. Effects of land use pattern change on regional scale habitat quality based on InVEST model—A case study in Beijing. Acta Scientiarum Naturalium Universitatis Pekinensis, 52(3): 553-562. (in Chinese)

[7]
Cheng F Y, Liu S L, Hou X Y, et al. 2019. The effects of urbanization on ecosystem services for biodiversity conservation in southernmost Yunnan Province, Southwest China. Journal of Geographical Sciences, 29(7): 1159-1178.

DOI

[8]
Corvalán C F, Hales S, Mcmichael A J, et al. 2005. Ecosystems and human well-being: Health synthesis: A report of the millennium ecosystem assessment. Journal of Nanchang University, 25(2): 338-351.

[9]
Dai L M, Li S L, Lewis B J, et al. 2019. The influence of land use change on the spatial-temporal variability of habitat quality between 1990 and 2010 in Northeast China. Journal of Forestry Research, 30(6): 2227-2236.

DOI

[10]
Du S X, Rong Y J. 2015. The biodiversity assessment of land use in Shanxi Province based on InVEST model. Environment and Sustainable Development, 40(6): 65-70. (in Chinese)

[11]
Ellis E C, Pascual U, Mertz O. 2019. Ecosystem services and nature’s contribution to people: Negotiating diverse values and trade-offs in land systems. Current Opinion in Environmental Sustainability, 38: 86-94.

DOI

[12]
Forman R, Sperling D, Bissonette J, et al. 2003. Road ecology:Science and solutions. New York, USA: Island Press: 645-678.

[13]
Fu B J, Zhang L W. 2014. Land-use change and ecosystem services: Concepts, methods and progress. Progress in Geography, 33(4): 441-446. (in Chinese)

[14]
Gaglio M, Lanzoni M, Nobili G, et al. 2019. Ecosystem services approach for sustainable governance in a brackish water lagoon used for aquaculture. Journal of Environmental Planning and Management, 62(9): 1501-1524.

DOI

[15]
Gao Y, Ma L, Liu J X, et al. 2017. Constructing ecological networks based on habitat quality assessment: A case study of Changzhou, China. Scientific Reports, 7: 46073. DOI: 10.1038/srep46073.

DOI PMID

[16]
Gong J, Xie Y C, Cao E J, et al. 2019. Integration of InVEST-habitat quality model with landscape pattern indexes to assess mountain plant biodiversity change: A case study of Bailongjiang watershed in Gansu Province. Journal of Geographical Sciences, 29(7): 1193-1210.

DOI

[17]
Guo Z W, Zhang L, Li Y M. 2010. Increased dependence of humans on ecosystem services and biodiversity. Plos One, 5(10): 1-8.

[18]
Janus J, Bozek P. 2019. Land abandonment in Poland after the collapse of socialism: Over a quarter of a century of increasing tree cover on agricultural land. Ecological Engineering, 138: 106-117.

DOI

[19]
Kareiva P, Tallis H, Ricketts T H, et al. 2011. Natural capital:Theory and practice of mapping ecosystem services. New York, USA: Oxford University Press: 188-250.

[20]
Kazak J K, Chruciński J, Szewrański S. 2018. The development of a novel decision support system for the location of green infrastructure for stormwater management. Sustainability, 10(12): 4388. DOI: 10.3390/su10124388.

DOI

[21]
Kazak J K, van Hoof J. 2018. Decision support systems for a sustainable management of the indoor and built environment. Indoor and Built Environment, 27(10): 1303-1306.

DOI

[22]
Li X X. 1997. A preliminary study on mountain eco-environmental quality evaluation system in Beijing. Resources Science, 19(5): 31-35. (in Chinese)

[23]
Liang Y, Liu L. 2017. Simulating land-use change and its effect on biodiversity conservation in a watershed in Northwest China. Ecosystem Health & Sustainability, 3(5): 1-10.

[24]
Lin Y P, Lin W C, Wang Y C, et al. 2017. Systematically designating conservation areas for protecting habitat quality and multiple ecosystem services. Environmental Modelling & Software, 90: 126-146.

[25]
Liu F T, Xu E Q. 2010. Comparison of spatial-temporal evolution of habitat quality between Xinjiang corps and Non-corps region based on land use. Chinese Journal of Applied Ecology, 31(7): 2341-2351. (in Chinese)

[26]
Liu H, Cai Y, Yu M Q, et al. 2012. Assessment of river habitat quality in Yixing District of Taihu Lake Basin. Chinese Journal of Ecology, 31(5): 1288-1295. (in Chinese)

[27]
Liu M X. 2009. Biodiversity characters and eco-environment quality evaluation on nature reserve of Xihu in Dunhuang. Journal of Arid Land Resources and Environment, 23(3): 171-175. (in Chinese)

[28]
Liu Y, Huang X J, Yang H, et al. 2014. Environmental effects of land- use/cover change caused by urbanization and policies in Southwest China karst area—A case study of Guiyang. Habitat International, 44: 339-348.

DOI

[29]
Mashizi A K, Escobedo F J. 2020. Socio-ecological assessment of threats to semi-arid rangeland habitat in Iran using spatial models and actor group opinions. Journal of Arid Environments, 177: 104136. DOI: 10.1016/j.jaridenv.2020.104136.

DOI

[30]
McKinney M L. 2002. Urbanization, biodiversity, and conservation. Bioscience, 52(10): 883-890.

DOI

[31]
Mushet D M, Neau J L, Euliss N H Jr. 2014. Modeling effects of conservation grassland losses on amphibian habitat. Biological Conservation, 174(3): 93-100.

DOI

[32]
Niquisse S, Cabral P. 2018. Assessment of changes in ecosystem service monetary values in Mozambique. Environmental Development, 25: 12-22.

DOI

[33]
Ouyang Z Y, Zheng H. 2009. Ecological mechanisms of ecosystem services. Acta Ecologica Sinica, 29(11): 6183-6188. (in Chinese)

[34]
Peng J, Pan Y J, Liu Y X, et al. 2018. Linking ecological degradation risk to identify ecological security patterns in a rapidly urbanizing landscape. Habitat International, 71: 110-124.

DOI

[35]
Polasky S, Nelson E, Pennington D, et al. 2011. The impact of land-use change on ecosystem services, biodiversity and returns to landowners: A case study in the state of Minnesota. Environmental and Resource Economics, 48(2): 219-242.

DOI

[36]
Postek P, Leń P, Stręk Ż. 2019. The proposed indicator of fragmentation of agricultural land. Ecological Indicators, 103: 581-588.

DOI

[37]
Rands M R W, Adams W M, Bennun L, et al. 2010. Biodiversity conservation: Challenges beyond 2010. Science, 329(5997): 1298-1303.

DOI

[38]
Sherrouse B C, Semmens D J, Clement J M. 2014. An application of Social Values for Ecosystem Services (SolVES) to three national forests in Colorado and Wyoming. Ecological Indicators, 36(27): 68-79.

DOI

[39]
Tallis H, Ricketts T, Guerry A, et al. 2013. InVEST user’s guide: Integrated valuation of environmental services and tradeoffs. Stanford, USA: The Natural Capital Project.

[40]
Terrado M, Sabater S, Chaplin-Kramer B, et al. 2016. Model development for the assessment of terrestrial and aquatic habitat quality in conservation planning. Science of the Total Environment, 540: 63-70.

DOI

[41]
Wang L, Lv X. 2009. Analysis of the relief amplitude in Xinjiang based on digital elevation model. Science of Surveying and Mapping, 34(1): 113-116. (in Chinese)

[42]
Watson K B, Galford G L, Sonter L J, et al. 2019. Effects of human demand on conservation planning for biodiversity and ecosystem services. Conservation Biology, 33(4): 942-952.

DOI PMID

[43]
Wu J S, Cao Q W, Shi S Q, et al. 2015. Spatio-temporal variability of habitat quality in Beijing-Tianjin-Hebei Area based on land use change. Chinese Journal of Applied Ecology, 26(11): 3457-3466. (in Chinese)

[44]
Wu Y, Tao Y, Yang G S, et al. 2019. Impact of land use change on multiple ecosystem services in the rapidly urbanizing Kunshan City of China: Past trajectories and future projections. Land Use Policy, 85: 419-427.

DOI

[45]
Xie Y C, Gong J, Zhang S X, et al. 2018. Spatiotemporal change of landscape biodiversity based on InVEST Model and remote sensing technology in the Bailong River Watershed. Scientia Geographica Sinica, 38(6): 979-986. (in Chinese)

[46]
Yang J Q, Zhu Y G, Song W P, et al. 2014. The eco-environmental evaluation based on habitat quality and ecological response of Laizhou Bay. Acta Ecologica Sinica, 34(1): 105-114. (in Chinese)

[47]
Ye Y P, Liu L J. 2000. A preliminary study on assessment indicator system of provincial eco-environmental quality in China. Research of Environmental Sciences, 13(3): 33-36. (in Chinese)

[48]
Zhang J, Li X D, Chen C Y, et al. 2008. Analysis of the relief amplitude in Xinjiang. Journal of Lanzhou University (Natural Sciences), 2008(S1): 10-13, 19. (in Chinese)

[49]
Zhang X R, Zhou J, Li G N, et al. 2020. Spatial pattern reconstruction of regional habitat quality based on the simulation of land use changes from 1975 to 2010. Journal of Geographical Sciences, 30(4): 601-620.

DOI

[50]
Zhao G S, Liu J Y, Kuang W H, et al. 2015. Disturbance impacts of land use change on biodiversity conservation priority areas across China: 1990-2010. Journal of Geographical Sciences, 25(5): 515-529.

DOI

[51]
Zheng J K, Yu X X, Jia G D, et al. 2010. Dynamic evolution of ecological service value based on LUCC in Miyun Reservoir Catchment. Transactions of the Chinese Society of Agricultural Engineering, 26(9): 315-320. (in Chinese)

[52]
Zhong L N, Wang J. 2017. Evaluation on effect of land consolidation on habitat quality based on InVEST model. Transactions of the Chinese Society of Agricultural Engineering, 33(1): 250-255. (in Chinese)

Outlines

/