
Journal of Resources and Ecology >
Resident Willingness to Pay for Ecotourism Resources and Associated Factors in Sanjiangyuan National Park, China
|
MA Ting, E-mail: 17400198@muc.edu.cn |
Received date: 2020-12-04
Accepted date: 2021-02-25
Online published: 2021-11-22
Supported by
The National Key Research and Development Program(2017YFC0506501)
The Program for Ecological Innovation Team in Minzu University of China(2020CXTD02)
Willingness to Pay (WTP), Willingness to Work (WTW) and Willingness to Accept Compensation (WTA) are the three quantitative criteria for assessing local ecological asset values for the social aspects of ecosystem services and residents’ willingness to contribute to and receive compensation for tourism ecology. The objectives of this study are to estimate the residents’ willingness to pay, work and accept compensation for conservation at Sanjiangyuan National Park, and to analyze the relationship between residents’ attitude towards tourism ecology and the ecological assets of the National Park based on a standard questionnaire survey. The dichotomous choice Contingent Valuation Method (CVM) was employed to determine the willingness. The survey conducted in 2018 collected WTP, WTW, WTA, socio-demFographical information, social trust and resident perceptions toward tourism impacts and relevant management strategies from 244 residents in two counties. Based on generalized linear modeling, income and education level are important for residents’ WTP and WTA, but other social characteristics, such as gender and age, do not have significant effects. The social trust is found to be a significant factor on residents’ willingness, despite the limitation on education level. Also, government funding is associated with residents’ inclination to WTP, WTW and WTA, but the support levels differ among the two counties due to geographical and social heterogeneities. The estimated WTP, WTW and WTA for the Sanjiangyuan National Park in 2018 were 1.2448×10 7 yuan, 1.247×10 6 hours and 2.3232×10 7 yuan yr -1 based on the survey and published demographics. This study, for the first time, estimates the WTP, WTW and WTA for the Sanjiangyuan National Park and informs ecological conservation managers and policy makers. Ultimately, to maintain the long-term benefits arising from sustainable development, compensation should be specifically tailored and site-dependent, and development measures based on local resources should be adopted by governments to actively support eco-tourism activities.
MA Ting , MIN Qingwen , XU Kun , SANG Weiguo . Resident Willingness to Pay for Ecotourism Resources and Associated Factors in Sanjiangyuan National Park, China[J]. Journal of Resources and Ecology, 2021 , 12(5) : 693 -706 . DOI: 10.5814/j.issn.1674-764x.2021.05.012
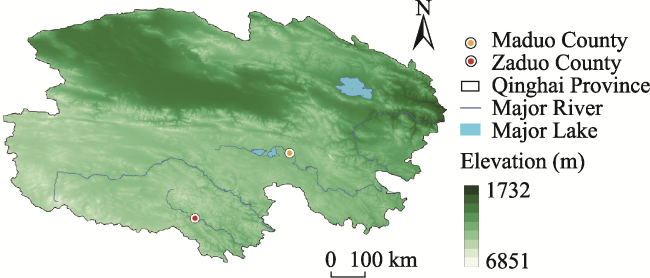
Fig. 1 Study sites in Sanjiangyuan area |
Table 1 Summary data for the variables collected from the mail survey conducted in Maduo and Zaduo counties |
| Variables | Maduo County | Zaduo County | Total |
|---|---|---|---|
| Number of responses received | 129 | 115 | 244 |
| Number of villages | 5 | 7 | 12 |
| Mean WTP in yuan yr-1 (Number of responses not willing) | 223 (39) | 162.8 (20) | 194.5 (59) |
| Mean WTW in hours yr-1 (Number of responses not willing) | 25.98 (8) | 12.12 (9) | 19.48 (17) |
| Mean WTA in yuan yr-1 (Number of responses not willing) | 372.5 (24) | 352.5 (19) | 363 (43) |
| Gender composition (M = Male, F = Female) | M78, F52 | M94, F20 | M172, F72 |
| Mean age in years | 33.82 | 38.81 | 36.17 |
| Mean annual personal income in yuan yr-1 | 26438 | 24508 | 25829 |
| Education level (P = Primary school, M = Middle school, H = High school, C = College) | P79, M9, H4, C8 | P52, M4, H11, C9 | P131, M13, H15, C17 |
| Mean number of household members | 3.155 | 4.336 | 3.738 |
| Mean family residency length in years | 32.12 | 37.43 | 34.62 |
| Degree of support for local development of ecology tourism (-1 = Negative, 0 = Neutral, 1 = Some support, 2 = Strong support) | -1, 0, 1, 2: 32, 23, 28, 41 | -1, 0, 1, 2: 6, 3, 88, 18 | -1, 0, 1, 2: 38, 26, 116, 59 |
| Priority for local conservation development (Eco = Ecology, Env = Environment) | Eco 10 Env 102 | Eco 13 Env 58 | Eco 23 Env 160 |
| Awareness of the largest impact of ecology tourism (A = Air, P = Plantation, R = Rock, S = Soil, W = Water, L = Wildlife) | A 17, P 51, R 10, S 17, W 11, L 23 | A 4, P 33, R 12, S 20, W 24, L 18 | A 21, P 84, R 22, S 37, W 35, L 41 |
| Heard ecology compensation policy or not (No = Not Heard, Yes = Heard) | No 59, Yes 61 | No 83, Yes 30 | No 142, Yes 91 |
| Proposed best ecology compensation method (Gov = Government, Don = Donation, Tax = Taxation, Tour = Tourism) | Gov 52, Don 33, Tax 25, Tour 12 | Gov 71, Don 5, Tax 2, Tour 25 | Gov 123, Don 38, Tax 27, Tour 37 |
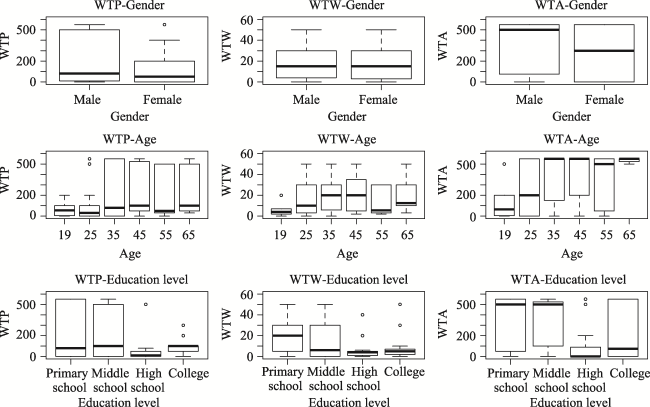
Fig. 2 Boxplots of WTP, WTW and WTA by gender, age, and education level. |
Table 2 Logistic and quasi-Poisson model output for willing to pay |
| Variable | Logistic model (Willing to pay) | quasi-Poisson model (WTP) | ||
|---|---|---|---|---|
| Coefficient | Standard error and significance | Coefficient | Standard error and significance | |
| County: Zaduo | -2.32 | 0.799 ** | -0.768 | 0.299 * |
| Degree of support for tourism: Neutral | 4.60 | 1.36 *** | 2.52 | 0.682 *** |
| Some support | 5.17 | 1.21 *** | 2.32 | 0.596 *** |
| Strong support | 3.61 | 1.01 *** | 1.93 | 0.569 *** |
| Awareness of the largest impact: Plantation | -0.054 | 0.953 | -0.270 | 0.451 |
| Rock | 0.906 | 1.61 | 1.23 | 0.946 |
| Soil | -1.25 | 1.05 | -0.486 | 0.481 |
| Water | 17.80 | 1032.00 | -0.324 | 0.582 |
| Wildlife | -0.402 | 1.02 | -0.321 | 0.449 |
| Heard ecological compensation policy: Yes | -0.496 | 0.592 | -0.235 | 0.288 |
| Proposed best ecology compensation method: Donation | -1.58 | 0.877 | -0.338 | 0.359 |
| Taxation | -2.40 | 1.12 * | -1.073 | 0.448 * |
| Tourism | 0.826 | 0.825 | -0.322 | -0.318 |
| Gender: Female | -0.508 | 0.572 | -0.420 | 0.287 |
| Mean age | 0.00323 | 0.0277 | 0.00828 | 0.0121 |
| Education level: Middle school | 0.144 | 0.968 | -0.219 | 0.415 |
| High school | -0.897 | 1.13 | -2.14 | 1.03 * |
| College | 1.59 | 1.38 | -0.847 | -0.553 |
| Annual income | 0.0000520 | 0.0000240 * | 0.0000207 | 0.00000901 * |
Note: Significance levels: * means 0.01<P<0.05, ** means 0.001<P<0.01, and *** means 0<P<0.001. |
Table 3 Logistic and quasi-Poisson model output for willing to work |
| Variable | Logistic model (Willing to work) | quasi-Poisson model (WTW) | ||
|---|---|---|---|---|
| Coefficient | Standard error and significance | Coefficient | Standard error and significance | |
| County: Zaduo | -3.18 | 1.17 ** | -1.65 | 0.207 *** |
| Degree of support for tourism: Neutral | 1.99 | 1.70 | -0.014 | 0.312 |
| Some support | 2.96 | 1.46 * | 0.281 | 0.215 |
| Strong support | 2.86 | 1.62 . | 0.417 | 0.173 * |
| Awareness of thelargest impact: Plantation | 0.763 | 1.08 | 0.994 | 0.322 ** |
| Rock | 0.160 | 11.85 | 0.805 | 0.451 . |
| Soil | 1.92 | 1.25 | 0.753 | 0.332 * |
| Water | 18.17 | 1799.00 | 0.771 | 0.381 * |
| Wildlife | 1.03 | 1.32 | 0.640 | 0.323 . |
| Heard ecological compensation policy: Yes | 1.81 | 0.947 . | -0.182 | -0.178 |
| Proposed bestecology compensation method: Donation | -1.96 | 1.27 | -0.438 | 0.216 * |
| Taxation | -3.94 | 1.69 * | -0.907 | 0.262 *** |
| Tourism | 0.414 | 1.26 | -0.429 | 0.197 * |
| Gender: Female | -1.00 | 0.805 | -0.204 | 0.155 |
| Mean age | 0.00751 | 0.0563 | 0.00218 | 0.00729 |
| Education level: Middle school | -1.99 | 1.17 | -0.327 | 0.319 |
| High school | -0.850 | 1.23 | -0.453 | 0.366 |
| College | -0.959 | 1.51 | -0.319 | 0.296 |
| Annual income | 0.0000339 | 0.0000359 | -0.00000239 | 0.00000529 |
Note: Significance levels: * means 0.01<P<0.05, ** means 0.001<P<0.01, and *** means 0<P<0.001. |
Table 4 Logistic and quasi-Poisson model output for willing to accept compensation |
| Variables | Logistic model (Willing to accept compensation) | quasi-Poisson model (WTA) | ||
|---|---|---|---|---|
| Coefficient | Standard error and significance | Coefficient | Standard error and significance | |
| County: Zaduo | -1.48 | 0.698 * | -0.886 | 0.203 *** |
| Degree of support for tourism: Neutral | 0.374 | 1.24 | 0.349 | 0.394 |
| Some support | 1.00 | 0.923 | 0.334 | 0.228 |
| Strong support | 0.860 | 0.945 | 0.277 | 0.194 |
| Awareness of the largest impact: Plantation | -1.02 | 0.940 | -0.145 | 0.353 |
| Rock | -0.916 | 1.43 | -0.202 | 0.500 |
| Soil | -0.846 | 1.05 | -0.734 | 0.364 * |
| Water | -1.90 | 1.18 | -0.844 | 0.477 |
| Wildlife | -0.731 | 1.14 | -0.478 | 0.349 |
| Heard ecological compensation policy: Yes | 0.232 | 0.637 | -0.380 | 0.207 |
| Proposed best ecology compensation method: Donation | -2.89 | 0.958 ** | -1.31 | 0.305 *** |
| Taxation | -4.00 | 1.08 *** | -2.51 | 0.455 *** |
| Tourism | -1.36 | 0.777 | -0.854 | 0.257 ** |
| Gender: Female | 0.0633 | 0.607 | -0.0669 | 0.169 |
| Mean age | -0.00669 | 0.0317 | -0.000680 | 0.00739 |
| Education level: Middle school | -0.206 | 1.02 | 0.197 | 0.299 |
| High school | -3.27 | 1.04 ** | -1.42 | 0.484 ** |
| College | -0.685 | 1.22 | -0.367 | 0.325 |
| Annual income | -0.0000419 | 0.0000241 | -0.00000430 | -0.00000593 |
Note: Significance levels: * means 0.01<P<0.05, ** means 0.001<P<0.01, and *** means 0<P<0.001. |
| [1] |
|
| [2] |
|
| [3] |
|
| [4] |
|
| [5] |
|
| [6] |
|
| [7] |
|
| [8] |
|
| [9] |
|
| [10] |
|
| [11] |
|
| [12] |
|
| [13] |
|
| [14] |
|
| [15] |
|
| [16] |
|
| [17] |
|
| [18] |
|
| [19] |
|
| [20] |
|
| [21] |
|
| [22] |
|
| [23] |
|
| [24] |
|
| [25] |
|
| [26] |
|
| [27] |
|
| [28] |
|
| [29] |
|
| [30] |
|
| [31] |
|
| [32] |
|
| [33] |
|
| [34] |
|
| [35] |
|
| [36] |
|
| [37] |
|
| [38] |
|
| [39] |
|
| [40] |
|
| [41] |
|
| [42] |
|
| [43] |
|
| [44] |
Sanjiangyuan National Park Administration. 2018. Sanjiangyuan National Park overall plan. http://sjy.qinghai.gov.cn
|
| [45] |
|
| [46] |
|
| [47] |
|
| [48] |
|
| [49] |
|
| [50] |
|
| [51] |
|
| [52] |
|
| [53] |
|
| [54] |
|
| [55] |
|
| [56] |
|
| [57] |
|
| [58] |
|
| [59] |
|
| [60] |
|
| [61] |
|
| [62] |
|
| [63] |
|
| [64] |
|
| [65] |
|
| [66] |
|
| [67] |
|
| [68] |
|
| [69] |
|
| [70] |
|
| [71] |
|
| [72] |
|
| [73] |
|
| [74] |
|
/
| 〈 |
|
〉 |