Ecosystem Assessment

Composition and Regeneration of Trees in the Community Forests of Lamjung District, Nepal

  • Tilak Babu CHAPAGAI , 1, * ,
  • Dipak KHADKA , 2, 3, 4, * ,
  • Dinesh Raj BHUJU 1, 5 ,
  • Narendra Raj KHANAL 6 ,
  • SHI Shi 2 ,
  • CUI Dafang 2
Expand
  • 1. Central Department of Environmental Science, Tribhuvan University, Kirtipur 44618, Nepal
  • 2. Guangdong Key Laboratory for Innovative Development and Utilization of Forest Plant Germplasm, College of Forestry and Landscape Architecture, South China Agricultural University, Guangzhou 510642, China
  • 3. Golden Gate International College, Tribhuvan University, Kathmandu 4059, Nepal
  • 4. Environment Protection and Study Center, Kathmandu 44600, Nepal
  • 5. Nepal Academy of Science and Technology, Lalitpur 3323, Nepal
  • 6. Central Department of Geography, Tribhuvan University, Kirtipur 44618, Nepal
Tilak Babu CHAPAGAI, E-mail:
Dipak KHADKA, E-mail:

Received date: 2020-10-01

  Accepted date: 2021-03-02

  Online published: 2021-11-22

Abstract

The community forest program in Nepal is one of the successful conservation initiatives. Tree species in a forest ecosystem have a fundamental role in maintaining the vegetation structure, complexity, and heterogeneity. This study analyzes the composition and regeneration of tree species in five community forests (CFs) of the sub-tropical region, Lamjung district, Nepal for preparing baseline data for long-term research projects and helps the community to manage their CFs scientifically. Tree species data were generated by stratified random sampling using 35 quadrate plots (size: 20 m x 20 m). The density of adult trees in the forests ranged from 575 Ind ha -1 (Tilahar CF) to 1196 Ind/ha (Deurali Thadopakha CF). The sapling ranged from 2533 Ind ha -1 (Tilahar CF) to 4000 Ind ha -1 (Thuliban CF) and seedling from 19583 Ind ha -1 (Tilahar CF) to 37500 Ind ha -1 (Thuliban CF). Similarly, the adult tree basal area varied from 28.34 m 2 ha -1 (Tilahar CF) to 49 m 2ha -1 (Deurali CF). The adult tree diversity index (Shannon-Weiner’s H) also ranged from 1.08 (Thuliban CF) to 1.88 (Tilahar CF). The tree species such as Sapium insigne, Ficus benghalensis, Lagerstroemia parviflore, Albizia sp. and Pinus roxburghii were weak regeneration. In general, the forests have good regeneration status except for Tilahar Community Forest, but based on the DBH size class distribution diagram, there is no sustainable regeneration. Among the five community forests the DBH size of adults was significantly different, and the DBH of Deurali Thadopakha was the lowest. But only few species have good regeneration and most of the species have weak, poor to no regeneration. The dominancy of fewer species like Shorea robusta, Castanopsis indica, and Schima wallichii accordingly maintain the overall regeneration of tree of CFs, so further plantation needs to be done inside the CF by triage accordingly those species whose regeneration has poor.

Cite this article

Tilak Babu CHAPAGAI , Dipak KHADKA , Dinesh Raj BHUJU , Narendra Raj KHANAL , SHI Shi , CUI Dafang . Composition and Regeneration of Trees in the Community Forests of Lamjung District, Nepal[J]. Journal of Resources and Ecology, 2021 , 12(5) : 658 -668 . DOI: 10.5814/j.issn.1674-764x.2021.05.009

1 Introduction

The community forestry program in Nepal is believed as one of the successful programs in forest management in Nepal (Shrestha et al., 2010). The different conservation strategies are often delivered in such forests for better forest conservation. The reliable and timely information on tree species composition, regeneration, and diversity of trees is fundamental for the implementation of forest conservation strategy (Baboo et al., 2017). This information is also helpful for planning and implementing conservation strategies for the community forests (Malik and Bhatt, 2015). The composition and regeneration status of trees show the health status of the forest (Nur et al., 2016). In forest management, regeneration studies provide information on the current status and suggest the possible changes in forest composition in the future (Malik and Bhatt, 2016). The species richness, densities of different stages (seedlings, saplings, and adults) of trees, species distribution pattern, and population structure of trees are often used to know the composition of trees in a forest (Rahayu et al., 2017). Species diversity is a major component that directly regulates the community structure of forests and also the biological foundation for maintaining ecosystem function (Tilman and Dowing, 1994).
The number of seedlings, saplings, and the adult count is employed to know the regeneration status of trees in the forest (Teketay, 1996). Furthermore, the assessment of distribution diameter at breast height (DBH) of trees fitting Weibull’s distribution of trees provides ideas about tree regeneration and disturbance status in different forests (Sapkota et al., 2018). The inverse J-shaped distribution of DBH of trees indicates sustainable regeneration, whereas a mound-shaped distribution of DBH of trees indicates unsustainable regeneration in old-growth forests (West et al., 1981; Leak, 2002). This study has adopted two parametric Weibull’s distributions to assess DBH size class distribution as it can predict well even in a fewer number of plots (Mcgarrigle et al., 2011). The forest wise comparison of DBH size class distribution of trees is helpful in decision making during the process of preparing and implementing forest conservation-related interventions.
In the subtropical region of Nepal, the low species richness of trees, high regeneration status, and Shorea robusta dominated forest have been reported (Sapkota et al., 2009; Awasthi et al., 2015). The community forest program has been promoting species composition and regeneration status of trees (Paudel and Sah, 2015; Mandal et al., 2016). The numbers of community forest user groups (CFUGs) are located (DoF, 2014).
Ecosystem-based Adaptation (EbA) is gaining momentum in the field of climate change as adaptation toolboxes to adjust the impacts of climate change (Travers et al., 2012). In Nepal, it has been empowering local communities and ensuring the sustainability of forests, and promoting the livelihoods of local people under climate change scenarios (Park and Alam, 2015; Niraula and Pokharel, 2016). The Government of Nepal is undertaking the EbA South project, which aims at building climate resilience by promoting the approach of EbA through capacity building, knowledge support, and field-level interventions. This project (EbA-South) selected two sites of Lamjung in Nepal. Accordingly, it has established a long-term monitoring site at Besisahar Municipality-11, Chiti, Lamjung involving local community forest user groups (Bhuju and Bogati, 2019). In this context, this study assessed the floristic composition and regeneration status of tree species in five different community forests where the EbA project is functional. These data (generated by this study) will be taken as baseline information: there is no such data available before this study on tree species composition and regeneration. For long-term research, this data will be remarkable and recommendations will be encomium. The findings of this study support the EbA managers and locals to get future directions for making different interventions.

2 Materials and methods

2.1 Study area

The study was carried out in community forests located at the Besishahar municipality, ward number-11, Lamjung District, Central Nepal, where the EbA south project intervention has been ongoing (Fig. 1). The elevation of the study area ranges from 670 m to 1260 m and the slope varies from 7° to 52°, where the study was undertaken in five community forests at Chiti (Table 1). In this region, the maximum temperature in the study area is 26.67 ℃ and the minimum temperature is 14.08 ℃, whereas the annual mean rainfall is 2944.23 mm (DFO, 2016). Besides, forests are generally sub-tropical. Dominant trees are Shorea robusta, Schima wallichii, Castanopsis indica, and Pinus roxburghii.
Table 1 General characteristics of the community forests (CF) selected for study in Lamjung District, Nepal.
Name of CF Area (ha) Altitude (m) Latitude Longitude Dominant species
Satipatal (SCF) 66.77 807 28°10°39.15N 84°26°41.87E Shorea robusta
Thuliban (TBCF) 24.22 803 28°11°15.90 N 84°26°8.51E Shorea robusta
Deurali (DCF) 57.67 887 28°11°47.08 N 84°25°46.66E Castanopsis indica
Deurali Thadopakha (DTCF) 19.34 1114 28°12°36.82 N 84°26°18.74E Castanopsis indica
Tilahar (TCF) 44.11 1140 28°12°27.49N 84°26°13.39E Schima wallichii

2.2 Sampling

The study sites were chosen purposefully and square quadrates were laid using a stratified random sampling method using a random number table. The total number of quadrates in each community forest was fixed by taking the 0.5% sampling intensity. Sample quadrate of size 20 m × 20 m for a tree, 5 m × 5 m for a sapling, and 1 m × 1 m for seedlings (Kflay and Kitessa, 2014) were fixed. In each quadrate, sapling numbers were taken from two corners diagonally and seedling numbers were taken in every four corners of the quadrate. In five community forests, a total of 35 quadrates were taken for the tree, 70 nested quadrates were taken for a sapling and 140 nested quadrates were taken for the seedling. The individual is considered, as an adult if diameter at breast height DBH is ≥ 5 cm, as sapling if DBH is between 1 cm and 5 cm, and seedling if the height is less than 1.37 m (Timilsina et al., 2007). For the adult layer and sapling layer, (DBH, measured at 137cm above the ground) of individuals using DBH tape, height was measured using a clinometer. In the seedling layer of the tree, the total number of individuals of each species was counted. Through GPS (Garmin-GPS map 62 SC), the information about elevation, longitude, latitude, and aspects was noted. Unidentified specimens of the plants in the field were collected in herbarium sheet and further identified in the Central Department of Botany, Tribhuvan University; Kirtipur through botanical nomenclature following Press et al. (2000).
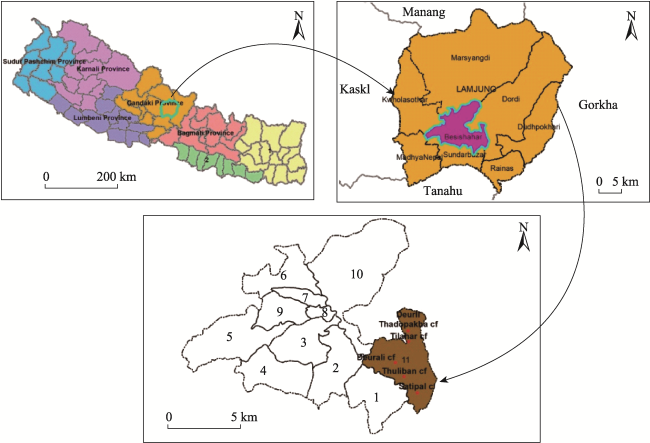
Fig. 1 Map of the study area showing studied community forest of Lamjung District,Nepal

Note: The numbers from 1-11 are the respective wards of Besishahar Municipality.

2.3 Quantitative data analysis

The field data were used to calculate frequency, density, basal area, and importance value index according to Kent and Coker (1992). The Importance Value Index was calculated using the formula given by Curtis and Mclntosh (1951). Species diversity was calculated by using the formula given by Shannon and Weiner (1949) as:
H = ‒Σ Pi.×ln Pi
where H is Species Diversity Index; Pi is proportion of the species (Pi = ni / N); where, N is the total importance value of plants, ni is importance value of each species.
The Simpson concentration of dominance (Simpson, 1949) was measured as:
$Cd=\sum{{{\left( \frac{{{n}_{i}}}{N} \right)}^{2}}}$
D=1-Cd
where D is the Simpson’s diversity Index; Cd is the Simpson’s concentration of dominance; N is the total importance value of plants; ni is the importance value of each species.
The summary of the DBH of trees in each community forest was calculated using R and skewness was determined using the Bowley coefficient of skewness (Zar, 1999):
Skewness = (Q3+ Q1-2Q2)/(Q3Q1)
where, Q3: Third quartile; Q1: First quartile; Q2: Second quartile (median). The Bowley coefficient of skewness ranges from 1 to 1.1 for distribution with an extreme left skewness 0 for asymmetrical distribution and 1 for distribution with extreme right skewness (Zar, 1999).
All adult trees (≥ 5 cm) were divided into DBH class of starting with less than 10 cm in groups (0-10) and the range of other classes were kept at 10 cm difference. The two parametric Weibull’s distribution was fitted to find the forest wise regeneration of Tree.
$f(D)=\frac{c}{b}\times {{\left( \frac{D}{b} \right)}^{1/c}}\times {{\text{e}}^{-{{\left( \frac{D}{b} \right)}^{c}}}}$
where f(D) is probability density function; D is Weibull’s variate (DBH with D1, D2 ,…., Dn of sample size n); b is scale parameter of Weibull distribution; c is shape parameter of Weibull distribution; Changing the shape parameter (c) Weibull distribution can model wide varieties of data (Bailey and Dell, 1973; Nord and Cao, 2006). If c = 1, Exponential distribution; c > 1, mound shaped distribution (approximately equal to normal distribution for c = 3.6, for c = 2, Rayleigh distribution for c= 1 and 3.6 the Weibull distribution is positively skewed (right skewed) and for c>3.6 negatively skewed (left skewed), and e is the natural constant .
The regeneration status of individual species was determined by using the following criteria given by Shankar (2001): 1) ‘good’, if seedling > sapling >adult; 2) ‘fair’, if seedling or sapling > adult; 3) ‘poor’, if species survives in only sapling stage but not as seedling; 4) ‘none’, if a species is an absence in both in sapling and seedling stage; 5) ‘new’, if a species has no adult but only sapling or seedling or both.
The Shapiro test was performed to test the normality of all the DBH of trees. Since the data was not normal, the Kruskal Wallis test was performed to test the differences of DBH with different forests.

3 Results

3.1 Composition of trees

A total of 432 individuals in adults, 144 individuals in saplings, and 113 individuals in seedlings of tree species having 11 species with their respective families were recorded at SCF (Satipatal Community Forest). A total of 195 individuals in adult, 100 individuals in a sapling, and 75 individuals in seedling of tree species having 5 species with their respective families were recorded at TBCF (Thuliban Community Forest). A total of 344 individuals in adult, 134 individuals in sapling, and 88 individuals in seedling of tree species having eight species with their respective eight families were recorded from the southern aspect, DCF. Casearia graveolens and Mallotus sp. were only found in DCF (Deuali Community Forest). Accordingly, a total of 287 individuals in adult, 110 individuals in sapling, and 67 individuals in seedling of tree species having 10 species with their respective families were recorded from northern aspect DTCF (Deurali Thadopakha Community Forest). Ficus benghalensis, Myrica esculenta, Fraxinus floribunda, Cleistocalyx operculate were reported only in DTCF. A total of 138 individuals in adult, 76 individuals in sapling, and 47 individuals in seedling of tree species having 12 species with their respective families were recorded at TCF (Tilahar Community Forest) (Table 2 and Fig. 2).
Table 2 The number of recorded species
Serial number Name of CFs Number of adult Number of sapling Number of seedling
1 Satipatal 432 144 113
2 Thuliban 195 100 75
3 Deurali 344 134 88
4 Deurali Thadopakha 287 110 67
5 Tilahar 138 76 47
The adult density was the highest (1196 Ind ha-1 at DTCF, sapling density was highest (4000 Ind ha-1) calculated at TBCF and seedling density was highest (37500 Ind ha-1) more at TBCF (Table 3).
Table 3 Community Structure of trees in community forests
Indices Tree layer SCF TBCF DCF DTCF TCF Average
Density (Ind ha-1) Sapling 2880 4000 3350 3667 2533 3286
Seedling 28250 37500 27500 27917 19583 28150
Basal Area/Abundance (BA/A) Adult 42.50 46.80 49.00 37.73 28.34 40.87
Sapling 17.60 14.40 15.69 19.17 19.40 17.25
Seedling 10.41 10.73 8.62 19.37 14.06 12.64
Shannon-Weiner’s Adult 1.17 1.08 1.37 1.66 1.88 1.43
diversity index (H) Sapling 2.00 2.02 2.16 1.81 2.03 2.00
Seedling 1.81 2.02 2.16 2.50 2.49 2.20
Simpson’s diversity Adult 0.38 0.41 0.50 0.57 0.70 0.51
index (D) Sapling 0.71 0.71 0.71 0.61 0.67 0.68
Seedling 0.65 0.71 0.74 0.79 0.76 0.73
Species richness (S) 11 5 8 10 12 9

Notes: SCF= Satipatal Community Forest; TBCF= Thuliban Community Forest; DCF=Deurali Community Forest; DTCF= Deurali Thadopakha Community Forest; TCF= Tilahar Community Forest.

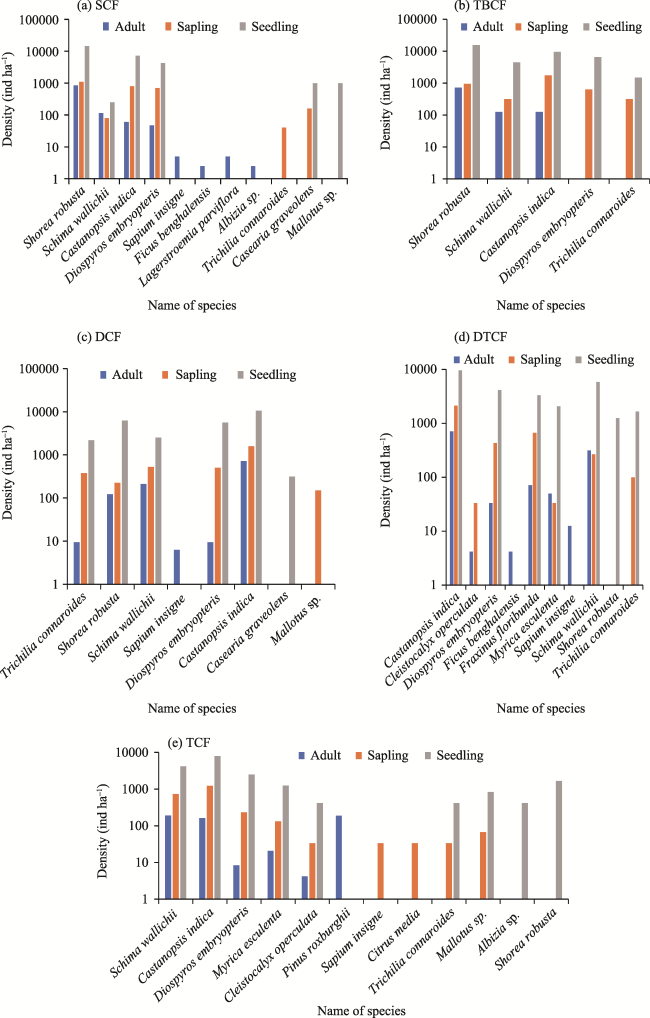
Fig. 2 Adult, sapling, and seedling densities in different communities forests (CFs) of Lamjung District, Nepal.
The species-IVI curve shows the species importance in a particular forest. From the studied forest, the result showed that Shorea robusta was the most important species in SCF and TBCF. Castanopsis indica was the most important species in DCF and DTCF. Schima wallichii was the most important species in the TCF (Table 4).
Table 4 Species-IVI value in different CFs
Name of species SCF TBCF DCF DTCF TCF Average
Albizia sp. 3.58 0 0 0 0 0.72
Castanopsis indica 30.52 50.32 122.43 119.29 67.26 77.96
Cleistocalyx operculate 0 0 0 5.70 7.15 2.57
Diospyros embryopteris 22.67 0 9.07 13.29 9.50 10.91
Ficus benghalensis 3.58 0 0 6.49 0 2.01
Fraxinus floribunda 0 0 0 17.78 0 3.56
Lagerstroemia parviflora 3.89 0 0 0 0 0.78
Myrica esculenta 0 0 0 20.80 24.91 9.14
Pinus roxburghii 0 0 0 0 79.41 15.88
Sapium insigne 4.03 0 8.31 11.10 0 4.69
Schima wallichii 44.34 64.62 92.53 115.08 111.76 85.67
Shorea robusta 187.39 185.06 58.99 0 0 86.29
Trichilia connaroides 0 0 8.67 0 0 1.73

Notes: SCF= Satipatal Community Forest; TBCF= Thuliban Community Forest; DCF=Deurali Community Forest; DTCF= Deurali Thadopakha Community Forest; TCF= Tilahar Community Forest.

3.2 Population structure of trees in different forests

The population structures of Deurali, Satipatal, Deurali Thadopakha, Thuliban and Tilahar (Table 5 and Fig. 3).
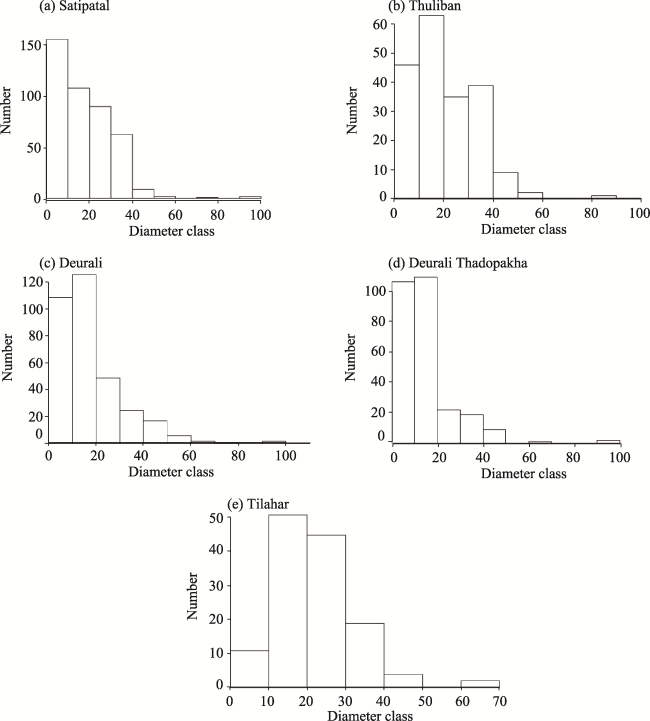
Fig. 3 Population structure of adults of different community forests of Lamjung, number of trees recorded in Y axis (Number) and diameter at breast height (DBH) in centimeter (cm) (Diameter class) in X axis.
Table 5 Summary of DBH in different forests of Lamjung
Parameterss SCF TBCF DCF DTCF TCF
Mean 27.00 31.00 19.09 15.80 26.00
Max. 97.00 90.00 110.00 97.00 65.00
Min 5.00 5.00 5.00 5.00 5.00
Q1 8.00 11.00 9.00 8.07 18.00
Q2 16.00 19.00 15.00 12.00 22.00
Q3 18.90 31.00 24.00 18.00 26.00
Bowely coefficient of skewness -0.47 0.20 0.20 0.21 0.00

Note: SCF= Satipatal Community Forest; TBCF= Thuliban Community Forest; DCF=Deurali Community Forest; DTCF= Deurali Thadopakha Community Forest and TCF= Tilahar Community Forest.

From the Weibul distribution fitting in the DBH of adults, the DBH of adults of all the forests showed that the distribution is the mound-shaped as the value of c > 1 and positively right skewed as the value of c is between 1.43 and 2.42 (Table 6).
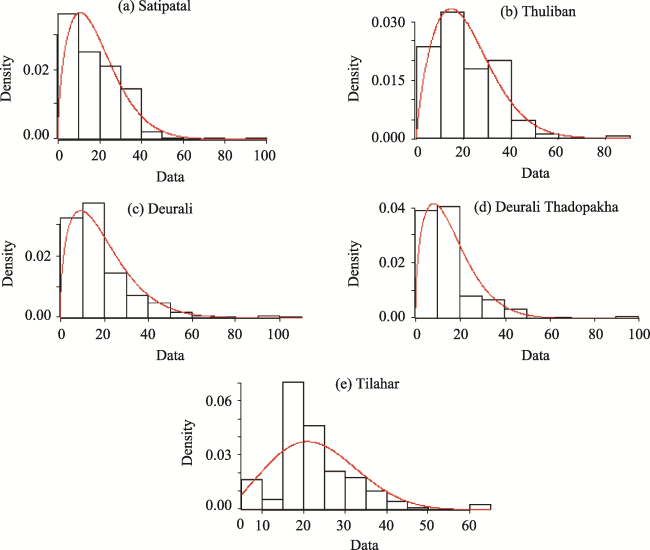
Table 6 Shape and scale parameters (with standard errors) of Weibull distribution for different CFs indicated Weibul distribution of DBH of trees of all the five studied forests are in mound shaped
Community Forest Weibul shape parameter (Standard errors ) Weibul scale parameter (Standard error)
Satipatal 1.56 (0.06) 20.69 (0.68)
Thuliban 1.74 (0.09) 23.78 (1.04)
Deurali 1.43 (0.06) 21.21 (0.86)
Deurali Thadopakha 1.57 (0.07) 18.93 (0.73)
Tilahar 2.42 (0.15) 25.95 (0.98)

Note: The number in the bracket are standard error.

The probabilities of densities in different sites were found different from each other showing mound-shaped distribution (Fig. 4). The Tilahar is near to the normal distribution followed by Thuliban.
The median DBH size of trees was found higher in the Tilahar community forest and less in Deurali Thadopakha community forest (Fig. 5). The DBH size of tree was significantly different in different forest (Kruskal-Wallis chi-squared = 65.331, df = 4, P < 0.01).
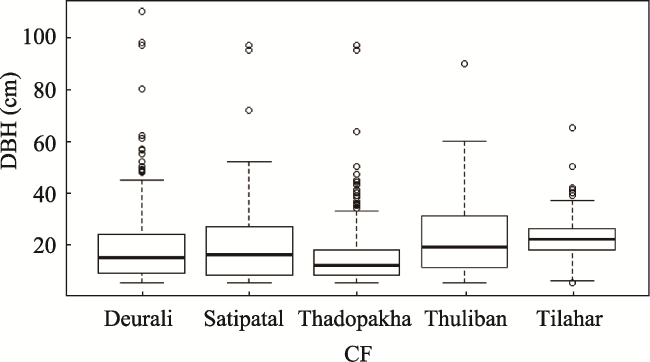
Fig. 5 Comparison of diameter at breast height (DBH) in centimeter (cm) size class distribution of trees in different community forests (CF) of Lamjung District, Nepal.

3.3 Regeneration status of trees in CFs

Shorea robusta, Schima wallichii, Castanopsis indica and Diospyros embryopteris were recorded in all forms i.e. adult, seedling, and sapling at SCF. Shorea robusta, Schima wallichii and Castanopsis indica were recorded in its all forms i.e. adults, seedlings and saplings at TBCF. Trichilia connaroides, Shorea robusta, Schima wallichii, Diospyros embryopteris, Castanopsis indica were recorded in all forms i.e. adults, seedlings and saplings at DCF. Castanopsis indica, Diospyros embryopteris, Fraxinus floribunda, Myrica esculenta and Schima wallichii were found with more density on adults, saplings and seedlings at DTCF. Castanopsis indica, Diospyros embryopteris, Cleistocalyx operculata, Myrica esculenta, Schima wallichii were found with more density on adults, saplings and seedlings at TCF (Fig. 2). The information on adult, sapling, and seedling showed a different level of regeneration status at studied forests at the species level (Table 7).
Fig. 4 Probability Density Function Weibul in Y axis for Weibull Distribution plotted with data (DBH classes of trees in cm) of studied forests in X axis starting from Satipatal followed by Thuliban, Deurali, Deurali Thadopakha, and Tilahar respectively from the top left side.

4 Discussion

The adult density of five community forests varies from 575 Ind ha-1 (TCF) to 1196 Ind ha-1 (DTCF). The average adult density in the study area was 980.17 Ind ha-1 which is higher than the value (786.5 Ind ha-1 and 773.5 Ind ha-1) reported by Bhuju and Yonzon (2004) from the Churiya region of eastern and central Nepal respectively. That implies the Community forest gain positive momentum in forest conservation and that verify sub-tropical CFs from the increment of overall forest tree species densities. The result is higher than 743 Ind ha-1 reported from the Shorea robusta forest of Lamjung (Rai et al., 1999) indicating that community forest management strategies have a positive impact on forest management and improvement. Both Shorea robusta dominated forest i.e. STB (1080 Ind ha-1) and TBCF (975 Ind ha-1) had a higher density than reported from Shorea robusta forest of Gorakhpur India i.e. 814 Ind ha-1 (Shukla and Pandey, 2000) and west Himalaya 243-843 Ind ha-1 (Gairola et al., 2008), except TCF. In TCF, lowering the rate of tree density prevails; deluge trampling, and human encroachment.
Table 7 Species regeneration status of community forests
Name of species Local name Family SCF TBCF DCF DTCF TCF
Shorea robusta Sal Dipterocarpaceae G G G N N
Schima wallichii Chilaune Theaceae F G G F G
Castanopsis indica Katush Fagaceae G G G G G
Diospyros embryopteris Tindu Ebeniaceae G N G G G
Sapium insigne Khirro Euphorbiaceae NO NO NO N
Ficus benghalensis Bar Moraceae NO NO
Lagerstroemia parviflora Bot dhayaro Lythraceae NO
Albizia sp. Siris Leguminosae NO N
Trichilia connaroides Ankhatare Meliaceae N N G N N
Casearia graveolens Badkamlo Salicaceae N N
Mallotus sp. Sindhure Euphorbiaceae N N N
Cleistocalyx operculate Kyamuna Myrtaceae P G
Fraxinus floribunda Lankure Oleaceae G
Myrica esculenta Kaphal Myricaceae F G
Citrus media Bimiro Rutaceae NO
Pinus roxburghii Salla Pinaceae N

Note: G = Good, F = Fair, P = Poor, N = New, NO = None, ― = Absence of given species; SCF= Satipatal Community Forest; TBCF= Thuliban Community Forest; DCF=Deurali Community Forest; DTCF= Deurali Thadopakha Community Forest; TCF= Tilahar Community.

The sapling density of five community forests varied from 2533 Ind ha-1 (TCF) to 4000 Ind ha-1 (TBCF). The result is in between 2200-8333 Ind ha-1 reported from west Himalaya (Gairola et al., 2008). The seedling density of five Community forests varies from 19583 Ind ha-1 (TCF) to 37500 Ind ha-1 (TBCF). The result is higher than 1867-10137 Ind ha-1 reported from the west Himalaya (Gairola et al., 2008) but lower than Sapkota et al. (2009). In Shorea robusta forest seedlings number is often higher than the number of seedlings of other species but when it turns into saplings then its ratio is highly decreased in terms of comparing to other species. The ratio of seedling to sapling number is 17:1 which is higher than other tree species i.e. Schima wallichii (9:1). This also indicates the Shorea robusta species seedling has higher die-off nature from the cold and warm environment.
Tree basal area of study areas varies from 28.34 m2 ha-1 (TCF) to 49.00 m2 ha-1 (DCF). The average basal area of tree species in the sub-tropical region from the current study was 40.87 m2 ha-1 which was higher (37.38 m2 ha-1 and 33.10 m2 ha-1) than reported by Bhuju and Yonzon (2004) from Churiya region of eastern and central Nepal respectively. The result is similar to (28.40-35.10 m2 ha-1 ) reported in a natural forest of Uttarakhand Himalaya (Arya and Ram, 2011) but higher than (21.35-27.50 m2 ha-1 ) reported from pure and undisturbed forests respectively in lesser Hindukush and Himalaya (Khan et al., 2011). The present result in the basal area was lower than the study of Pandey and Shukla (2003) in India. Both Shorea robusta dominated forest’s tree basal area i.e. SCF (42.50 m2 ha-1) and TBCF (46.80 m2 ha-1) have a higher value than 30.62 m2 ha-1 reported from Shorea robusta forest of Lamjung (Rai et al., 1999).
The diversity of trees is fundamental to total forest biodiversity because trees provide resources and habitat for most other forest species (Huang et al., 2003). The adult tree diversity of community forests of study sites has ranged from 1.08 (TBCF) to 1.88 (TCF). The present result in tree diversity is between the 0.88-2.11 reported by Giri et al. (2008) , lower the value range varies from 2-3 reported from the temperate forest (Risser and Rice, 1971). Sapling diversity range varies from 1.81 (DTCF) to 2.16 (DCF). The result is higher than 0.17-0.41 cited by Bhakuni et al. (2015) and the seedling diversity range varies from 1.81 (STC) to 2.50 (DTCF) which is higher than 0.25-0.46 cited reported by Bhakuni et al. (2015) . The Simpson’s diversity index ranges on adult tree calculated in between 0.38(SCF)-0.70 (TCF), on sapling of tree calculated in between 0.61 (DTCF)-0.71 (SCF, TBCF, DCF), on seedling of tree species calculated in between 0.65 (SCF)-0.79 (DTCF). Tree species diversity mainly varied from forest to forest due to variation in habitat and bio-geography (Sagar et al., 2003). Low species richness indicates the association with the dominance of one or few species (Hernandez et al., 2012). TBCF has low species richness (five types of species) forest than the other CF and it has highly Shorea robusta dominancy.
DBH distribution of trees gives a better indication and is used to represent the population structure of the forest (Khan et al., 1987). The present study shows SCF, TBCF, DCF, and DTCF have mound-shaped distribution. The mound-shaped size class diagram indicating unsustainable regeneration (Vetaas, 2000), there is disturbances in the forest and future communities may be unstained (Sarkar and Devi, 2014).
The species were found with different levels of regeneration in different forests. Shorea robusta has good regeneration at SCF, TBCF, and DCF. Castanopsis indica has good regeneration at all five CFs. Schima wallichii has good regeneration at TBCF, DCF, and TCF. Diospyros embryopteris has good regeneration at SCF, DCF DTCF, and TCF. Trichilia connarodes has good regeneration at DCF. Fraxinus floribunda has good in regeneration at DTCF only. Cleistocalyx operculata and Myrica esculenta have good regeneration at TCF only (Table 7). The species only with an adult but no seedling and sapling have a risk of local extinction in the future (Dalling et al., 1998) and those trees show poor regeneration. Sapium insigne, Ficus benghalensis, lagerstroemia parviflore, Albizia sp., and Pinus roxburghii have poor regeneration and indicating future risk in terms of regeneration.

5 Conclusions

The study forests have low species richness and diversity. The overall density of adults, saplings, and seedlings of the study area indicate a good and incremental scenario. The DBH size class distribution curve of tree species showed mound-shaped distribution in all forests indicating a problem in the regeneration of trees. Mainly topmost three/four dominant species maintain the overall forest regeneration. Shorea robusta, species sapling number highly decreased when it turned from seedling due to low survival rate through dying off. A community forest management plan should be formulated furthermore by considering the species composition and their regeneration status based on the result presented in this study.

Acknowledgments

The authors are thankful to Sher Bahadur Gurung, Haribansha Acharya-the chairperson of DSCO from Lamjung, and people relevant to the respective CFUGs for providing all the information about study sites.

Funding

This work was partially supported by the project “Ecosystem- based Adaptation through South-South Cooperation (EbA South)”, which is a full-sized GEF project, funded through the Special Climate Change Fund. Officially known under the title “Enhancing Capacity, Knowledge and Technology Support to Build Climate Resilience of Vulnerable Developing Countries”, the project is implemented by United Nations Environment Programme and executed by the National Development and Reform Commission of China through the Institute of Geographic Sciences and Natural Resources Research, Chinese Academy of Sciences. The Central Department of Geography as per the MOU with Ministry of Population and Environment for Long Term Research Program under EbA South project provided grants for this work.
[1]
Arya N, Ram J. 2011. Forest disturbance and its impact on species richness and regeneration of Uttarakhand Himalaya. New York Science Journal, 4(6):21-27.

[2]
Awasthi N, Bhandari S K, Khanal Y. 2015. Does scientific forest management promote plant species diversity and regeneration in Sal (Shorea robusta) forest? A case study from Lumbini collaborative forest, Rupandehi, Nepal. Banko Janakari, 25(1):20-29.

[3]
Baboo B, Sagar R, Bargali S S, et al. 2017. Tree species composition, regeneration and diversity of an Indian dry tropical forest protected area. Tropical Ecology, 58(2): 409-423.

[4]
Bailey R L, Dell T R. 1973. Quantifying diameter distributions with the Weibull function. Forest Science, 19(2):97-104.

[5]
Bhakuni N, Kapkoti B, Lodhiyal N, et al. 2015. Quantitative analysis and regeneration status of Ghorakhal forest in Nainital of Kumaun Himalaya. International Journal of Basic and Life Sciences, 3:1-6.

[6]
Bhuju D R, Bogati R. 2019. Ecosystem-based adaptation through South- South cooperation monitoring and implementation protocol of eba interventions in Nepal. Resources Himalaya Foundation, Kathmandu, Nepal.

[7]
Bhuju D R, Yonzon P B. 2004. Species maintenance in a dynamic landscape: Ecology of the Chruiya (Siwalik) in Nepal Himalaya. Annual Report of Pro Natura Fund, 13:155-175.

[8]
Cottam G, Curtis J T. 1956. The use of distance measures in phytosociological sampling. Ecology, 37(3):451-460.

[9]
Curtis J T, Mclntosh R P. 1951. An upland forest continuum in the prairie forest border region of Winconsis. Ecology, 32(3):476-496.

[10]
Dalling J W, Hubbell S P, Silvera K. 1998. Seed dispersal, seedling establishment and gap partitioning among tropical pioneer trees. Journal of Ecology, 86(4):674-689.

[11]
DFO. 2016. Community forest user group monitoring and assessment. Lamjung, Nepal: District Forest Office.

[12]
DoF. 2014. Community Forest Database. Kathmandu, Nepal: Department of Forests (DoF).

[13]
FRA. 2015. Middle mountains forests of Nepal. Department of forest research and survey ministry of forests and soil conservation government of Nepal.

[14]
Gairola S, Rawal R S, Todaria N P. 2008. Forest vegetation patterns along an altitudinal gradient in sub-alpine zone of west Himalaya, India. African Journal of Plant Science, 2(6):42-48.

[15]
Hernandez L, Dezzeo N, Sanoja E, et al. 2012. Changes in structure and compositions in evergreen forests on an altitudinal gradient in the Venezuelan Guayana Shield. International Journal of Tropical Biology, 60(1):11-33.

[16]
Huang W D, Pohjonen V, Johansson S, et al. 2003. Species diversity, forest structure and species composition in Tanzanian tropical forests. Forest Ecology and Management, 173(1-3):11-24.

[17]
Kent M, Coker P. 1992. Vegetation description and analysis. London, UK: Belhaven Press.

[18]
Kflay G, Kitessa H. 2014. Species composition, plant community structure and natural regeneration status of belete moist evergreen montane forest, Oromia Regional State, Southwestern Ethiopia. Momona Ethiopian Journal of Science, 6(1):97-101.

[19]
Khan M L, Rai J N, Tripathi R S. 1987. Population structure of some tree species in disturbed and protected sub-tropical forests of northeast India. Acta Oecologia, 8:247-255.

[20]
Khan N, Ahmed M, Shaukat S S, et al. 2011. Structure, diversity and regeneration potential of Monotheca buxifolia(Falc.) A. DC. dominated forests of Lower Dir District, Pakistan. Frontier of Agriculture in China, 5(1):106-121.

[21]
Leak W B. 2002. Origin of sigmoid diameter distributions. Research paper number NE 718. US Department of Agriculture, Forest Service, Northeastern Research Station.

[22]
Malik Z A, Bhatt A B. 2015. Phytosociological analysis of woody species in Kedarnath Wildlife Sanctuary and its adjoining areas in western Himalaya, India. Journal of Forest and Environmental Science, 31(3):149-163.

[23]
Malik Z A, Bhatt A B. 2016. Regeneration status of tree species and survival of their seedlings in Kedarnath Wildlife Sanctuary and its adjoining areas in Western Himalaya, India. Tropical Ecology, 57(4): 677-690.

[24]
Mandal R A, Jha P K, Dutta I C, et al. 2016. Carbon sequestration in tropical and subtropical plant species in collaborative and community forests of Nepal. Advances in Ecology, 2016: 1-7.

[25]
McGarrigle E, Kershaw J A, Lavigne M B, et al. 2011. Predicting the number of trees in small diameter classes using predictions from a two-parameter Weibull distribution. Forestry: An International Journal of Forest Research, 84(4):431-439.

[26]
Niraula R R, Pokharel B K. 2016. Community forest management as climate change adaptation measure in Nepal’s Himalaya. In: Climate Change Adaptation Strategies—An Upstream-downstream Perspective, Springer, Cham: 101‒120.

[27]
Nord-Larsen T, Cao Q V. 2006. A diameter distribution model for even-aged beech in Denmark. Forest Ecology and Management, 231(1-3):218-225.

[28]
Nur A, Nandi R, Jashimuddin M, et al. 2016. Tree species composition and regeneration status of shitalpur forest beat under Chittagong North Forest Division, Bangladesh. Advances in Ecology, 2016: 1‒7. DOI: 10.1155/2016/5947874

[29]
Pandey S K, Shukla R P. 2003. Plant diversity in managed Sal (Shorea robusta) forests of Gorakhpur India: Species composition regeneration and conservation. Biodiversity Conservation, 12(11):2295-2319.

[30]
Park J, Alam M. 2015. Ecosystem-based adaptation planning in the Panchase Mountain Ecological Region. Hydro Nepal: Journal of Water, Energy and Environment,17: 34-41.

[31]
Paudel S, Sah J P. 2015. Effects of different management practices on stand composition and species diversity in subtropical forests in Nepal: Implications of community participation in biodiversity conservation. Journal of Sustainable Forestry, 34(8):738-760.

[32]
Press J R, Shrestha K K, Sutton D A. 2000. Annotated checklist of the flowering plants of Nepal. The Natural History Museum, London, UK. https://www.cabdirect.org/cabdirect/abstract/

[33]
Rahayu S, Basuni S, Kartono A P, et al. 2017. Tree species composition of 1.8 ha plot Samboja research forest: 28 years after initial fire. Indonesian Journal of Forestry Research, 4(2):95-106.

[34]
Rai S N, Dutta I C, Haque S, et al. 1999. Ecology and growth of Shorea robusta in Central Nepal. In: Mathema P C, Balla M K, Adhikary S N (eds.). Proceedings of an International Seminar on Sustainable Forest Management, 31 August-2 September 1998. Pokhara, Nepal:117-125.

[35]
Risser P G, Rice E L. 1971. Diversity in tree species in Oklahoma upland forests. Ecology, 52(5):876-880.

[36]
Sagar R, Raghubanshi A S, Singh J S. 2003. Tree species composition, dispersion and diversity along a disturbance gradient in a dry tropical forest region of India. Forest Ecology and Management, 186(1-3):61-71.

[37]
Sapkota I P, Tigabu M, Odén P C. 2009. Spatial distribution, advanced regeneration and stand structure of Nepalese Sal(Shorea robusta) forests subject to disturbances of different intensities. Forest Ecology and Management, 257(9): 1966‒ 1975.

[38]
Sapkota R P, Stahl P D, Norton U. 2018. Anthropogenic disturbances shift diameter distribution of woody plant species in Shorea robusta Gaertn. (Sal) mixed forests of Nepal. Journal of Asia-Pacific Biodiversity, 12(1): 115-128.

[39]
Sarkar M, Devi A. 2014. Assessment of diversity, population structure and regeneration status of tree species in Hollongapar Gibbon Wildlife Sanctuary, Assam, Northeast India. Tropical Plant Research, 1(2):26-36.

[40]
Shankar U. 2001. A case study of high tree diversity in a sal (Shorea robusta)-dominated lowland forest of Eastern Himalaya: Floristic composition, regeneration and conservation. Current Science, 81(7):776-786.

[41]
Shannon C E, Weiner W. 1949. The mathematical theory of communication. Urbana, USA: University of Illinois Press.

[42]
Shrestha U B, Shrestha B B, Shrestha S. 2010. Biodiversity conservation in community forests of Nepal: Rhetoric and reality. International Journal of Biodiversity and Conservation, 2(5): 98‒104.

[43]
Shukla R P, Pandey S K. 2000. Plant diversity and community features of the forested landscape adjacent to the foot-hills of central Himalayas. In: Tiwari S C, Dabral P P (eds.). Natural Resources, Conservation and Management for Mountain Development. Dehradun, India: International Book Distributors: 15-37.

[44]
Simpson E H. 1949. Measurement of diversity. Nature, 163(4148):688.

[45]
Teketay D. 1996. Seed ecology and regeneration in dry Afromontane forests of Ethiopia. Diss., Umea, Sweden Swedish University of Agricultural Sciences.

[46]
Tilman D, Downing J A. 1994. Biodiversity and stability in grasslands. Nature, 367(6461):363-365.

[47]
Timilsina N, Ross M S, Heinen J T. 2007. A community analysis of sal (Shorea robusta) forests in the western Terai of Nepal. Forest Ecology and Management, 241(1-3):223-234.

[48]
Travers A, Elrick C, Kay R, et al. 2012. Ecosystem-based adaptation guidance: Moving from principles to practice. Nairobi, Kenya: United Nations Environment Programme: 2071‒1050.

[49]
Vetaas O R. 2000. The effect of environmental factors on the regeneration of Quercus semecarpifolia Sm. In Central Himalaya, Nepal. Plant Ecology, 146(2):137-144.

[50]
West D C, Shugart H H, Ranney J W. 1981. Population structure of forests over a large area. Forest Science, 27(4):701-710.

[51]
Zar J H. 1999. Biostatistical analysis (Fourth edition). New Jersey, USA: Prentice Hall.

Outlines

/