
Journal of Resources and Ecology >
Assessing the Health of Inland Wetland Ecosystems over Space and Time in China
|
YAO Yunxiao, E-mail: yaoyunxiao@ruc.edu.cn |
Received date: 2020-10-12
Accepted date: 2021-02-25
Online published: 2021-11-22
Supported by
Ministry of Education Focus on Humanities and Social Science Research Base(17JJD910001)
Wetland is a unique natural landscape pattern, which provides a variety of important functions and services for human societies. With the rapid develop of the economy and accelerated urbanization, the inland wetlands are faced with series of problems, including reduced area, weakened wetland functions, and deterioration of the wetland ecosystem environment. Therefore, it is necessary to quantitatively assess the ecological health of China’s inland wetlands, which is key to the sustainable development of ecosystems. However, most assessments of wetland ecosystems only examine single wetlands or watershed wetlands, and there are few assessments of wetland health at the national level. In this paper, based on land cover data, climate data, and social and economic data, an assessment system of inland wetland health is established by using the Pressure-State-Effect-Response (PSER) model, which includes 15 assessment indicators. Analytic hierarchy process (AHP) was used to define the indicator weights. Then we assessed the ecosystem health of the inland wetlands of China in 2010 and 2018, which produced three main results. (1) Unlike ecosystem health evaluated by administrative districts, wetland ecosystem health (WEH) evaluation based on the grid could provide additional details of wetland health. (2) The area of inland wetlands increased by 16328 km 2 in 2018 compared to 2010, and the average wetland ecosystem health index in 2018 was 3.45, compared to an index value of 3.24 in 2010. (3) In 2018, wetlands in the better, good, moderate and poor conditions represented about 26.3%, 46.4%, 26.9% and 0.5% of the total, respectively. These results provide a practical guide for protecting and managing wetland system resources and reliable information for land use planning and development.
Key words: wetland; ecosystem health; Pressure-State-Effect-Response; AHP
YAO Yunxiao , WANG Wen , YANG Wenting , ZHANG Qihao . Assessing the Health of Inland Wetland Ecosystems over Space and Time in China[J]. Journal of Resources and Ecology, 2021 , 12(5) : 650 -657 . DOI: 10.5814/j.issn.1674-764x.2021.05.008
Table 1 Indicator system for assessment of wetland ecosystem health |
| Primary indicators | Secondary indicators | Measures | Positive/ Negative |
|---|---|---|---|
| Pressure | Artificial pressure | Population density (people.km-2) | ‒ |
| GDP per unit area (yuan km-2) | ‒ | ||
| Urbanization rate (%) | ‒ | ||
| Pressure of cultivated land (%) | ‒ | ||
| Distance to road (m) | + | ||
| State | Vigor | Average annual precipitation (mm) | + |
| Geomorphic types | + | ||
| Shrub and grass rate (%) | + | ||
| Terrain slope (°) | ‒ | ||
| Organizational structure | Patch density | + | |
| Mean fractal dimension | + | ||
| Effect | Resilience | Surrounding patch types | + |
| Nature response | Land degradation rate (%) | ‒ | |
| Soil erosion (t) | ‒ | ||
| Response | Wetland response | Wetland area change rate (%) | + |
Notes: ‘+’ represents a positive correlation between the indicator and WEH; ‘‒’ represents a negative correlation between the indicator and WEH. |
Table 2 Soil erosion criteria |
| Vegetation coverage (%) | Slope | |||||
|---|---|---|---|---|---|---|
| < 5° | 5°-8° | 8°-15° | 15°-25° | 25°-35° | > 35° | |
| > 75 | Not obvious | Micro | Micro | Micro | Micro | Micro |
| 60-75 | Micro | Mild | Mild | Mild | Moderate | High |
| 45-60 | Micro | Mild | Mild | Moderate | High | Strong |
| 30-45 | Micro | Mild | Moderate | High | Strong | Extremely strong |
| < 30 | Micro | Moderate | High | Strong | Extremely strong | Severe |
Table 3 WEHI reclassification standards |
| Rank | Better | Good | Moderate | Poor |
|---|---|---|---|---|
| WEHI | WEHI≥4 | 4>WEHI≥3 | 3>WEHI≥2 | 2>WEHI |
| Area (km2) | 84275.72 | 148684.2 | 86198.36 | 1602.2 |
Table 4 Weights of evaluation factors |
| Goal | Criteria | Alternative | Comprehensive weight | ||
|---|---|---|---|---|---|
| Indicator | Weight | ||||
| Wetland ecosystem health | Pressure (0.3701) | Artificial pressure (1.0000) | Population density | 0.3130 | 0.1158 |
| GDP | 0.3130 | 0.1158 | |||
| Urbanization rate | 0.0988 | 0.0366 | |||
| Pressure index of cultivated land | 0.0988 | 0.0366 | |||
| Distance to road | 0.1765 | 0.0653 | |||
| State (0.1850) | Vigor (0.5000) | Average annual precipitation | 0.4547 | 0.0421 | |
| Geomorphic types | 0.1411 | 0.0131 | |||
| Terrain slope | 0.1411 | 0.0131 | |||
| Shrub and grass rate | 0.2630 | 0.0243 | |||
| Organization structure (0.5000) | Patch density | 0.5000 | 0.0463 | ||
| Mean fractal dimension | 0.5000 | 0.0463 | |||
| Effect (0.0998) | Resilience (0.5000) | Surrounding patch types | 0.5000 | 0.0499 | |
| Nature response (0.5000) | Land degradation rate | 0.2500 | 0.0250 | ||
| Soil erosion | 0.2500 | 0.0250 | |||
| Response (0.3451) | Wetland area changing rate | 1.0000 | 0.3451 | ||
Notes: Values in parentheses are the weights of the evaluation factors. |
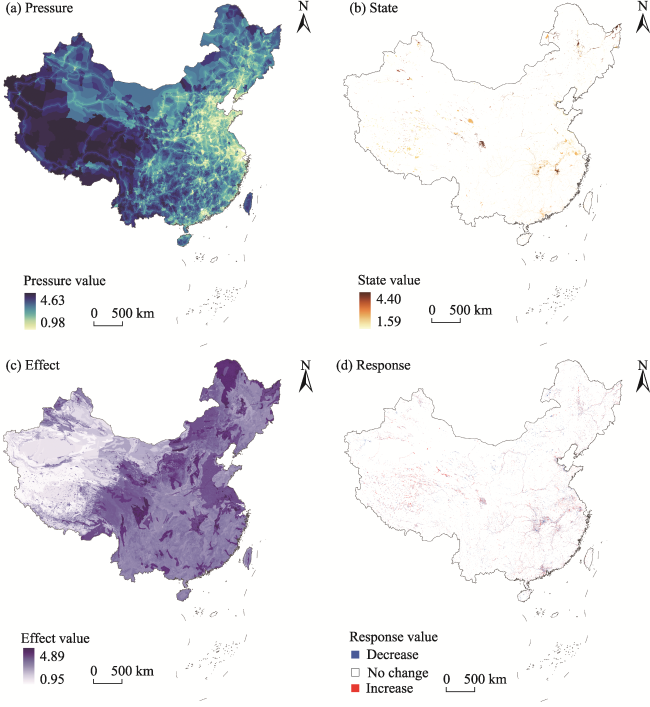
Fig. 1 Distributions of pressure, state, effect and response index values. |
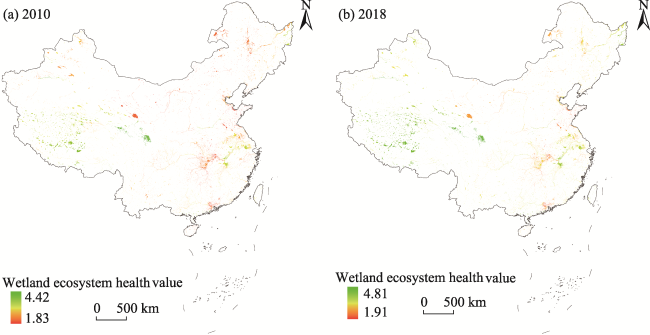
Fig. 2 Distribution of inland wetland ecosystem health in 2010 and 2018 |
| [1] |
|
| [2] |
|
| [3] |
|
| [4] |
|
| [5] |
|
| [6] |
|
| [7] |
|
| [8] |
|
| [9] |
|
| [10] |
|
| [11] |
|
| [12] |
|
| [13] |
|
| [14] |
|
| [15] |
|
| [16] |
|
| [17] |
|
| [18] |
|
| [19] |
NBS (National Bureau of Statistics. 2011. https://data.stats.gov.cn/easyque ry.htm?cn=E0103&zb=A0201®=150000&sj=2011
|
| [20] |
|
| [21] |
|
| [22] |
|
| [23] |
|
| [24] |
|
| [25] |
|
| [26] |
|
| [27] |
|
| [28] |
|
| [29] |
|
| [30] |
|
| [31] |
|
| [32] |
|
| [33] |
|
| [34] |
|
| [35] |
|
| [36] |
|
| [37] |
|
/
| 〈 |
|
〉 |