Resource Economy

Spatial Differentiation Pattern of Habitat Quality and Mechanism of Factors Influencing in Resource-based Cities: A Case Study of Tangshan City, China

  • CHENG Peng ,
  • MIN Min , * ,
  • ZHAO Wei ,
  • ZHAO Ke
Expand
  • College of Public Administration, Huazhong Agricultural University, Wuhan 430070, China
*MIN Min, E-mail:

CHENG Peng, E-mail:

Received date: 2021-01-19

  Accepted date: 2021-04-20

  Online published: 2021-11-22

Supported by

The National Natural Science Foundation of China(41971240)

The Special Funding Project for Fundamental Scientific Research Operation Fees of Central Universities(2662019FW017)

Abstract

The degradation of the eco-environment has been a challenge for sustainability in resource-based cities around the world. Although much attention has been drawn to this issue, few insights have been acquired regarding the spatial differentiation and mechanism of the factors influencing habitat quality in resource-based cities from the perspective of the interactions of natural and human factors. Using Tangshan City as a case study, this paper evaluates habitat quality by integrating Ecosystem Service Value Assessment and the InVEST-HQ model, identifies the spatial distribution of Tangshan’s habitat quality with spatial auto-correlation, and explores the influencing factors and their mechanism of influence on the spatial differentiation with the geographical detector model and Space production theory. The results show that: (1) The total value of the habitat quality in Tangshan City in 2019 was 3.45×10 10 yuan, and the habitat quality value was 24435.05 yuan ha ‒1. The habitat quality value presents a clustered distribution pattern of “hot in the north and the south, cold from the center to the west”. (2) On the county scale, Qianxi County had the best habitat quality and Lubei District had the worst habitat quality; Shangying Township had the highest average habitat quality and Kaiping Street had the lowest average habitat quality in the township unit. (3) The results of geographical detectors show that natural environmental conditions are the important basic factors affecting the spatial differentiation of habitat quality in Tangshan City, while urbanization and industrialization factors are the most important external forces driving the spatial differentiation of habitat quality. The contributions of average elevation, average slope, raw material industrial density, and population density to the spatial differentiation of habitat quality are all above 0.40. The interactions of any two factors on habitat quality are enhanced. Areas with concentrated populations, rich industrial resources, and convenient transportation become low-value habitat quality areas; while areas with beautiful landscape patterns, abundant precipitation, and a comfortable climate become high-value habitat quality areas. Space production theory can be used to explain the mechanism of the formation of the spatial differentiation of habitat quality.

Cite this article

CHENG Peng , MIN Min , ZHAO Wei , ZHAO Ke . Spatial Differentiation Pattern of Habitat Quality and Mechanism of Factors Influencing in Resource-based Cities: A Case Study of Tangshan City, China[J]. Journal of Resources and Ecology, 2021 , 12(5) : 636 -649 . DOI: 10.5814/j.issn.1674-764x.2021.05.007

1 Introduction

Resource-based cities are an essential part of the world urban system, making significant contributions to social and economic development (He et al., 2017b). However, the exploitation and primary processing of natural resources has inevitably resulted in the direct or indirect destruction of biodiversity and the decline of ecosystem services in resource-based cities (Foley et al., 2005; Hooper et al., 2005; Falcucci et al., 2007), such as vegetation degradation, land desertification (Sallustio et al., 2017), sharp reductions in the areas of farmland and arable land, and environmental pollution (He et al., 2017b). Studies have shown that the quality of ecosystem services and functions determines the sustainable and harmonious development of humans, nature and other populations (Johnson, 2007; Sallustio et al., 2017; Zhai et al., 2020). Therefore, the quantitative evaluation of ecological functions and the study of their impact mechanisms have become key parts of building a regional ecological space security pattern and realizing the sustainable development of resource-based cities (Liu et al., 2018; Bai et al., 2020; Tang et al. al., 2021; Yi et al., 2021). Many efforts and studies have been carried out to increase the ecological resilience in resource-based cities by various governments (Li et al., 2013; Ruan et al., 2020) and researchers (Liu et al., 2020; Wu et al., 2020a). Most existing studies have analyzed the spatial differentiation of ecological functions of resource-based cities in China from the perspectives of urbanization (Wan et al., 2015; Wu et al., 2020b; Zeng et al., 2020) and industrialization (Chang et al., 2009; Yan et al., 2019) respectively. Thus far, few studies have conducted in-depth analyses of how the interactions of natural factors and human factors (urbanization and industrialization) affect the habitat quality of resource-based cities.
Habitat quality refers to the ecological environment’s ability to provide appropriate resources and conditions for living organisms to inhabit the environment, survive, and reproduce (Zhang et al., 2020b). The habitat quality value can characterize the supply level of ecosystem services and biodiversity in a specific area (Romero-Calcerrada and Luque, 2006). Early studies on habitat were mainly carried out by biologists who focused on evaluating habitat quality for specific wild species or communities, and they tended to conduct field inspections and establish a habitat evaluation index system to assess habitat quality (Kempton, 1979; Vanhorne, 1983). With the rapid development of global climate change and urbanization, the importance of habitat has been widely recognized, and habitat quality has become a hot topic among various multi-disciplinary fields. Current research hotspots in habitat quality focus on two perspectives. One is quantifying habitat quality and identifying priority areas for conservation (Sallustio et al., 2017). For example, Costanza et al. (1997) quantified the ability of different habitats to provide human society with conditions for survival and development as ecosystem service values; and many ecological models that combine remote sensing image data and GIS technology are gradually emerging (Terrado et al., 2016; Moreira et al., 2018; He and Xie, 2019). The InVEST model is one of the most popular model tools that can quantitatively evaluate and predict regional habitat quality and its temporal and spatial changes (Liu et al., 2019; Sun et al., 2019).
The second research hotspot is the discussion and quantification of the factors which affect the habitat quality. Changes in land use and landscape patterns caused by human activities are prominent in influencing habitat quality (Jorgensen et al., 2009; Han et al., 2019). Among them, the impact of urbanization on habitat quality has been widely discussed in recent years (He et al., 2017a; Han et al., 2019; Sun et al., 2019; Wang et al., 2020). For example, Bai et al. (2020) found that high population density (POP), gross domestic production (GDP), and nighttime lighting (NTL) are negatively correlated with habitat quality in Changchun city. Forman et al. (2000) examined the relationship between road construction and habitat quality. Zhang et al. (2020a) further verified that road grade, road length, operation duration, and traffic volume are the factors with the strongest influence on habitat quality in China’s northwest. However, research on the quality of urban habitat as impacted by industrialization factors is relatively scarce (Zhai et al., 2020). In terms of quantitative analysis methods for factors affecting habitat quality, many studies (including those above) use the OLS model and the GWR model (Bai et al., 2019a; Dai et al., 2019; Zhu et al., 2020). By comparing these two models, research has shown that the explanatory power of the GWR model is more significant than the OLS, and the GWR model can reveal the spatial differences of the influential factors (Bai et al., 2019; Zhu et al., 2020). However, the two models only involve linear interpolations, which rarely explore the impacts on habitat quality of interactions among the influential factors. Geographic detectors can detect spatial differentiation and quantitatively examine the interaction effects without any assumptions or restrictions on the explanatory and response variables, so they have been gradually applied to investigations of the impacts of interactions among natural and socioeconomic factors on the environment and ecology (Bai et al., 2019b; Liu et al., 2021a). Still, they have rarely been applied in the study of urban habitat quality.
Hence, we attempt to fill the above-mentioned gaps in our study. Taking Tangshan, a typical resource-based city in China, as an example, this paper aims to: 1) Assess Tangshan’s habitat quality; 2) Identify and map the habitat quality hot spots and cold spots; and 3) Detect the impacts of natural, urbanization and industrialization factors on habitat quality in Tangshan City, with an emphasis on the factor of industrialization layout. We first integrate the ecosystem service value evaluation model based on land patches and the InVEST model based on human threats to evaluate the habitat quality, then we identify the spatial distribution of Tangshan’s habitat quality with the spatial auto-correlation method. Finally, we explore the influencing factors and mechanism of their influence on the spatial differentiation with the geographical detector model and space production theory. This study provides a practical way to quantify the ecological effect and evaluate the industrialization impacts in resource-based cities, and it provides theoretical support for ecological environmental protection, industrial transformation and upgrading, and the sustainable development of resource-based cities in China and other developing countries.

2 Methods

2.1 Study area

Tangshan City (117°31°-119°19°E, 38°55°-40°28°N) is located in the eastern part of Hebei Province, in the center of Bohai Bay, with a total area of 13472 km2, and includes three county-level cities, four counties, seven districts and four development zones (Fig. 1). The northern mountainous region is rich in wood and fruits, the central plain is famous as the Jidong Granary, and the southern coast is replete with large salt production bases and high-tech industrial parks. Tangshan has a solid industrial foundation, being known as the “cradle of modern industry” in China. Tangshan City is a city built on coal and thriving on steel, and it has formed related pillar industries such as iron and steel, energy, building materials, chemicals, machinery, and ceramics. It is one of the important energy and raw material bases in China.
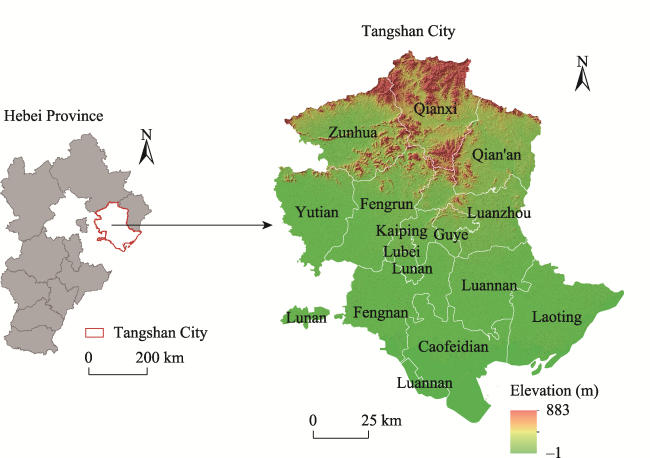
Fig. 1 Location and subdivisions of Tangshan City

2.2 Data sources

In this paper, the Tangshan remote sensing image for 2019 was obtained from the Landsat-8 image, with a spatial resolution of 30 m, provided by the USGS (https://www. usgs.gov/). The DEM data were retrieved from the ASTER GDEM V3 data released by NASA Set (https://www. nasa.gov/), with a resolution of 30 m. Tangshan City’s administrative division vector data were from the geographic and national conditions monitoring cloud platform (http://www.dsac.cn/). The latest traffic road network data in Tangshan were obtained from the Open Street Map website (https://www.openstreetmap.org/). The Tangshan City and surrounding meteorological stations’ monthly precipitation data for 2019 were obtained from the China Meteorological Data Network (http://data.cma.cn/). The planting area, output and prices of main food crops were quoted from “Tangshan Statistical Yearbook” and “China Agricultural Product Price Survey Yearbook”. The POI point data of Tangshan’s raw material industrial (metallurgy, electric power, coal, building materials), extractive industry, and construction industry companies for 2019 were obtained from the Gaode map (https://ditu.amap.com/).
Referring to “Classification of Land Use Status” (GB/T 21010-2017) and “National Remote Sensing Monitoring Land Use/Cover Classification System”, and according to the characteristics and research needs of land resources in Tangshan, the object-oriented classification method in ENVI software was used to divide the land use types in the study area into six categories, namely forest land (forestland, other woodlands), grassland, cultivated land, construction land (residential land, industrial and mining land, transportation land), water area (river, lake, reservoir, coastal beach, salt pan, wetland), and unused land. According to “Tangshan City Land Use Planning Map (2006-2020)”, Google earth and sky map images, the classification results were visually calibrated in ArcGIS, and the land use status classification map of Tangshan City for 2019 was obtained. The first-level classification accuracy was over 90%, meeting our research needs. Based on the monthly precipitation data of Tangshan City and surrounding meteorological stations, we performed raster interpolation in ArcGIS to obtain the precipitation distribution map of Tangshan City for 2019. In this paper, the regional GDP value is compared with the regional area to obtain the GDP value per unit area. The number of regional industrial enterprises, the number of extractive industry enterprises, the number of construction enterprises, and the length of the transportation network are compared with the regional area to obtain raw material industrial density, extractive industry density, construction industry density and traffic road network density data, respectively.

2.3 Habitat quality evaluation model

According to the summary of the habitat quality assessment method proposed by Wu et al. (2017), and based on the evaluation of the habitat service value of the land patch, this paper uses the habitat quality level under the artificial stress situation to modify it, and constructs the habitat quality evaluation model of Tangshan City. The integrated assessment model is calculated as follows:
${{Q}_{x}}={{Q}_{\text{1}}}\times {{Q}_{\text{2}}}$
where Qx is the evaluation result of the habitat quality of pixel x; Q1 is the habitat service value of pixel x based on land patches, Q2 is the habitat quality level of pixel x based on artificial stress, and its value is a constant in the range of [0, 1].
2.3.1 Evaluation of habitat service value based on land patches
To a certain extent, the value of ecosystem services reflects the capabilities that a habitat provides to living organisms, thus quantifying the regional habitats’ quality. The Q1 based on land patches in this study refers to the ecosystem service value after correction for vegetation coverage. This study preliminarily quantifies the ecosystem service value per unit area by correcting Xie et al.’s equivalence factor table by considering the main food crops in Tangshan City (2008). By consulting the “Tangshan Statistical Yearbook” and “China Agricultural Product Price Survey Yearbook”, this study takes 1967.92 yuan ha-1 as 1 equivalent factor. Then, considering that vegetation coverage has a strong positive correlation with the regional ecosystem services value (Sun et al., 2019), vegetation coverage is selected to modify the ecological coefficient of the study area’s ecosystem service value (but only for habitats with vegetation coverage).
2.3.2 Evaluation of habitat quality level based on artificial stress
Human activities directly affect land use status in a region, and the increasing intensity of land use threatens the ecosystem’s ability to provide survival and development for various species. Based on artificial threat factors and land cover types, the habitat quality module in the InVEST model comprehensively considers the protection degree of the habitat, the effective impact distances of the threat sources, the sensitivity of the habitat to threat factors, and the distances between the habitat and each threat source. This paper uses the InVEST model to quantify the habitat quality level of Tangshan City based on artificial stress. In the habitat quality module of the InVEST model, the Q2 calculation formula is given in Equations (2) and (3). The larger the value of Q2, the better the habitat quality level.
${{Q}_{\text{2}}}\text{=}{{H}_{j}}\times \left( \text{1}-\frac{D_{xj}^{z}}{D_{xj}^{z}+{{k}^{z}}} \right)$
${{D}_{xj}}\text{= }\!\!~\!\!\text{ }\underset{r=\text{1}}{\overset{R}{\mathop \sum }}\,\underset{y\text{=1}}{\overset{{{Y}_{r}}}{\mathop \sum }}\,\frac{{{w}_{r}}}{\sum\limits_{r=1}^{R}{{{w}_{r}}}}\times {{r}_{y}}{{i}_{rxy}}{{\beta }_{x}}{{S}_{jr}}$
In the formulas, Hj is the habitat suitability of the habitat type j; Dxj is the total threat level of the grid unit x in the habitat type j; z and k are the scale constants, z = 2.5, k is half of the maximum value of Dxj; R represents the total number of threat sources; Yr is the total number of grid cells of threat source r; wr is the normalized weight of threat source r; ry is the threat source r in the grid cell y; βx represents the legal protection level of grid cell x; Sjr represents the sensitivity of habitat type j to threat source r; and irxy represents the threat value of threat source r in grid y to grid x. For irxy the calculation formulas are:
${{i}_{rxy}}\text{=1}-\frac{{{d}_{xy}}}{{{d}_{r\text{max}}}}\text{ }\!\!~\!\!\text{ }\!\!~\!\!\text{ }\!\!~\!\!\text{ }\!\!~\!\!\text{ }\!\!~\!\!\text{ }\!\!~\!\!\text{ }\!\!~\!\!\text{ }\!\!~\!\!\text{ }\!\!~\!\!\text{ }\!\!~\!\!\text{ }\!\!~\!\!\text{ }\!\!~\!\!\text{ }\!\!~\!\!\text{ }\!\!~\!\!\text{ }\!\!~\!\!\text{ }\!\!~\!\!\text{ }\!\!~\!\!\text{ (if it is linear)}$
${{i}_{rxy}}\text{=exp}\left[ -\left( \frac{\text{2}\text{.99}}{{{d}_{r\text{max}}}} \right){{d}_{xy}} \right]\text{ }\!\!~\!\!\text{ }\!\!~\!\!\text{ }\!\!~\!\!\text{ }\!\!~\!\!\text{ }\!\!~\!\!\text{ }\!\!~\!\!\text{ }\!\!~\!\!\text{ (if it is exponential)}$
In the formulas, dxy represents the linear distance between the grid units x and y; and drmax represents the maximum threat distance of the threat source r. With reference to the InVEST model guidelines and existing research results (Arkema et al., 2019; Bai et al., 2020), combined with the actual ecological status of the study area, we determined the suitability of each habitat in Tangshan City, each threat source and its weight and maximum distance of influence, and the sensitivity of each habitat to each of the threat sources.

2.4 Spatial autocorrelation and analysis of cold and hot spots

The spatial autocorrelation index can be used to describe whether a geographical phenomenon has regularity of the spatial distribution in a specific unit. This paper uses the global spatial autocorrelation index, Global Moran’s I, to test whether the habitat quality has spatial aggregation in Tangshan. The value range of Global Moran’s I is [-1, 1]. The closer the absolute value is to 1, the higher the correlation. A positive value indicates that it has a clustering effect in space, a negative value indicates that it has a divergent effect in space, and a value equal to 0 indicates a random distribution. The Getis-Ord G* index can accurately detect the clustering distribution characteristics of spatial variables in a local area (Getis and Ord, 1992). This index is used here to identify whether there are significant clusters of high and low values in the spatial distribution of habitat quality in the study area. When the G* value is significantly positive, the habitat quality clustering is at a high value, which indicates a hot spot area; when the G* value is significantly negative, the habitat quality clustering is at a low value, which indicates a cold spot area. We regard the areas where the G* value is significant at the 99% confidence level as the hot and cold spots, and the areas where the G* value is significant at the 95% confidence level as secondary hot spots and secondary cold spots.

2.5 Quantitative detection of factors affecting habitat quality

The geographical detector model is a statistical tool for detecting spatial differentiation and revealing its driving forces (Wang and Xu, 2017). In the factor detector, the power of determinants for the habitat quality can be expressed by the q-statistic as follows:
$q=1-\frac{\text{1}}{N{{\sigma }^{\text{2}}}}\underset{h\text{=1}}{\overset{m}{\mathop \sum }}\,{{N}_{h}}\sigma _{h}^{\text{2}}$
where h (1, …, m) is the number of subregions of factor X; N and Nh represent the total number of spatial units (in this study, towns) over the entire study area and the subregion h, respectively; and ${{\sigma }^{\text{2}}}$ and $\sigma _{h}^{\text{2}}$ denote the total variance and variance of samples in subregion h, respectively. The q-statistic of the geographic detector will be normalized to values between 0 and 1. The larger the q-value, the stronger the explanatory power of the independent variable to the dependent variable. By comparing the interaction q-value of the paired influential factors and the q-values of each of the two factors, Wang and Xu (2017) summarized five categories of the potential interactions.
This paper uses the factor detectors in the geographic detectors to quantitatively detect the factors that affect the spatial differentiation of the habitat quality in the study area, and to obtain the explanatory power of each influencing factor of the habitat quality. We also use the interaction detector to identify whether the natural, urbanization and industrialization factors have an interaction effect on the habitat quality and, if so, the type of interaction.

3 Results

3.1 The spatial differentiation pattern of habitat quality

The total value of Tangshan’s habitat quality in 2019 is 3.45×10¹⁰ yuan, and the average value per unit area is 24435.05 yuan ha-1. We calculated the total value and average value per hectare of habitat quality at the county level. Qianxi County in the north of Tangshan City has high forest coverage, and the highest total and average habitat quality values among the 14 counties (districts), reaching 1.07×10¹⁰ yuan and 73794.702 yuan ha-1, respectively. As the political and economic center of Tangshan City, Lubei District has the lowest total and average values of habitat quality. The habitat quality of Tangshan City presents a significant overall spatial situation of high in the north and south, and low in the middle and west (Fig. 2).
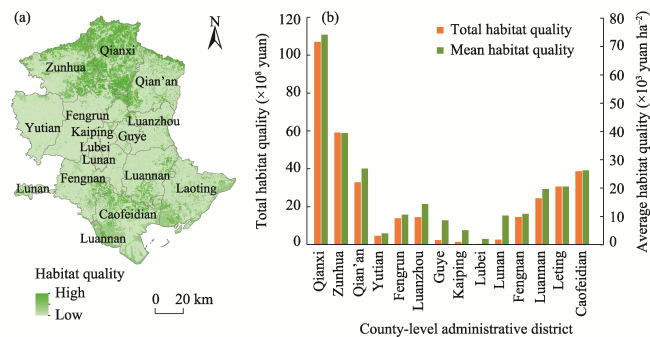
Fig. 2 Spatial distribution map and county levels of habitat quality values in Tangshan City
We calculated the total value and average value (per ha) of the habitat quality for the 231 township administrative regions in Tangshan City, and divided them into five levels: higher, high, medium, low, and lower (Fig. 3). The top five townships with the highest total values of habitat quality are Hanerzhuang Township, Shangying Township, Luanyang Town, Xingcheng Town, and Xiaochang Township. The top four townships are all located in Qianxi County, a high-value habitat area (Fig. 3a). The five lowest towns are Kaiping Street, Doudian Street, Huaminglu Street, Jinggezhuang Street, and Youyi Street, all of which are relatively small towns (Fig. 3a). The high-quality areas with respect to the average habitat quality of each township are mostly concentrated in the northern part of the study area. The top five highest average habitat quality towns are Shangying Town, Hanerzhuang Town, Donglianhuayuan Town, Houjiazhai Town, Xiaochang Town. In comparison, the five lowest average habitat quality towns are Kaiping Street, Xiaoshan Street, Guangming Street, Doudian Street, and Dali Street (Fig. 3b).
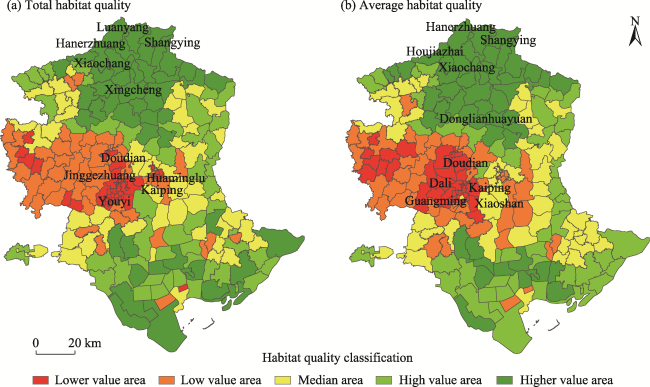
Fig. 3 (a) Spatial distribution of total habitat quality in each township in Tangshan City; (b) Spatial distribution of average habitat quality in each township in Tangshan City.
The total value of habitat quality and the mean Global Moran’s I value of Tangshan City in 2019 are 0.475 (P < 0.01) and 0.570 (P < 0.01), respectively, indicating that the distribution of habitat quality in Tangshan City has a significant positive correlation, that is, clustering in space. The habitat quality total value at the town level presents a spatially clustered distribution pattern of “hot from the north to the south, cold from the center to the west” (Fig. 4a). The hot spots are mainly located in the north and south of the study area, including Hanerzhuang Town, Luanyang Town, Shangying Town, Nanpu Town, and others. The northern hotspot area has excellent forest coverage, and the southern hotspot area has a large number of coastal beaches and wetlands, mostly located in the ecological environmental safety control zone of Tangshan City, and the habitat quality values of these two areas are generally high. The cold spot areas are scattered throughout the industrial and commercial urban areas of Tangshan City, mainly in Guoyuan Town, Hancheng Town, Fengrun Town and other towns. The land coverage in cold spot areas is mainly residential, industrial and mining, and other construction lands, so the habitat quality value is universally low. The average value of the habitat quality in Tangshan City is mainly concentrated in the northern part of the study area except for the hot spots (Fig. 4b), and the distribution of the remaining cold spots is roughly the same as the total value distribution.
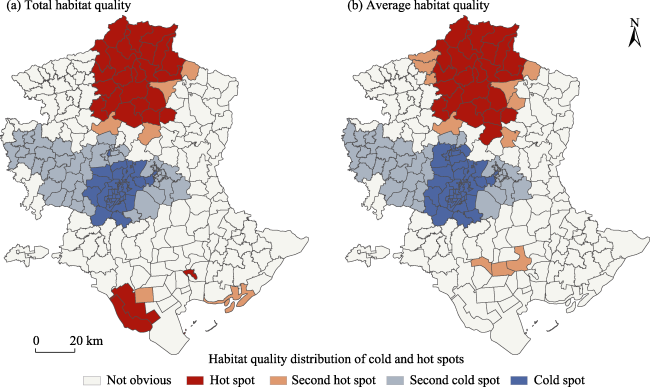
Fig. 4 (a) LISA cluster map of total habitat quality in Tangshan City; (b) LISA cluster map of average habitat quality in Tangshan City.

3.2 Statistics of the spatial distribution of habitat quality based on industrialization

Based on Liu’s (2009) research results on resource-based city functional classification in China, this study selects the three major resource industries (raw material industry, extractive industry, and construction industry) to deeply explore the internal relationship between resource-based industry layout and habitat quality. We use the “Silverman rule of thumb” to calculate the search radius and set the output pixel size to 30 m. This generates a Tangshan kernel density distribution map of 2957 raw material industrial enterprises (Fig. 5a), 142 extractive enterprises (Fig. 5b), and 1103 construction enterprises (Fig. 5c).
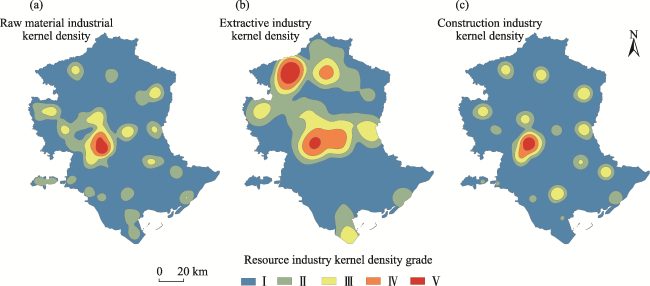
Fig. 5 (a) Analysis of kernel density of Tangshan’s raw material industry layout; (b) Analysis of kernel density of Tangshan’s extractive industry layout; (c) Analysis of kernel density of Tangshan’s construction industry layout.
This paper classifies the kernel densities of raw material industry, extractive industries, and construction industries from small to large into I-V levels, and then calculates the corresponding areas and proportions of the average levels of township habitat quality in Tangshan City within the kernel density level of each resource industry. The statistical results are shown in Tables 1-3. The statistical results show that each resource industry’s kernel density is inversely proportional to the average value of the pixel habitat quality, which means that the higher the industrial nuclear density, the lower the habitat quality value. In the two intervals with a raw material industrial kernel density greater than 0.402, the propor
tion of habitat quality levels at medium and above is 0, reflecting the significant negative spatial correlation between the distribution intensity of raw material industries and regional habitat quality. In the two high-value ranges where the construction industry’s kernel density is greater than 0.743, the habitat quality is all concentrated in the low and lower grades, and the proportion in the low grades is more than 65%. Unlike the other two resource-based industries, the extractive industry is mostly located in the forest areas which have vital ecological functions in the northern part of Tangshan City, so this industry still maintains a good habitat quality even at a high kernel density.
Table 1 Habitat quality grade distribution of different raw material industrial kernel density levels in Tangshan City
Raw material industrial habitat quality level Ⅰ (0-0.057) Ⅱ (0.057-0.170) Ⅲ (0.170-0.402) Ⅳ (0.402-0.747) Ⅴ (0.747-1.205)
Area (km2) Proportion (%) Area (km2) Proportion (%) Area (km2) Proportion (%) Area (km2) Proportion (%) Area (km2) Proportion (%)
Lower 1390.73 13.22 900.96 34.58 427.10 57.46 126.50 85.72 72.96 75.73
Low 1965.27 18.69 602.80 23.14 201.38 27.09 21.07 14.28 23.39 24.27
Medium 1981.13 18.84 720.93 27.67 100.73 13.55 0 0 0 0
High 2569.29 24.43 217.90 8.36 14.12 1.90 0 0 0 0
Higher 2611.45 24.83 162.86 6.25 0 0 0 0 0 0
Total area 10517.87 74.54 2605.45 18.46 743.34 5.27 147.57 1.05 96.35 0.68
Average (pixel) 2648.24 1082.31 410.39 200.81 243.16
Table 2 Habitat quality grade distribution of different extractive industrial kernel density levels in Tangshan City
Extractive industrial
habitat quality level
Ⅰ(0-0.006) Ⅱ(0.006-0.015) Ⅲ (0.015-0.029) Ⅳ (0.029-0.051) Ⅴ (0.051-0.088)
Area
(km2)
Proportion (%) Area
(km2)
Proportion (%) Area
(km2)
Proportion (%) Area
(km2)
Proportion (%) Area
(km2)
Proportion (%)
Lower 1163.89 14.93 874.95 24.89 510.37 30.52 304.39 36.14 64.65 22.86
Low 1240.45 15.91 728.72 20.73 488.64 29.22 269.35 31.98 86.75 30.67
Medium 1763.92 22.62 727.22 20.68 255.43 15.27 30.39 3.61 25.82 9.13
High 2251.62 28.88 284.45 8.10 82.63 4.90 80.51 9.56 102.10 36.10
Higher 1377.44 17.67 900.51 25.61 335.31 20.05 157.54 18.71 3.51 1.24
Total area 7797.33 55.26 3515.85 24.92 1672.39 11.85 842.19 5.97 282.82 2.00
Average (pixel) 2343.80 2266.33 1904.45 1522.98 1132.91
Table 3 Habitat quality grade distribution of different construction industrial kernel density levels in Tangshan City
Construction industrial
habitat quality level
Ⅰ (0-0.098) Ⅱ (0.098-0.322) Ⅲ (0.322-0.743) Ⅳ (0.743-1.415) Ⅴ (1.415-2.283)
Area
(km2)
Proportion (%) Area
(km2)
Proportion (%) Area
(km2)
Proportion (%) Area
(km2)
Proportion (%) Area
(km2)
Proportion (%)
Lower 2092.35 17.84 444.94 30.51 212.52 30.23 91.59 65.87 76.85 93.96
Low 2250.63 19.19 326.83 22.41 184.05 26.18 47.46 34.13 4.94 6.04
Medium 2284.39 19.48 392.21 26.89 126.20 17.95 0 0 0 0
High 2552.11 21.76 181.91 12.47 67.30 9.57 0 0 0 0
Higher 2548.99 21.73 112.44 7.71 112.87 16.06 0 0 0 0
Total area 11728.47 83.12 1458.33 10.33 702.94 4.98 139.06 0.99 81.79 0.58
Average (pixel) 2397.44 1321.68 1333.54 239.38 184.80

3.3 Mechanism of factors influencing the spatial differentiation of habitat quality

3.3.1 Factor detector analysis
This paper uses geographic detectors to quantitatively detect the factors affecting the spatial differentiation of habitat quality in Tangshan City. We choose the average of each township’s habitat quality as the dependent variable and construct impact factor detection from three aspects: natural environmental conditions, urbanization, and industrialization (Table 4). The industrialization intensity represents the destruction and transformation intensity of human engineering activities such as mining, metallurgy, and logging on the regional ecosystem, which directly reflects the pressure on the environment, resources, and ecological subsystems brought by human activities and social-economic production activities. The results in Table 4 show that the nine factors all significantly impact the spatial differentiation of the habitat quality in Tangshan City at the 95% confidence level. The influences (q-values) of the nine influential factors are, in descending order: mean elevation (0.63) > average slope (0.55) > population density (0.46) > raw material industrial density (0.40) > average annual precipitation (0.34) > construction industry density (0.32) > GDP per unit area (0.22) > traffic network density (0.17) > extractive industry density (0.16). Among these factors, natural environmental conditions are the foundation that affects land use patterns and intensity, which preliminarily determine the distribution of regional vegetation and habitat types, and have the greatest impacts on the quality of the habitat in Tangshan. The contribution rates of elevation and slope are as high as 0.63 and 0.55, respectively. The terrain of Tangshan is flat and low. The artificial activities are mostly distributed in the flat terrain areas, so the habitat quality is most affected by the altitude and elevation. Among urbanization factors, population density has the most significant impact on Tangshan’s habitat quality and its q-value is as high as 0.46. The greater the population density, the greater the probability that forest land and cultivated land are converted into construction land. In recent years, Tangshan City has continuously strengthened the construction of transportation infrastructure, and the distribution of the traffic road network in the study area is relatively uniform. Therefore, the q-value of the traffic road network density on the spatial differentiation of habitat quality is only 0.17. Among the three factors representing the layout of industrialization, raw material industrial density has the greatest impact on habitat quality distribution (q-value = 0.40), followed by construction industry density (q-value = 0.32). The density of the extractive industry has the lowest influence (q-value = 0.16). This sequence is due to the fact that Tangshan City has accelerated the adjustment of its industrial structure in recent years and has gradually eliminated the outdated and heavily polluting mining and smelting industries.
Table 4 Detection results of the factors affecting habitat quality in Tangshan City
First level indicator Secondary indicators Code Factor interpretation
q-statistic P value
Natural environmental conditions Average slope X1 0.55 0.000
Mean elevation X2 0.63 0.000
Average annual precipitation X3 0.34 0.000
Urbanization factors Population density X4 0.46 0.000
Traffic network density X5 0.17 0.000
GDP per unit area X6 0.22 0.000
Industrialization factors Raw material industrial density X7 0.40 0.000
Construction industry density X8 0.32 0.000
Extractive industry density X9 0.16 0.014
3.3.2 Interaction detector analysis
The result of further detection by the interaction detector shows 36 pairs of interaction results among the nine risk factors (Table 5). The results show that the q-value of each pair of impact factors is greater than the q-value of each individual impact factor and even greater than the sum of the two factors’ q-values, which means that the interaction of any two factors on habitat quality is enhanced or even nonlinearly enhanced. The interaction strengths between average annual precipitation (X3) and the other two natural indicators (elevation (X2) and average slope (X1)) are as high as 0.83 and 0.82, respectively. Among other factors, the interaction effects of average annual precipitation (X3) and population density (X4), mean elevation (X2) and traffic network density (X5), mean elevation (X2) and construction industry density (X8) are all 0.78. This indicates that natural environmental conditions have the most vital interactions among the influencing factors and the natural environmental factors, and the other two types of factors also have apparent synergistic effects.
Table 5 Interactive detection results of factors influencing habitat quality in Tangshan City
Impact factor X1 X2 X3 X4 X5 X6 X7 X8 X9
X1 0.55
X2 0.68* 0.63
X3 0.82* 0.83* 0.34
X4 0.73* 0.75* 0.78* 0.46
X5 0.73* 0.78* 0.60# 0.67# 0.17
X6 0.72* 0.73* 0.68# 0.65* 0.48# 0.22
X7 0.73* 0.77* 0.68* 0.65* 0.63# 0.60* 0.40
X8 0.73* 0.78* 0.64* 0.66* 0.54# 0.57# 0.57* 0.32
X9 0.64* 0.71* 0.54# 0.59* 0.41# 0.45# 0.59# 0.50# 0.16

Note: * means two-factor enhancement type; # means non-linear enhancement type.

3.3.3 Influence mechanism analysis
Based on the results of the Tangshan habitat quality evaluation and the cold and hot spot analysis, we can summarize the spatial differentiation pattern of Tangshan habitat quality. The large industrial operations in the central and northwestern regions of Tangshan City include Shougang Jingtang, Qian’an Shougang, Hebei Iron and Steel Group, and various large-scale mining mechanization enterprises. At the same time, the surrounding supporting transportation facilities and the upstream and downstream industrial chains are complete. This has resulted in a large number of industrial enterprises distributed around the central urban areas such as Fengrun District, Fengnan District, Lubei District, and Lunan District, forming a large-scale resource-based industry distribution center, which has also become a gathering area of low-value habitat quality. The Caofeidian District and Laoting County in the southern and southwestern coastal areas rely on the state-owned farms and the wetlands and tidal flats in the ecological security control area of Tangshan City. In recent years, they have vigorously developed high-quality ecological projects such as the Tangshan Bay Eco-city and the Tangshan International Tourism Island Project. Therefore, many state-owned farms such as Guhe Township, Maheying Town, and others have formed significant habitat clusters with medium and high values. Most of the towns in the northern region have a high altitude, abundant rainfall, lush forests and steep terrain, leading to a low degree of artificial development in the northern region, which in turn fosters a high-value habitat area.
The differential evolution of the spatial pattern of habitat quality is a result of the combined effect of many factors. Lefebvre’s space production theory shows that space has three levels: spatial representation, spatial practice, and representation space (Lefebvre, 1991). The process by which the habitat quality is changed is the process of spatial practice, and space practice is closely related to the spatial representation and the representation space. Based on the geo-detector analysis of the three major types of spatial differentiation elements, we have summarized the formation mechanism of the spatial differentiation of habitat quality in Tangshan City based on space production theory (Fig. 6). The original habitat of Tangshan City is mainly affected by natural factors such as elevation, slope, precipitation, etc. The original high-quality habitat is distributed in areas which are more suitable for species to survive, i.e., those with abundant rainfall, high vegetation coverage and a comfortable climate. Urbanization is the main driving force for the change of Tangshan’s primitive habitat. The government, as the holder of space rights, comprehensively considers nature, population, economic development, transportation and other factors to implement spatial representation in a certain area, and carry out spatial practice based on spatial representation. The places with the flat terrain, comfortable climate, densest population and convenient transportation are the first to transform because they are conducive to human life and production. As a result, the type of habitat is changed and the quality of the habitat is reduced in those transformed areas. Therefore, the interaction values of natural environmental conditions, such as elevation and slope, and urbanization factors, such as population density and traffic road network density, are all above 0.70. At the same time, along with the practice of space, the cumulative representation space of the government’s governance philosophy also plays a role. For example, in the past few decades, economic development and income growth brought about by industrialization have always been the primary goals of local governments and the people. The government and factories take industrialization as the main consideration factor in the spatial representation, which leads to the habitat being constantly changed and transformed in the practice of space. The places where the original habitat of the region is more suitable for industrialization are more likely to be transformed and destroyed. For example, areas with well-developed transportation and densely populated areas are conducive to the development of construction and raw material industries. Therefore, these areas become non-optimal habitats. This phenomenon has been verified by the interaction detection results, which show that the density of the traffic road network, population density, raw material industry density, and construction industry density all have a double-factor enhancement and the detection values are all higher than 0.50. However, when industrialization advances to a certain extent, the government is faced with the problems of resource exhaustion and ecological deterioration, so the government needs to change its governance philosophy to undertake the transformation and upgrading of resource-based industries and meet the growing spiritual and cultural needs of the people. As a result, many representative spaces such as wetland reserves and tourist resource-rich areas have been protected and reconstructed to become new high-quality habitat areas. That is, the government’s governance philosophy and the spiritual needs of the people affect the space practice together. In the end, areas with high vegetation coverage, beautiful landscape patterns, low terrain, and a comfortable climate become the large-scale high-value habitat areas; while areas with concentrated populations, rich resources, and convenient transportation become large-scale low-value habitat areas.

4 Discussion

4.1 The suitability of using POI data in urban habitat quality research

The most widely used data in current habitat quality research are traditional land use data and social-economic data. The former comes from satellite images, and the latter are often statistical data. However, the industrial statistical data cannot accurately reflect the spatial location of the pollution-intensive industries (Bai et al., 2019). With rich information, POI data are closely related to urbanization and human mobility, so they are increasingly useful in analyzing urban ecological and environmental problems (Liu et al., 2021b; Min et al., 2019). This paper uses POI data and kernel density statistics to analyze the spatial distributions of various industrial sectors, which can accurately locate the various industrial enterprises and determine the impacts of different resource industry layouts on the spatial differentiation of urban habitat quality. This approach may provide a new way to facilitate habitat quality research in empirical studies.
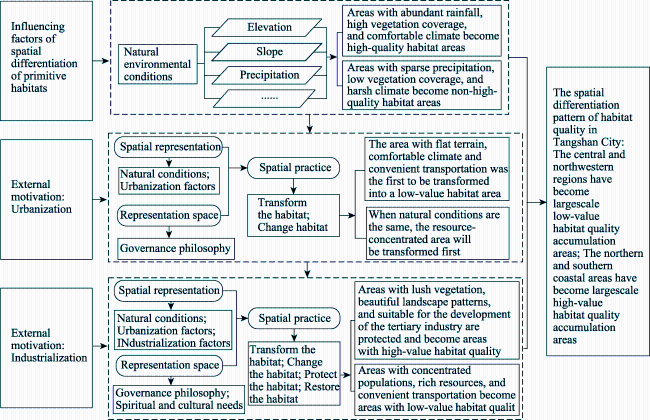
Fig. 6 Mechanism of factors influencing the spatial differentiation of habitat quality in Tangshan City

4.2 Contributions and limitations

Compared with existing research, the comprehensive model adopted in this study allows the habitat assessment to consider both the closest natural state and the benefits provided to humans. This study enriches the research results of resource-based city habitat quality, and provides a scientific theoretical basis for the construction of the ecological security pattern and the sustainable development of resource-based cities. Tangshan’s high habitat quality areas are distributed in mountainous areas in the north and wetlands and coastal beaches in the south, while low habitat quality areas are mostly distributed in the middle flat region where most of the population and resource processing industrial enterprises are located. Interestingly, the resource extractive industrial companies are primarily located in the northern mountain area with a relatively high habitat quality. This probably can be explained by Tangshan government’s ecological protection zone (EPZ) designation and industrial upgrading actions in recent years (Tangshan City Land Use Master Plan (2006-2020), 2011). The government has set EPZs in the northern mountain area and the southern coastal beach area and shut down some of the most destructive extractive industries. Compared with other types of resource- based cities, regenerative cities have achieved certain results in exploring new development models. Tangshan City, as a representative of a typical renewable resource-based city, has adopted green development measures in recent years which can be used as a reference for other cities: 1) Rational allocation of industrial land distribution; 2) Development and implementation of more industry upgrading management plans based on the accumulation of resource-based industries; 3) Vigorous development of the tertiary industry, relying on natural resources and geographical advantages; and 4) Delimitation of natural ecological protection areas and implementation of strict ecological protection policies. Although taking the path of green transformation and low-carbon transformation is a common choice for resource-based cities, more specific road choices should be determined according to the city’s own actual problems and conditions. In general, the preliminary framework for the mechanism of factors influencing the spatial differentiation of habitat quality proposed in this paper can provide a preliminary basis for subsequent research on the spatial and temporal evolution mechanisms of habitat quality in resource-based cities at home and abroad. It also has a certain reference value for accelerating industrial transformation and upgrading and optimizing the pattern of ecological security in resource-based cities.
However, there are still some shortcomings. For example, the selection of indicators for factors affecting habitat quality may not be comprehensive. The development of resource-based cities is greatly affected by laws and policies. Due to data limitations, this study did not include certain factors affecting ecological management and control policies such as returning farmland to forests, ecological safety zones, and major functional areas, which may cause some deviations in the research conclusions. As another limitation, we used 2019 data to investigate the spatial differentiation of habitat quality in Tangshan City and explore its impact mechanisms. The development of resource-based cities has apparent phases. Subsequent in-depth research can be carried out on the temporal and spatial changes of the impact mechanisms of the inter-period dimension on the habitat quality.

5 Conclusions

Taking Tangshan, a typical resource-based city as the research area, this paper integrates the land patch-based habitat quality assessment and InVEST-habitat quality model to evaluate the habitat quality value and then applies spatial autocorrelation and the nuclear density method to analyze the spatial differentiation pattern of the habitat quality in the study area. Furthermore, as an important influencing factor, this study introduces the resource industrial structure layout into the geographic detector model based on multi-source data and explores how the nature- and human-driven factor interactions influence the habitat quality spatial pattern quantitatively. Finally, this study tries to use Lefebvre’s space production theory to explain the spatial differentiation mechanism of habitat quality in Tangshan City.
The results show that: 1) The total value of Tangshan’s habitat quality in 2019 is 3.45×10¹⁰ yuan, and the value of habitat quality presents a significant spatial differentiation. Habitat quality hot spots are mainly distributed in the north and south of Tangshan City, while cold spots are concentrated in the central and western regions. 2) The distribution of the raw material industry, construction, and extractive industries has a significant negative spatial correlation with habitat quality. High habitat quality areas are mostly concentrated in areas with low resource industry intensity. 3) The geographic detector factor analysis results show that natural environmental conditions are the decisive factor affecting the spatial differentiation of habitat quality in Tangshan City, and urbanization and industrialization factors are the external forces driving the spatial differentiation of habitat quality. The effects of each factor in descending order are as follows: average elevation, average slope, population density, industrial density, average annual precipitation, construction industry density, GDP per unit area, and traffic road network density. 4) The interaction detector reveals that the interactions of any two factors on habitat quality are all enhanced. Natural environmental conditions, socioeconomic conditions, and resource industry layout are interdependent and interactive in space, indicating that the quality of regional habitat results from the combined effects of multiple influencing factors.
[1]
Arkema K, Bernhardt J, Bierbower W. 2019. InVEST user guide.http://releases.naturalcapitalproject.org/invest-userguide/latest/#

[2]
Bai L M, Feng X H, Sun R F, et al. 2020. Spatial and temporal responses of habitat quality to urbanization: A case study of Changchun City, Jilin Province, China. Journal of Applied Ecology, 31(4): 1267‒1277. (in Chinese)

[3]
Bai L M, Xiu C L, Feng X H, et al. 2019a. Influence of urbanization on regional habitat quality: A case study of Changchun City. Habitat International, 93:102042. DOI: 10.1016/j.habitatint.2019.102042.

[4]
Bai L, Jiang L, Yang D Y, et al. 2019b. Quantifying the spatial heterogeneity influences of natural and socioeconomic factors and their interactions on air pollution using the geographical detector method: A case study of the Yangtze River Economic Belt, China. Journal of Cleaner Production, 232: 692‒704.

[5]
Chang J, Zhang H, Ji M, et al. 2009. Case study on the redevelopment of industrial wasteland in resource-exhausted mining area. Procedia Earth and Planetary Science, 1(1): 1140‒1146.

[6]
Costanza R, dArge R, deGroot R, et al. 1997. The value of the world’s ecosystem services and natural capital. Nature, 387(6630):253-260.

[7]
Dai L M, Li S L, Lewis B J, et al. 2019. The influence of land use change on the spatial-temporal variability of habitat quality between 1990 and 2010 in Northeast China. Journal of Forestry Research, 30(6): 2227-2236.

[8]
Falcucci A, Maiorano L, Boitani L. 2007. Changes in land-use/land-cover patterns in Italy and their implications for biodiversity conservation. Landscape Ecology, 22(4): 617-631

[9]
Foley J A, Defries R, Asner G P, et al. 2005. Global consequences of land use. Science, 309(5734): 570-574.

[10]
Forman R T T. 2000. Estimate of the area affected ecologically by the road system in the United States. Conservation Biology, 14(1): 31-35.

[11]
Getis A, Ord J K 1992. The analysis of spatial association by use of distance statistics. Geographical Analysis, 24(3): 189-206

[12]
Han Y W, Kang W M, Thorne J, et al. 2019. Modeling the effects of landscape patterns of current forests on the habitat quality of historical remnants in a highly urbanized area. Urban Forestry & Urban Greening, 41:354-363.

[13]
He J H, Huang J L, Li C. 2017a. The evaluation for the impact of land use change on habitat quality: A joint contribution of cellular automata scenario simulation and habitat quality assessment model. Ecological Modelling, 366:58-67.

[14]
He S Y, Lee J, Zhou T, et al. 2017 b. Shrinking cities and resource-based economy: The economic restructuring in China’s mining cities. Cities, 60:75-83.

[15]
He Y F, Xie H L. 2019. Exploring the spatiotemporal changes of ecological carrying capacity for regional sustainable development based on GIS: A case study of Nanchang City. Technological Forecasting and Social Change, 148:119720. DOI: 10.1016/j.techfore.2019.119720.

[16]
Hooper D U, Chapin F S, Ewel J J, et al. 2005. Effects of biodiversity on ecosystem functioning: A consensus of current knowledge. Ecological Monographs, 75(1): 3‒35.

[17]
Johnson M D. 2007. Measuring habitat quality: A review. The Condor, 109(3): 489-504

[18]
Jorgensen J C, Honea J M, McClure M M, et al. 2009. Linking landscape-level change to habitat quality: An evaluation of restoration actions on the freshwater habitat of spring-run Chinook salmon. Freshwater Biology, 54(7): 1560-1575.

[19]
Kempton R A. 1979. The structure of species abundance and measurement of diversity. Biometrics, 351: 307-321

[20]
Lefebvre H. 1991. The production of space. Oxford, UK: Blackwell, 1-40.

[21]
Li H J, Long R Y, Chen H. 2013. Economic transition policies in Chinese resource-based cities: An overview of government efforts. Energy Policy, 55: 251‒260.

[22]
Liu B, Wang J M, Jing Z R, et al. 2020. Measurement of sustainable transformation capability of resource-based cities based on fuzzy membership function: A case study of Shanxi Province, China. Resources Policy, 68:101739. DOI: 10.1016/j.resourpol.2020.101739.

[23]
Liu C F, Wang C, Liu L. 2018. Spatio-temporal variation on habitat quality and its mechanism within the transitional area of the Three Natural Zones: A case study in Yuzhong County. Geographical Research, 37(2): 419-432. (in Chinese)

[24]
Liu X, Andris C, Rahimi S. 2019. Place niche and its regional variability: Measuring spatial context patterns for points of interest with representation learning. Computers, Environment and Urban Systems, 75: 146‒160.

[25]
Liu Y G. 2009. The functional classification and the characteristics of functional transition of Chinese resource-based cities. Geographical Research, 28(1): 153-160. (in Chinese)

[26]
Liu Y L, Chen Y Y, Wu Z H, et al. 2021a. Geographical detector-based stratified regression kriging strategy for mapping soil organic carbon with high spatial heterogeneity. CATENA, 196:104953. DOI: 10.1016/j.cate na.2020.104953.

[27]
Liu Z H, Huang Q D, Yang H Y. 2021b. Supply-demand spatial patterns of park cultural services in megalopolis area of Shenzhen, China. Ecological Indicators, 121:107066. DOI: 10.1016/j.ecolind.2020.107066.

[28]
Min M, Lin C, Duan X J, et al. 2019. Spatial distribution and driving force analysis of urban heat island effect based on raster data: A case study of the Nanjing Metropolitan Area, China. Sustainable Cities and Society, 50:101637. DOI: 10.1016/j.scs.2019.101637.

[29]
Moreira M, Fonseca C, Vergílio M, et al. 2018. Spatial assessment of habitat conservation status in a Macaronesian island based on the InVEST model: A case study of Pico Island (Azores, Portugal). Land Use Policy, 78:637-649.

[30]
People’s Government of Tangshan City. 2011. Tangshan City Land Use Master Plan(2006-2020). http://ts.hebgt.gov.cn/ts/xxgk/ghtj/gtgh/101 460187729959.html

[31]
Romero-Calcerrada R, Luque S. 2006. Habitat quality assessment using Weights-of-Evidence based GIS modelling: The case of Picoides tridactylus as species indicator of the biodiversity value of the Finnish forest. Ecological Modelling, 196(1-2):62-76.

[32]
Ruan F L, Yan L, Wang D. 2020. The complexity for the resource-based cities in China on creating sustainable development. Cities, 97:102571. DOI: 10.1016/j.cities.2019.102571.

[33]
Sallustio L, De Toni A, Strollo A, et al. 2017. Assessing habitat quality in relation to the spatial distribution of protected areas in Italy. Journal of Environmental Management, 201: 129‒137.

[34]
Sun X Y, Jiang Z, Liu F, et al. 2019. Monitoring spatio-temporal dynamics of habitat quality in Nansihu Lake basin, Eastern China, from 1980 to 2015. Ecological Indicators, 102:716-723.

[35]
Tang Q, Wang J M, Jing Z R. 2021. Tempo-spatial changes of ecological vulnerability in resource-based urban based on genetic projection pursuit model. Ecological Indicators, 121:107059. DOI: 10.1016/j.ecolind.2020.107059.

[36]
Terrado M, Sabater S, Chaplin-Kramer B, et al. 2016. Model development for the assessment of terrestrial and aquatic habitat quality in conservation planning. Science of the Total Environment, 540: 63‒70.

[37]
Vanhorne B. 1983. Density as a misleading indicator of habitat quality. Journal of Wildlife Management, 474: 893-901

[38]
Wan L, Ye X, Lee J, et al. 2015. Effects of urbanization on ecosystem service values in a mineral resource-based city. Habitat International,46: 54-63.

[39]
Wang J F, Xu C. 2017. Geodetector: Principle and prospective. Acta Geographica Sinica, 72(1): 116-134. (in Chinese)

[40]
Wang Y, Li X, Zhang F, et al. 2020. Effects of rapid urbanization on ecological functional vulnerability of the land system in Wuhan, China: A flow and stock perspective. Journal of Cleaner Production, 248:119284. DOI: 10.1016/j.jclepro.2019.119284.

[41]
Wu J S, Cao Q W, Shi S Q, et al. 2015. Spatio-temporal variability of habitat quality in Beijing-Tianjin-Hebei Area based on land use change. Chinese Journal of Applied Ecology, 26(11): 3457‒3466. (in Chinese)

[42]
Wu J, Bai Z K, Zhao X J. 2020a. Research on the urbanization process of resource-based cities and the ecological risks of land use. China Mining Magazine, 29(8): 60-68. (in Chinese)

[43]
Wu J, Mao J, Lin Q, et al. 2017. Urban growth boundary based on the evaluation of habitat quality: Taking the Yangtze River Delta as an example. Scientia Geographica Sinica, 37(1): 28-36. (in Chinese)

[44]
Wu X, Zhang J J, Geng X L, et al. 2020b. Increasing green infrastructure-based ecological resilience in urban systems: A perspective from locating ecological and disturbance sources in a resource-based city. Sustainable Cities and Society, 61:102354. DOI: 10.1016/j.scs.2020.102354.

[45]
Wu Y X, Deng N. 2019. Resource-based city ecological security early warning based on RBF Neural Network Model—Taking Yulin City as an example. Ecological Economy, 35(5): 111-118. (in Chinese)

[46]
Xie G D, Zhen L, Lu C X, et al. 2008. Expert knowledge based valuation method of ecosystem services in China. Journal of Natural Resources, 23(5): 911-919. (in Chinese)

[47]
Yan D, Kong Y, Ye B, et al. 2019. Spatial variation of energy efficiency based on a Super-Slack-Based Measure: Evidence from 104 resource- based cities. Journal of Cleaner Production, 240:117669. DOI: 10.101 6/j.jclepro.2019.117669.

[48]
Yi P T, Li W W, Zhang D N. 2021. Sustainability assessment and key factors identification of first-tier cities in China. Journal of Cleaner Production, 281. DOI: 10.1016/j.jclepro.2020.125369.

[49]
Zeng L J, Wang J F, Zhang J S, et al. 2020. New urbanization paths in mineral resource abundant regions in China: A three-dimensional cube framework. Resources Policy, 68:101709. DOI: 10.1016/j.resourpol.2020.101709.

[50]
Zhai T L, Wang J, Fang Y, et al. 2020. Assessing ecological risks caused by human activities in rapid urbanization coastal areas: Towards an integrated approach to determining key areas of terrestrial-oceanic ecosystems preservation and restoration. Science of the Total Environment, 708:135153. DOI: 10.1016/j.scitotenv.2019.135153.

[51]
Zhang H, Zhang C, Hu T, et al. 2020a. Exploration of roadway factors and habitat quality using InVEST. Transportation Research Part D: Transport and Environment, 87:102551. DOI: 10.1016/j.trd.2020.102551.

[52]
Zhang X R, Song W, Lang Y Q, et al. 2020b. Land use changes in the coastal zone of China’s Hebei Province and the corresponding impacts on habitat quality. Land Use Policy, 99:104957. DOI: 10.1016/j.landusepol.2020.104957.

[53]
Zhu C M, Zhang X L, Zhou M M, et al. 2020. Impacts of urbanization and landscape pattern on habitat quality using OLS and GWR models in Hangzhou, China. Ecological Indicators, 117:106654. DOI: 10.1016/j.ecolind.2020.106654.

Outlines

/