
Journal of Resources and Ecology >
Economic Contribution of Forestry Sector to National Economy in Nepal
|
Bharat Prashad BHATT, E-mail: bharatiof@gmail.com |
Received date: 2020-09-18
Accepted date: 2021-03-20
Online published: 2021-11-22
Forests are major sources of energy, timber and non-timber forest products, medicinal and aromatic plants, hydrological functions, biodiversity conservation, and also fundamental sources of revenue collection to the nation. Studies indicate that forests could significantly enhance economic growth and create employment opportunities for local communities under intensive management. This paper aims to predict the contribution of the forest sector to the national economy. The economic facets of forestry considered in this paper are revenue generated from timber, non-timber forest products (NTFPs) and medicinal and aromatic plants (MAPs), and protected areas. The ARIMA model was used to forecast the economic contribution of the forestry sector. The study found that the total revenue generated from the selling of timber and fuelwood (USD 50.19 million) was higher than the total revenue collected from protected areas (USD 37.58 million) and NTFPs/MAPs (USD 6.9 million) in the past 15 years. The model projected that the mean revenue for the timber and fuelwood sale will USD 3.5 million for the next ten years. Similarly, the mean revenue will be generated about USD 0.5 million and USD 6.2 million from NTFPs/MAPs and protected areas, respectively, for the next ten years. The study limits to take account the in-kind use of forest products such as timber, fodder, fuelwood, etc., as used by community people within a forest users’ groups. Thus, practicing sustainable forest management, enabling policy documents, establishing forest-based industries, establishing forestry nurseries, conducting agroforestry practices, and tenure security could enhance the forestry sector's economic aspects.
Key words: economy; revenue; timber; non-timber forest products
Bharat Prashad BHATT , Sagar GODAR CHHETRI , Thakur SILWAL , Megharaj POUDEL . Economic Contribution of Forestry Sector to National Economy in Nepal[J]. Journal of Resources and Ecology, 2021 , 12(5) : 620 -627 . DOI: 10.5814/j.issn.1674-764x.2021.05.005
Table 1 Quantity of timber, fuelwood, NTFPs/MAPs sale and revenue generated from them between 2003 to 2017 in Nepal. |
| S.N. | Fiscal year | Revenue from timber and fuelwood sale | Revenue from NTFPs/MAPs sale | Revenue from PAs | |||
|---|---|---|---|---|---|---|---|
| Timber sale (m3) | Fuelwood sale (m3) | Revenue (×103 USD) | NTFP and MAP sale (t) | Revenue (×103 USD) | Revenue (×103 USD) | ||
| 1 | 2003/2004 | 52127.88 | 32050.00 | 3887.63 | 7574.63 | 386.45 | 687.94 |
| 2 | 2004/2005 | 32538.09 | 27173.10 | 2574.46 | 5349.42 | 681.85 | 486.67 |
| 3 | 2005/2006 | NA | NA | NA | NA | NA | 563.73 |
| 4 | 2006/2007 | 35773.17 | 25762.05 | 2783.74 | 20804.20 | 477.57 | 825.39 |
| 5 | 2007/2008 | 35105.66 | 23400.05 | 2642.63 | 44580.33 | 1038.73 | 1029.14 |
| 6 | 2008/2009 | 36247.64 | 26660.14 | 3117.70 | 33294.67 | 869.56 | 1182.16 |
| 7 | 2009/2010 | 33191.42 | 19157.41 | 2855.44 | 32503.32 | 617.10 | 1225.41 |
| 8 | 2010/2011 | 1569.41 | 5090.57 | 213.62 | 6226.83 | 438.16 | 1832.71 |
| 9 | 2011/2012 | 19047.55 | 6186.33 | 3314.79 | 10618.59 | 239.67 | 2256.68 |
| 10 | 2012/2013 | 22309.76 | 9156.51 | 5374.51 | 10188.54 | 339.10 | 4114.34 |
| 11 | 2013/2014 | 19485.42 | 15834.18 | 5356.73 | 21153.39 | 746.45 | 4633.80 |
| 12 | 2014/2015 | 8751.18 | 4948.55 | 2599.45 | 3079.02 | 265.16 | 4702.43 |
| 13 | 2015/2016 | 15889.83 | 8993.27 | 4348.80 | 8819.88 | 376.50 | 3056.93 |
| 14 | 2016/2017 | 15105.15 | 79131.80 | 2906.12 | 1653.05 | NA | 4815.93 |
| 15 | 2017/2018 | 32357.26 | 25502.88 | 8214.32 | 5234.88 | 407.69 | 6161.79 |
| Total revenue | 50189.94 | 6913.65 | 37575.05 | ||||
Note: Source: DOF, DNPWC 2003-2018; NA: data not available; 1 USD = 114.56 NRS on December 1, 2019. |
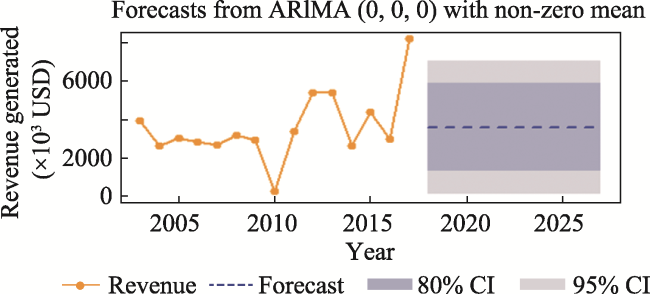
Fig. 1 Revenue forcast from timber and fuelwood for next ten years |
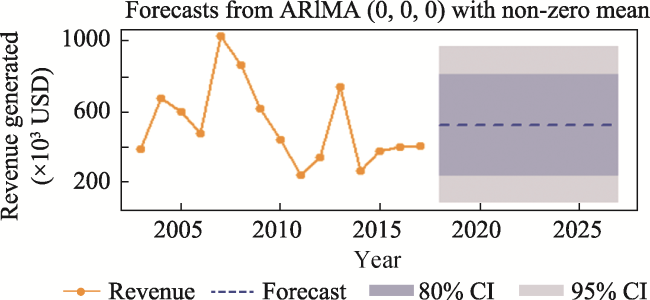
Fig. 2 Revenue forecast from NTFPs for next ten years |
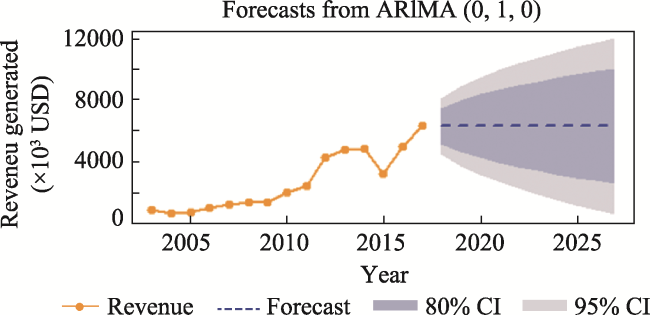
Fig. 3 Revenue forcast from PAs for next ten years |
Table 2 Ten-year forecast of revenue from Protected Areas in Nepal |
| Year | Point Forecast (×103 USD) | Lower CI* at 80% | Higher CI* at 80% | Lower CI* at 95% | Higher CI* at 95% |
|---|---|---|---|---|---|
| 2018 | 6161.79 | 4971.91 | 7351.67 | 4342.02 | 7981.56 |
| 2019 | 6161.79 | 4479.04 | 7844.54 | 3588.25 | 8735.33 |
| 2020 | 6161.79 | 4100.85 | 8222.73 | 3009.86 | 9313.72 |
| 2021 | 6161.79 | 3782.02 | 8541.56 | 2522.25 | 9801.33 |
| 2022 | 6161.79 | 3501.13 | 8822.45 | 2092.66 | 10230.92 |
| 2023 | 6161.79 | 3247.18 | 9076.40 | 1704.28 | 10619.30 |
| 2024 | 6161.79 | 3013.65 | 9309.93 | 1347.13 | 10976.45 |
| 2025 | 6161.79 | 2796.29 | 9527.29 | 1014.70 | 11308.88 |
| 2026 | 6161.79 | 2592.14 | 9731.44 | 702.48 | 11621.10 |
| 2027 | 6161.79 | 2399.05 | 9924.53 | 407.17 | 11916.41 |
Note: * CI means confidence interval. |
| [1] |
AEC/FNCCI. 2012. Balanced economic growth, one district one product (ODOP): Local employment, income generation and food security. A Report of Federation of Nepalese Chambers of Commerce and Industry, Agro Enterprise Centre. Kathmandu, Nepal.
|
| [2] |
|
| [3] |
|
| [4] |
|
| [5] |
|
| [6] |
|
| [7] |
|
| [8] |
|
| [9] |
|
| [10] |
|
| [11] |
DFRS(Department of Forest Research and Survey), NFA(Nepal Forester’s Association). 2008. Contribution of forestry sector to gross domestic product in Nepal. Department of Forest Research and Survey and Nepal Foresters Association, Babarmahal, Kathmandu, Nepal.
|
| [12] |
DFRS(Department of Forest Research and Survey). 2015. States of Nepal’s Forests. Forest Research and Training Center, Forest Resource Assessment, Ministry of Forests and Environment, Nepal.
|
| [13] |
|
| [14] |
DNPWC. 2017. Annual Report, Fiscal Year 2016-2017. Department of National Parks and Wildlife Conservation, Babarmahal, Kathmandu, Nepal.
|
| [15] |
DOC. 2019. Annual Nepal foreign trade statistics. Department of Customs, Tripureshwor, Kathmandu, Nepal.
|
| [16] |
DOF. 2016. Hamro Ban, Annual Report for Fiscal Year 2015/2016. Department of Forests and Soil Conservation, Ministry of Forests and Environment, Nepal.
|
| [17] |
DOI. 2013. Industrial Statistics: Fiscal Year 2012/2013. Department of Industry, Nepal.
|
| [18] |
FAO. 2009. State of the world’s forests. Food and Agriculture Organization of the United Nations, Rome, Italy.
|
| [19] |
FAO. 2004. Trends and current status of the contribution of the forestry sector to national economies. Working paper FSFM/ACC/07. Food and Agriculture Organization of the United Nations, Rome, Italy.
|
| [20] |
FSS. 2016. Forest sector strategy (2016-25). Ministry of Forests and Environment, Nepal.
|
| [21] |
|
| [22] |
|
| [23] |
|
| [24] |
|
| [25] |
MoF. 2019. Economic Survey, Fiscal Year 2018/19. Ministry of Finance, Government of Nepal, Kathmandu, Nepal.
|
| [26] |
MSFP. 2014. Private sector involvement and investment in Nepal’s forestry: Status, prospects and ways forward. Multi Stakeholder Forestry Programme, Kathmandu, Nepal.
|
| [27] |
NPC. 2002. The tenth plan (2002-2007). His Majesty Government, National Planning Commission, Kathmandu, Nepal.
|
| [28] |
NPC. 2007. The eleventh three-year interim plan (2007/08-2009/10). National Planning Commission, Government of Nepal, Kathmandu, Nepal.
|
| [29] |
NPC. 2016. Fourteenth three-year interim plan (2016/17-2018/19). National Planning Commission, Government of Nepal, Kathmandu, Nepal.
|
| [30] |
|
| [31] |
|
| [32] |
|
| [33] |
|
| [34] |
|
| [35] |
|
| [36] |
|
| [37] |
|
| [38] |
|
| [39] |
|
| [40] |
|
| [41] |
|
| [42] |
|
| [43] |
|
| [44] |
|
| [45] |
|
| [46] |
|
| [47] |
|
| [48] |
|
| [49] |
|
/
| 〈 |
|
〉 |