
Journal of Resources and Ecology >
Spatio-temporal Pattern of Surface Albedo in Beijing and Its Driving Factors based on Geographical Detectors
|
LIU Qinqin, E-mail: liuqinqin18@163.com |
Received date: 2021-01-08
Accepted date: 2021-04-02
Online published: 2021-11-22
Supported by
The Major Project of High Resolution Earth Observation System(06-Y30F04-9001-2022)
The National Natural Science Foundation of China(41471423)
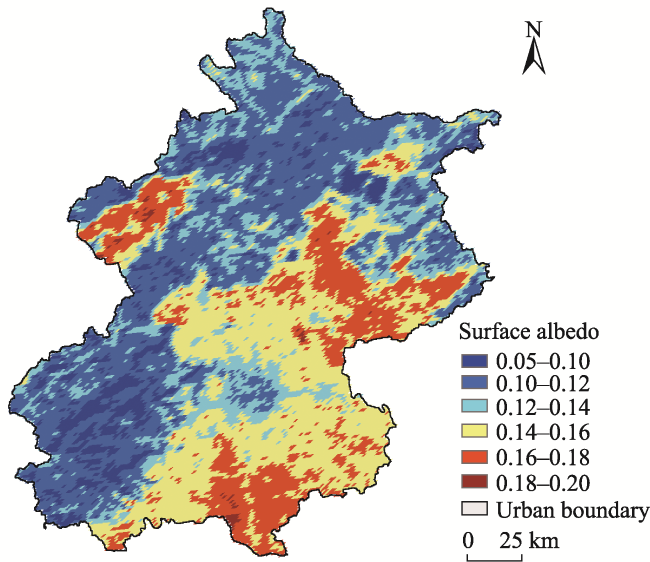
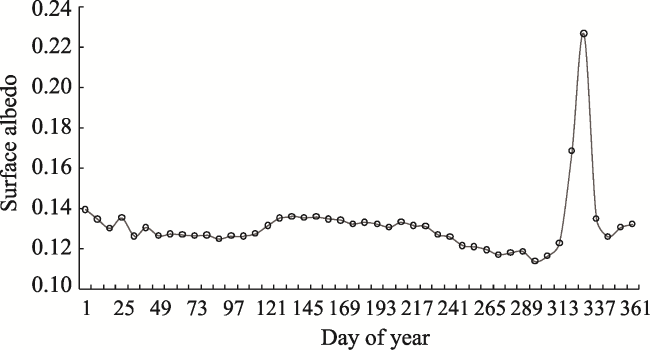
Surface albedo directly affects the radiation balance and surface heat budget, and is a crucial variable in local and global climate research. In this study, the spatial and temporal distribution of the surface albedo is analysed for Beijing in 2015, and the corresponding individual and interactive driving forces of different explanatory factors are quantitatively assessed based on geographical detectors. The results show that surface albedo is high in the southeast and low in the northwest of Beijing, with the greatest change occurring in winter and the smallest change occurring in spring. The minimum and maximum annual surface albedo values occurred in autumn and winter, respectively, and showed significant spatial and temporal heterogeneity. LULC, NDVI, elevation, slope, temperature, and precipitation each had a significant influence on the spatial pattern of albedo, yielding explanatory power values of 0.537, 0.625, 0.512, 0.531, 0.515 and 0.190, respectively. Some explanatory factors have significant differences in influencing the spatial distribution of albedo, and there is significant interaction between them which shows the bivariate enhancement result. Among them, the interaction between LULC and NDVI was the strongest, with a q-statistic of 0.710, while the interaction between temperature and precipitation was the weakest, with a q-statistic of 0.531. The results of this study provide a scientific basis for understanding the spatial and temporal distribution characteristics of surface albedo in Beijing and the physical processes of energy modules in regional climate and land surface models.
LIU Qinqin , TIAN Yichen , YIN Kai , ZHANG Feifei , YUAN Chao , YANG Guang . Spatio-temporal Pattern of Surface Albedo in Beijing and Its Driving Factors based on Geographical Detectors[J]. Journal of Resources and Ecology, 2021 , 12(5) : 609 -619 . DOI: 10.5814/j.issn.1674-764x.2021.05.004
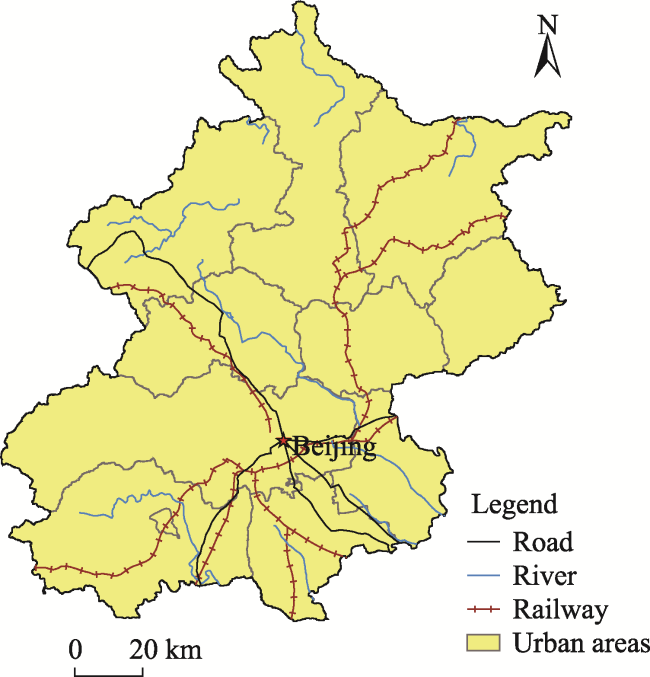
Fig. 1 Study area: Beijing, China. |
Fig. 2 Explanatory factor classification maps for (a) land use and land cover (LULC); (b) NDVI; (c) elevation; (d) slope; (e) annual mean temperature; and (f) annual cumulative precipitation. |
Table 1 Discretization results of explanatory factors |
| Factors | NDVI | Elevation | Slope | Temperature | Precipitation | |||||
|---|---|---|---|---|---|---|---|---|---|---|
| Values | Types | Values (m) | Types | Values (°) | Types | Values (℃) | Types | Values (mm) | Types | |
| 1 | 0.08-0.30 | N1 | ‒129‒158 | E1 | <2 | I | 2.5‒7.5 | T1 | 534‒565 | C1 |
| 2 | 0.30-0.37 | N2 | 158‒389 | E2 | 2‒6 | II | 7.5‒9.5 | T2 | 565‒575 | C2 |
| 3 | 0.37-0.44 | N3 | 389‒617 | E3 | 6‒15 | III | 9.5‒10.5 | T3 | 575‒585 | C3 |
| 4 | 0.44-0.50 | N4 | 617‒854 | E4 | 15‒25 | IV | 10.5‒12.0 | T4 | 585‒595 | C4 |
| 5 | 0.50-0.56 | N5 | 854‒1187 | E5 | >25 | V | 12.0‒13.5 | T5 | 595‒630 | C5 |
| 6 | 0.56-0.74 | N6 | 1187‒2270 | E6 | ‒ | ‒ | ‒ | ‒ | ‒ | ‒ |
Note: “‒” means that the data is only divided into five categories. |
Table 2 Types of interactions between two covariates |
| Description | Interaction | |
|---|---|---|
| 1 | $q(A\cap B)\text{}\ \text{min}\ \text{(}q(A),\ q(B)\text{)}$ | Weaken, nonlinear |
| 2 | $min\ (q(A),\ q(B))< q(A\cap B)< \max \ (q(A),\ q(B))$ | Weaken, univariate |
| 3 | $q(A\cap B)>\max \text{(}q(A),q(B)\text{)}$ | Enhance, bivariate |
| 4 | $q\left( A\cap B \right)=q\left( A \right)+q\left( B \right)$ | Independent |
| 5 | $q\left( A\cap B \right)>q\left( A \right)+q\left( B \right)$ | Enhance, nonlinear |
Fig. 3 Spatial pattern of annually averaged surface albedo in Beijing, 2015. |
Fig. 4 Intra-annual variations in the surface albedo of Beijing, 2015. |
Table 3 Seasonal averages of surface albedo in Beijing, 2015. |
| Seasons | Spring (day 30-120) | Summer (day 120-210) | Autumn (day 210-300) | Winter (day 300-30 of next year) |
|---|---|---|---|---|
| Mean | 0.127 | 0.134 | 0.122 | 0.142 |
| Standard deviation | 0.001 | 0.002 | 0.006 | 0.030 |
Table 4 Influence power index of the explanatory factors on the pattern of surface albedo in Beijing, 2015, and the significant differences between them. |
| Variables | LULC | NDVI | Elevation | Slope | Temperature | Precipitation |
|---|---|---|---|---|---|---|
| q-statistic | 0.537 | 0.625 | 0.512 | 0.531 | 0.515 | 0.190 |
| P value | 0.000 | 0.000 | 0.000 | 0.000 | 0.000 | 0.000 |
| LULC | - | - | - | - | - | - |
| NDVI | Y | - | - | - | - | - |
| Elevation | Y | Y | - | - | - | - |
| Slope | N | Y | N | - | - | - |
| Temperature | Y | Y | N | N | - | - |
| Precipitation | Y | Y | Y | Y | Y | - |
Notes: Y indicates a significant difference between explanatory factors at the 95% confidence level; N indicates no significant difference. |
Table 5 Interactions between explanatory factors in their influences of the spatial pattern of surface albedo in Beijing, 2015 |
| Variables | LULC | NDVI | Elevation | Slope | Temperature | Precipitation |
|---|---|---|---|---|---|---|
| LULC | 0.537 | |||||
| NDVI | 0.710* | 0.625 | ||||
| Elevation | 0.645* | 0.691* | 0.512 | |||
| Slope | 0.644* | 0.690* | 0.629* | 0.531 | ||
| Temperature | 0.641* | 0.689* | 0.553* | 0.630* | 0.515 | |
| Precipitation | 0.573* | 0.648* | 0.535* | 0.567* | 0.531* | 0.190 |
Notes: * indicates that the interaction results in bivariate enhancement. |
| [1] |
|
| [2] |
|
| [3] |
|
| [4] |
|
| [5] |
|
| [6] |
|
| [7] |
|
| [8] |
|
| [9] |
|
| [10] |
|
| [11] |
|
| [12] |
|
| [13] |
|
| [14] |
|
| [15] |
|
| [16] |
|
| [17] |
|
| [18] |
|
| [19] |
|
| [20] |
|
| [21] |
|
| [22] |
|
| [23] |
|
| [24] |
|
| [25] |
|
| [26] |
|
| [27] |
|
| [28] |
|
| [29] |
|
| [30] |
|
| [31] |
|
| [32] |
|
| [33] |
|
| [34] |
|
| [35] |
|
| [36] |
|
| [37] |
|
| [38] |
|
| [39] |
|
| [40] |
|
| [41] |
|
| [42] |
|
| [43] |
|
| [44] |
|
| [45] |
|
| [46] |
|
| [47] |
|
| [48] |
|
| [49] |
|
| [50] |
|
| [51] |
|
| [52] |
|
| [53] |
|
/
| 〈 |
|
〉 |
