
Journal of Resources and Ecology >
Analysis of the Spatio-temporal Changes in Acid Rain and Their Causes in China (1998-2018)
|
CHEN Xuan, E-mail:877046204@qq.com |
Received date: 2020-09-12
Accepted date: 2021-03-30
Online published: 2021-11-22
Supported by
The National Natural Science Foundation of China(U1701236)
The Science and Technology Planning Project of Guangdong Province(2019B030301007)
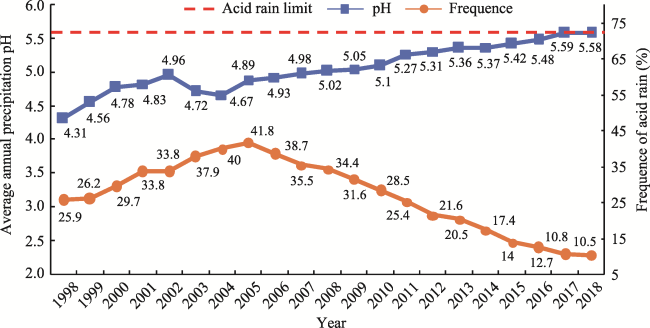
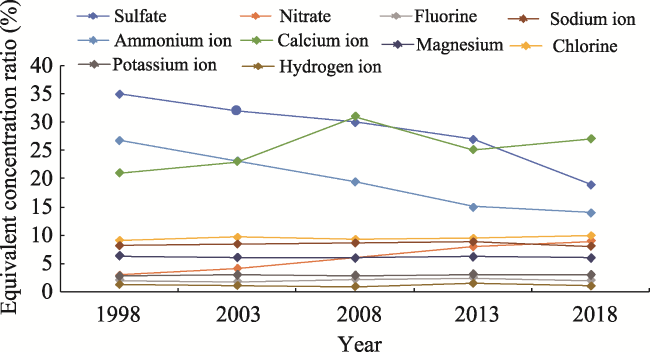
With the rapid development of the economy, acid rain has become one of the major environmental problems that endanger human health. Being the largest developing country, the environmental problems caused by acid rain are of increasing concern with the rapid industrialization and urbanization in China. Recently, many researchers have focused on acid rain. To better understand the temporal and spatial dynamics of acid rain in China, the monitoring data on acid rain from 1998 to 2018 were studied using ArcGIS 10.2. The results show that the proportion of acid rain cities, the frequency, and the area of acid rain were decreasing, however, the situation still remains serious. Overall, the chemical type of acid rain was mainly sulfuric acid rain. However, the concentration ratio of SO4 2-/NO3 - decreased by 81.90% in 2018 compared with 1998, and presented a decreasing trend, which indicates that the contribution of nitrate to precipitation acidity has been increasing year by year. This research will help us to understand the distribution characteristics and causes of acid rain in China, and it may provide an effective reference for the prevention and control of acid rain in China.
Key words: acid rain; pH; spatio-temporal change; chemical composition; trend
CHEN Xuan , SHAN Xiaoran , SHI Zhaoji , ZHANG Jiaen , QIN Zhong , XIANG Huimin , WEI Hui . Analysis of the Spatio-temporal Changes in Acid Rain and Their Causes in China (1998-2018)[J]. Journal of Resources and Ecology, 2021 , 12(5) : 593 -599 . DOI: 10.5814/j.issn.1674-764x.2021.05.002
Fig. 1 Average annual precipitation pH and frequency of AR in China from 1998 to 2018 |
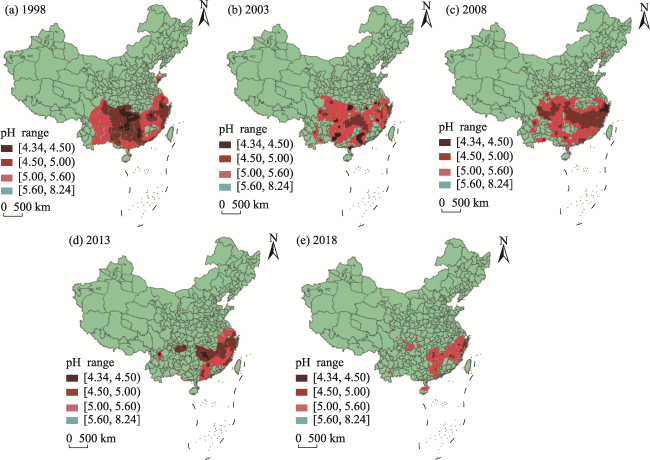
Fig. 2 Regional distribution of AR in China from 1998 to 2018 |
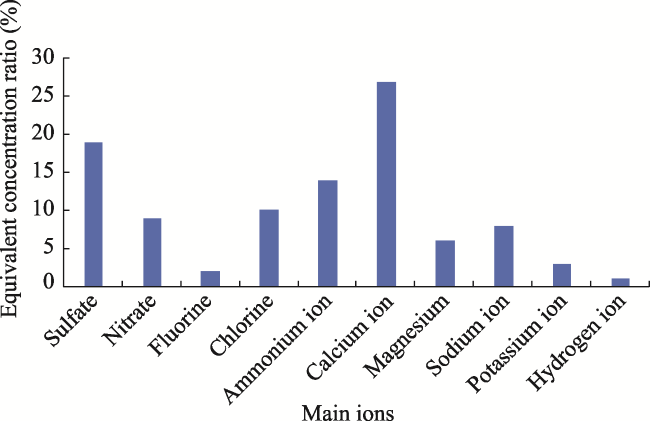
Fig. 3 Equivalent concentration ratios of the main ions in China in 2018 |
Fig. 4 Equivalent concentration ratios of the main ions in China from 1998 to 2018 |
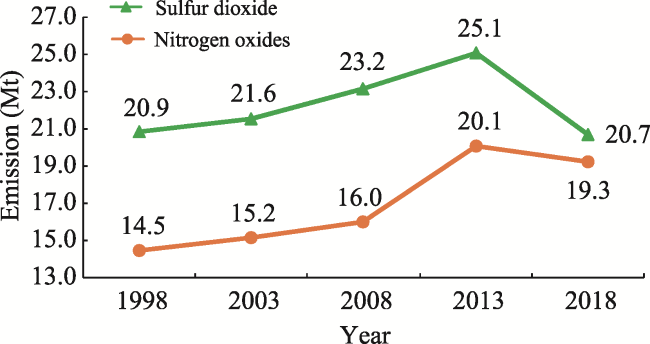
Fig. 5 Emissions of sulfur dioxide and nitrogen oxides in China from 1998 to 2018 |
Fig. 6 Variation of $C_{S{{O}_{4}}^{2-}}^{{}}C_{N{{O}_{3}}^{-}}^{{}}$ in precipitation in China from 1998 to 2018 |
| [1] |
|
| [2] |
|
| [3] |
|
| [4] |
|
| [5] |
|
| [6] |
|
| [7] |
|
| [8] |
|
| [9] |
|
| [10] |
|
| [11] |
|
| [12] |
|
| [13] |
|
| [14] |
|
| [15] |
|
| [16] |
|
| [17] |
Ministry of Ecology and Environment of the People’s Republic of China. 2019. Report on the Chinese Ecological Environment Bulletin(1998-2018). 2019-05-22]. (in Chinese)
|
| [18] |
|
| [19] |
|
| [20] |
|
| [21] |
|
| [22] |
|
| [23] |
|
| [24] |
|
| [25] |
|
| [26] |
|
| [27] |
|
| [28] |
|
| [29] |
|
| [30] |
|
| [31] |
|
/
| 〈 |
|
〉 |
