
Journal of Resources and Ecology >
Does the Environmental Supervision System Improve Air Quality in China? An Empirical Study using the Difference-in-Differences Model
Received date: 2021-03-15
Accepted date: 2021-05-31
Online published: 2021-11-22
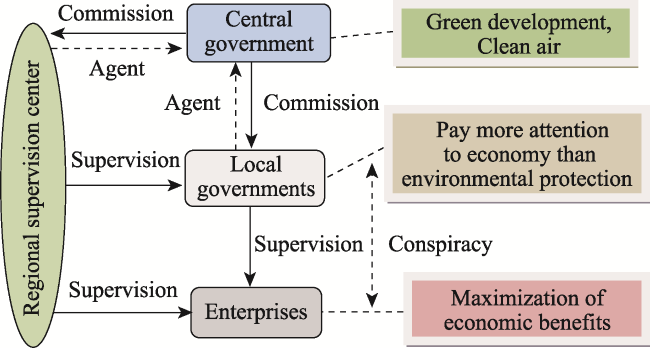
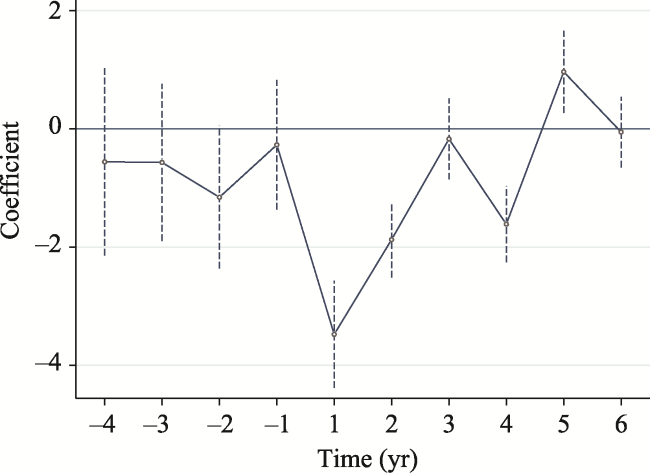
To effectively solve the problem of environmental pollution, the Chinese government has implemented an environmental supervision system since 2002. The environmental supervision system mainly uses the four functions of supervision, investigation, coordination, and emergency response to strengthen environmental protection supervision and law enforcement, respond to environmental emergencies, and coordinate cross-regional pollution disputes. As an important system design for China to control environmental pollution and promote the ecological transformation of economic development, the policy effect of the environmental supervision system deserves attention. This paper uses the difference-in-differences method to investigate the impact of the top-down environmental supervision system on air quality based on the 2000-2016 data for 285 prefecture-level cities in China. The results indicate that the annual average concentration of PM2.5 decreased significantly after the implementation of the environmental supervision system. The dynamic analysis shows that PM2.5 decreased most markedly in the first year after the implementation of the policy, and then the effect gradually weakened. Mechanism analysis suggests that the environmental supervision system can break the collusion between government and enterprise, encourage enterprises to carry out technological innovation, change pollutant discharge behavior and push local governments to adjust the industrial structure, enhance environmental protection awareness to reduce the PM2.5 concentration, and improve air quality. Comparing different regions, the PM2.5 in East China, North China and Northeast China are relatively high, and the pressure for air pollution control is great. Meanwhile, we find that the environmental supervision system has a significant station effect. Compared with other cities, the cities where the environmental supervision centers are located are more deterred by the environmental supervision, and their air quality has improved to a significantly greater degree. In the future, we should further strengthen the environmental supervision of high-pollution areas and non-station cities, and pay more attention to improving the long-term effect of the environmental supervision system.
CAO Zhiying , WANG Liangjian , WU Jiahao . Does the Environmental Supervision System Improve Air Quality in China? An Empirical Study using the Difference-in-Differences Model[J]. Journal of Resources and Ecology, 2021 , 12(5) : 581 -592 . DOI: 10.5814/j.issn.1674-764x.2021.05.001
Fig. 1 Principal-agent relation diagram of environmental protection |
Table 1 Establishment of environmental supervision centers in China |
| Region | Establishment year | Coverage area |
|---|---|---|
| East | 2002 | Shanghai, Jiangsu*, Zhejiang, Anhui, Fujian, Jiangxi, Shandong |
| South | 2002 | Hubei, Hunan, Guangdong*, Guangxi, Hainan |
| Northwest | 2006 | Shaanxi*, Gansu, Qinghai, Ningxia, Xinjiang |
| Southwest | 2006 | Chongqing, Sichuan*, Guizhou, Yunnan, Tibet |
| Northeast | 2006 | Liaoning*, Jilin, Heilongjiang |
| North | 2008 | Beijing*, Tianjin, Hebei, Shanxi, Inner Mongolia, Henan |
Note: * indicates the provinces where the environmental supervision centers are located. |
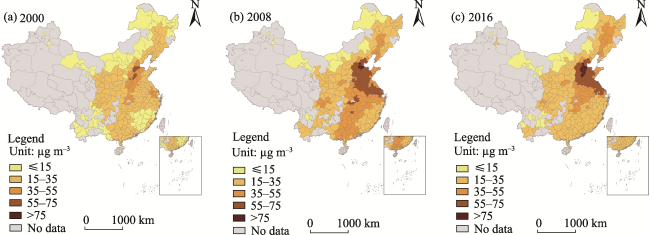
Fig. 2 PM2.5 in 2000, 2008 and 2016. |
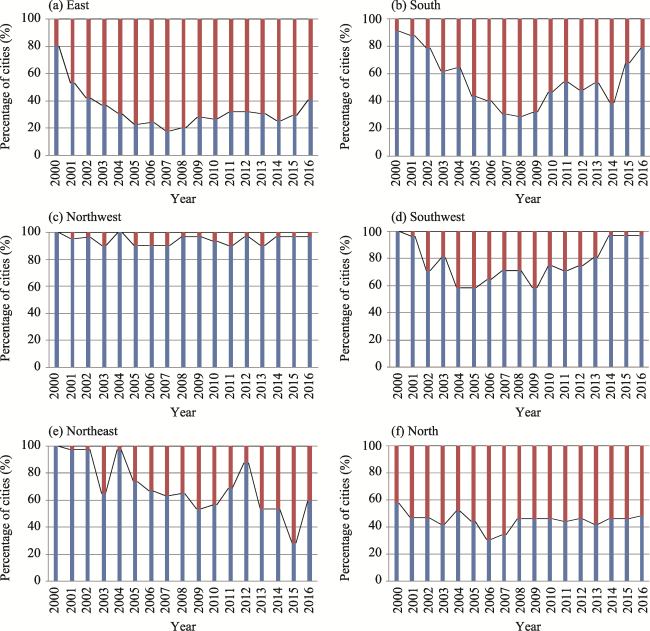
Fig. 3 The percentages of the high-pollution and low-pollution cities in different regions from 2000 to 2016 |
Table 2 Summary statistics and descriptions of variables |
| Variable name | Mean | S.D. | Description |
|---|---|---|---|
| PM2.5 | 35.111 | 16.130 | Average annual concentration of PM2.5 (μg m-3) |
| ln (population) | 5.843 | 0.695 | Logarithm of total population (×104 person) |
| Industry structure | 47.853 | 11.197 | The share of secondary industry in GDP |
| ln (PGDP) | 15.512 | 1.053 | Per capita GDP |
| FDI | 0.004 | 0.004 | Ratio of FDI to GDP |
| Fiscal dependence | 0.081 | 0.045 | Ratio of fiscal revenue to GDP |
| Urbanization | 0.352 | 0.190 | Ratio of non-agricultural population in total population |
| ln (VC) | 7.353 | 0.294 | Average annual air flow coefficient |
| SO2 | 0.031 | 0.120 | Industrial sulfur dioxide emissions per unit of GDP (t (×104 yuan)-1) |
| ln (patent) | 5.821 | 1.838 | Number of invention patents authorized (pieces) |
| ln (investment) | 6.279 | 1.723 | Investment completed in the treatment of waste gas |
| Accidents | 37.960 | 65.562 | Number of environmental pollution accidents |
Table 3 The effect of the environmental supervision system on PM2.5 |
| Variables | Model 1 | Model 2 | Model 3 |
|---|---|---|---|
| ESS | –1.629*** (0.266) | –1.024*** (0.317) | -1.192*** (0.317) |
| ln (population) | 3.825 (1.981) | ||
| Industry structure | 0.117*** (0.024) | ||
| ln (PGDP) | -4.383*** (0.792) | ||
| Fiscal dependence | -19.412*** (4.762) | ||
| Urbanization | 4.929** (2.091) | ||
| FDI | 42.851 (29.486) | ||
| City fixed effects | NO | YES | YES |
| Year fixed effects | NO | YES | YES |
| Observations | 4793 | 4793 | 4793 |
| R2 | 0.934 | 0.950 | 0.951 |
Note: ** and *** indicate the statistical significance levels of 5% and 1%, respectively. The numbers in brackets are the city-level cluster standard errors. “YES” and “NO” indicate controlling or not controlling city fixed effects and year fixed effects, respectively. Control variables include ln (population), Industry structure, ln (PGDP), Fiscal dependence, Urbanization and FDI. |
Fig. 4 Dynamic impact of the environmental supervision system on air pollution |
Table 4 The results excluding other policy influences (Model 1 and 2) and PSM-DID estimates (Model 3 and 4). |
| Variables | Model 1 | Model 2 | Model 3 | Model 4 |
|---|---|---|---|---|
| ESS | -1.719*** (0.342) | -2.171*** (0.350) | -1.596*** (0.273) | -1.769*** (0.273) |
| Control variables | NO | YES | NO | YES |
| City fixed effects | NO | YES | NO | YES |
| Year fixed effects | NO | YES | NO | YES |
| Observations | 2952 | 2952 | 4392 | 4392 |
| R2 | 0.920 | 0.922 | 0.931 | 0.932 |
Note: *** indicates the statistical significance level of 1%. The numbers in brackets are the city-level cluster standard errors. “YES” and “NO” indicate controlling or not controlling city fixed effects, year fixed effects and control variables, respectively. Control variables are the same as in Table 3. |
Table 5 Instrumental variable estimations |
| Variables | First step regression | Second step regression |
|---|---|---|
| ESS | PM2.5 | |
| ln (VC)×post | 0.135*** (0.000) | |
| ESS | -1.748*** (0.265) | |
| Control variables | YES | YES |
| City fixed effects | YES | YES |
| Year fixed effects | YES | YES |
| Observations | 4793 | 4793 |
| R2 | 0.964 | 0.546 |
| F value | 33.12 |
Note: *** indicates the statistical significance level of 1%. The numbers in brackets are the city-level cluster standard errors. Post is a time processing variable. “YES” indicates controlling city fixed effects, year fixed effects and control variables, respectively. Control variables are the same as in Table 3. |
Table 6 Analysis of potential mechanisms |
| Variables | ln (patent) | SO2 | Industry structure | Accidents | ln (investment) |
|---|---|---|---|---|---|
| ESS | 1.125*** (0.037) | ‒0.005*** (0.001) | ‒0.596* (0.322) | ‒17.557*** (0.021) | 0.052** (0.021) |
| Control variables | YES | YES | YES | YES | YES |
| City fixed effects | YES | YES | YES | YES | YES |
| Year fixed effects | YES | YES | YES | YES | YES |
| Observations | 4793 | 4793 | 4793 | 4793 | 4793 |
| R2 | 0.252 | 0.721 | 0.868 | 0.012 | 0.912 |
Note: *, **, and *** indicate the statistical significance levels of 10%, 5%, and 1%, respectively. The numbers in brackets are the city-level cluster standard errors. “YES” indicates controlling city fixed effects, year fixed effects and control variables. The control variables in the regression analysis of industry structure include ln (population), ln (PGDP), Fiscal dependence, Urbanization and FDI, and the other analysis of potential mechanisms includes the same control variables as in Table 3. |
Table 7 Heterogeneity analysis |
| Variables | Station city | Non-station city |
|---|---|---|
| ESS | ‒1.593*** (0.489) | ‒1.349*** (0.318) |
| Control variables | YES | YES |
| City fixed effects | YES | YES |
| Year fixed effects | YES | YES |
| Observations | 1308 | 3485 |
| R2 | 0.898 | 0.944 |
Note: *** indicates the statistical significance level of 1%. The numbers in brackets are the city-level cluster standard errors. “YES” indicates controlling city fixed effects, year fixed effects and control variables, respectively. Control variables are the same as in Table 3. “Station city” indicates the cities in the province where the environmental supervision center is located, and “Non-station city” indicates the cities in the province where the environmental supervision center is not located. |
| [1] |
|
| [2] |
|
| [3] |
|
| [4] |
|
| [5] |
|
| [6] |
|
| [7] |
|
| [8] |
|
| [9] |
|
| [10] |
|
| [11] |
|
| [12] |
|
| [13] |
|
| [14] |
|
| [15] |
|
| [16] |
|
| [17] |
|
| [18] |
|
| [19] |
|
| [20] |
|
| [21] |
|
| [22] |
|
| [23] |
|
| [24] |
|
| [25] |
|
| [26] |
|
| [27] |
|
| [28] |
|
| [29] |
|
| [30] |
|
| [31] |
|
| [32] |
WHO(World Health Organization). 2020. Health risks. https://www.who.int/initiatives/urban-health-initiative/health-impacts/other-health-risks 2020-07-13].
|
| [33] |
|
| [34] |
|
| [35] |
|
| [36] |
|
| [37] |
|
| [38] |
|
| [39] |
|
| [40] |
|
/
| 〈 |
|
〉 |