
Journal of Resources and Ecology >
Ecological Benefit Evaluation of Agricultural Heritage System Conservation—A Case Study of the Qingtian Rice-Fish Culture System
|
WANG Bin, E-mail: ylwangbin@sina.com |
Received date: 2021-01-22
Accepted date: 2021-04-22
Online published: 2021-09-30
Supported by
The Research Institute of Subtropical Forestry of Chinese Academy of Forestry(RISFZ-2016-15)
The National Natural Science Foundation of China(41801204)
In order to better understand the developmental conditions and trends of the biodiversity at agricultural heritage sites, the structure and function of the ecosystem and ecological environment in Qingtian Rice-Fish Culture System is examined in the decade since the implementation of the GIAHS project. Through the collection of historical data and sample-plot survey, this study collates the data from 2005 to 2013 related to the heritage site to evaluate the ecological benefit of the Agricultural Heritage System conservation. The results show that: (1) Since the implementation of heritage conservation, the variety of traditional rice grown at the heritage sites basically remains stable, the varieties of other crops basically remain unchanged and the varieties of fruit trees and medicinal plants have developed at faster rates. As the ecological environment at the heritage sites gradually improved, the species and richness of the biodiversity in the ecosystem have increased, especially the increasing growth of egrets and boars. (2) From 2005 to 2013 in the Fangshan Town of Qingtian County, the ecosystem areas identified as river, forest, urban and bare land have increased. The increased area of the urban ecosystem is the largest one of them, which is up to 20.30 ha; while the area of the forest ecosystem has increased to 7.29 ha. The areas of wetland, reservoir, farmland and grassland have been reduced, and the area of grassland ecosystem has been reduced the most with a reduction of 28.87 ha. From the changes in the values of the ecosystem services of different ecosystem types, the values of forest ecosystem services have achieved the most growth, reaching up to 92000 yuan yr-1 and the growth of the river and bare land ecosystem service values are not obvious. (3) Over nearly a decade, the soil nutrients and the water quality of rice fields at the heritage site have not obviously changed and the plant diseases and insect pests in the rice fields have not been aggravated. The monitoring indexes are far better than the standard values. With the great support of the local government, the production and living conditions and the living environments of farmers in the villages of the heritage sites have been greatly improved through road reconstruction, water improvement, toilet enhancements and the greening, brightness and beautification of the villages.
WANG Bin , SUN Yehong , JIAO Wenjun . Ecological Benefit Evaluation of Agricultural Heritage System Conservation—A Case Study of the Qingtian Rice-Fish Culture System[J]. Journal of Resources and Ecology, 2021 , 12(4) : 489 -497 . DOI: 10.5814/j.issn.1674-764x.2021.04.007
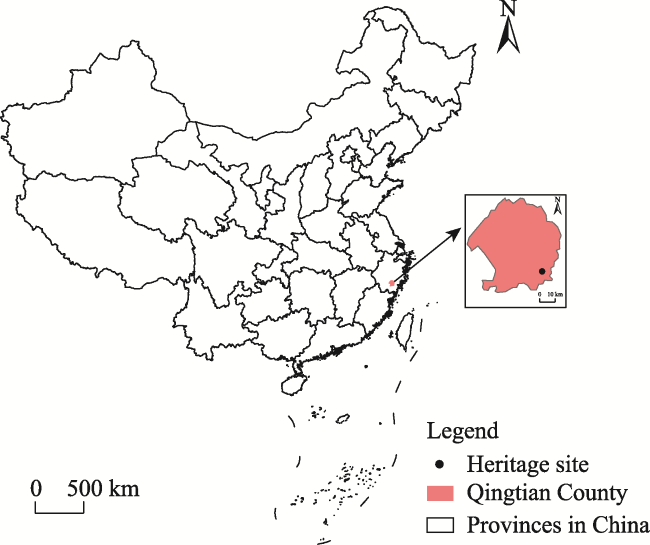
Fig. 1 Location of the Qingtian Rice-Fish Culture System |
Table 1 The ecological benefit evaluation indicator system |
| Level 1 | Level 2 |
|---|---|
| Agricultural biodiversity | Rice varieties |
| Fish varieties | |
| Other crop varieties | |
| Livestock and poultry varieties | |
| Economic fruits | |
| Medicinal plants | |
| Relevant biodiversity | Biological varieties in paddy fields |
| Biological varieties in residential areas | |
| Biological varieties in forest lands | |
| Other wild animals | |
| Ecosystem structure and function | Ecosystem types |
| Ecosystem structure | |
| Ecosystem services | |
| Ecological environment quality of paddy fields | Soil nutrients |
| Water quality | |
| Diseases and insect pests | |
| Ecological environment quality of the rural area | Rural landscape |
| Farmland landscape | |
| Water environment |
Table 2 Unit area ecosystem service values of different ecosystems (Unit: yuan ha-1 yr-1) |
| Level 1 | Level 2 | Grassland | River | Farmland | Forest | Reservoir | Wetland | Desert |
|---|---|---|---|---|---|---|---|---|
| Provisioning services | Food production | 193.11 | 238.02 | 449.10 | 148.20 | 238.02 | 161.68 | 8.98 |
| Material production | 161.68 | 157.19 | 175.15 | 1338.32 | 157.19 | 107.78 | 17.96 | |
| Regulating services | Gas regulation | 673.65 | 229.04 | 323.35 | 1940.11 | 229.04 | 1082.33 | 26.95 |
| Climate regulation | 700.60 | 925.15 | 435.63 | 1827.84 | 925.15 | 6085.31 | 58.38 | |
| Water temperature regulation | 682.63 | 8429.61 | 345.81 | 1836.82 | 8429.61 | 6035.90 | 31.44 | |
| Waste disposal | 592.81 | 6669.14 | 624.25 | 772.45 | 6669.14 | 6467.04 | 116.77 | |
| Supporting services | Soil conservation | 1005.98 | 184.13 | 660.18 | 1805.38 | 184.13 | 893.71 | 76.35 |
| Maintain biodiversity | 839.82 | 1540.41 | 458.08 | 2025.44 | 1540.41 | 1657.18 | 179.64 | |
| Landscape | 390.72 | 1994.00 | 76.35 | 934.13 | 1994.00 | 2106.28 | 107.78 |
Table 3 The areas of different ecosystems in Fangshan town and Longxian village (Unit: ha) |
| Ecosystem types | Fangshan Town | Longxian Village | ||||
|---|---|---|---|---|---|---|
| 2005 | 2013 | Change | 2005 | 2013 | Change | |
| Farmland | 863.79 | 860.78 | -3.01 | 78.13 | 78.74 | 0.61 |
| Forest | 2755.75 | 2763.03 | 7.28 | 371.26 | 372.15 | 0.89 |
| Wetland | 2.51 | 2.47 | -0.04 | 0 | 0 | 0 |
| River | 25.32 | 25.50 | 0.18 | 1.19 | 1.19 | 0 |
| Reservoir | 9.56 | 9.53 | -0.03 | 0 | 0 | 0 |
| Grassland | 317.02 | 288.15 | -28.87 | 4.56 | 0.35 | -4.21 |
| Bare land | 11.30 | 15.49 | 4.19 | 0 | 0 | 0 |
| Urban | 116.47 | 136.76 | 20.29 | 9.14 | 11.85 | 2.71 |
| Total | 4101.71 | 4101.71 | 0 | 464.28 | 464.28 | 0 |
Table 4 The ecosystem service values of different ecosystems in Fangshan Town and Longxian Village (Unit: 104yuan yr-1) |
| Ecosystem types | Fangshan Town | Longxian Village | ||||
|---|---|---|---|---|---|---|
| 2005 | 2013 | Change | 2005 | 2013 | Change | |
| Farmland | 306.46 | 305.39 | -1.07 | 27.72 | 27.93 | 0.21 |
| Forest | 3480.20 | 3489.35 | 9.15 | 468.90 | 469.97 | 1.07 |
| Wetland | 6.18 | 6.08 | -0.10 | 0 | 0 | 0 |
| River | 51.58 | 51.94 | 0.36 | 2.43 | 2.43 | 0 |
| Reservoir | 19.47 | 19.40 | -0.07 | 0 | 0 | 0 |
| Grassland | 166.15 | 151.02 | -15.13 | 2.39 | 0.18 | -2.21 |
| Bare land* | 0.71 | 0.97 | 0.26 | 0 | 0 | 0 |
| Total | 4030.70 | 4024.15 | -6.55 | 501.40 | 500.51 | -0.89 |
Note:*The unit area ecosystem service value of the bare land in this research is equal to the desert in Table 2. |
Table 5 The test report of soil quality in paddy fields in Longxian Village |
| Items | Limit value | Result | Decision |
|---|---|---|---|
| pH | - | 5.92 | - |
| TP (%) | - | 0.026 | - |
| Available P (mg L-1) | - | 12.5 | - |
| Available K (mg L-1) | - | 92.5 | - |
| TN (%) | - | 0.133 | - |
| SOM (%) | - | 3.41 | - |
| DDT (mg kg-1) | ≤0.50 | 6.67×10⁻³ | Up to standard |
| HCH (mg kg-1) | ≤0.50 | <1.0×10⁻⁵ | Up to standard |
| Pb (mg kg-1) | ≤250 | 32 | Up to standard |
| As (mg kg-1) | ≤30 | 4.04 | Up to standard |
| Hg (mg kg-1) | ≤0.30 | 0.08 | Up to standard |
| Cr (mg kg-1) | ≤250 | <30 | Up to standard |
| Cd (mg kg-1) | ≤0.30 | <0.2 | Up to standard |
| Cu (mg kg-1) | ≤50 | 19 | Up to standard |
Note: The data in Table 5 came from “Environmental monitoring report of Longxian Village, Fangshan Township, Qingtian County in 2013”. |
Table 6 The test report of water quality of the paddy fields |
| Items | Limit value | Result | Decision |
|---|---|---|---|
| Anionic surface active agent (mg L-1) | ≤5 | Not detected (<0.05) | Up to standard |
| pH | 5.5-8.5 | 8.17 | Up to standard |
| Total salt content (mg L-1) | ≤1000 (Non-saline land area) | 21 | Up to standard |
| ≤2000 (Saline land area) | Up to standard | ||
| Chloride (mg L-1) | ≤350 | 2.7 | Up to standard |
| Sulfide (mg L-1) | ≤1 | Not detected (<0.005) | Up to standard |
| Total Hg (mg L-1) | ≤0.001 | Not detected (<0.0001) | Up to standard |
| Cr (mg L-1) | ≤0.01 | Not detected (<0.0001) | Up to standard |
| Total arsenic (mg L-1) | ≤0.05 | Not detected (<0.007) | Up to standard |
| Chromium (hexavalent) (mg L-1) | ≤0.1 | Not detected (<0.004) | Up to standard |
| Cu (mg L-1) | ≤0.5 | Not detected (<0.01) | Up to standard |
| Zn (mg L-1) | ≤2 | Not detected (<0.006) | Up to standard |
| Se (mg L-1) | ≤0.02 | Not detected (<0.00025) | Up to standard |
| Fluoride (mg L-1) | ≤2 (General area) | Not detected (<0.05) | Up to standard |
| ≤3 (High fluorine area) | |||
| Cyanide (mg L-1) | ≤0.5 | Not detected (<0.25) | Up to standard |
| Total phosphorus (mg L-1) | - | Not detected (<0.01) | Up to standard |
Note: The data in Table 6 came from “Test report of farmland irrigation water sample submitted by the Tianyu Professional Cooperative of Xiaozhoushan in Qingtian County in 2013”. |
| [1] |
|
| [2] |
|
| [3] |
|
| [4] |
|
| [5] |
|
| [6] |
|
| [7] |
|
| [8] |
|
| [9] |
|
| [10] |
|
| [11] |
|
| [12] |
|
| [13] |
|
| [14] |
|
| [15] |
|
| [16] |
|
| [17] |
|
| [18] |
|
| [19] |
|
| [20] |
|
/
| 〈 |
|
〉 |