Resource and Ecology

Perceptions of Local People toward Wild Edible Plant Gathering and Consumption: Insights from the Q-method in Hani Terraces

  • DING Lubin , 1, 2 ,
  • HE Siyuan 1 ,
  • MIN Qingwen 1 ,
  • LI Heyao 1, 2 ,
  • MA Nan 1, 2 ,
  • LI Wenhua , 1, 2, *
Expand
  • 1. Institute of Geographic Sciences and Natural Resources Research, Chinese Academy of Sciences, Beijing 100101, China
  • 2. University of Chinese Academy of Sciences, Beijing 100049, China
*LI Wenhua, E-mail:

DING Lubin, E-mail:

Received date: 2021-01-15

  Accepted date: 2021-03-30

  Online published: 2021-09-30

Supported by

The National Natural Science Foundation of China(42001194)

Abstract

Wild edible plants (WEPs) can provide a variety of provisioning services and cultural services but they are currently under-utilized. Understanding farmers’ perceptions of the collection and consumption of wild edible plant resources is essential for promoting local socio-ecological system resilience and local wild plant resource use. This paper uses the Q-method to investigate the main perspectives of farmers toward collecting and consuming wild edible plants in the Honghe Hani Terraces region of Yunnan Province. This analysis identified four main perspective types among the farmers, including market-driven, household user-driven, cultural service seekers, and tradition followers. It revealed the main factors that limit and facilitate farmers’ WEP collection and consumption, including limitations due to loss of traditional knowledge, and changes in socioeconomic conditions that negatively affect WEP collection and consumption; while, on the other hand, the demand for WEP-related cultural services and the presence of a strong culture slowed down changes in dietary structure, which in turn have maintained WEP collection and consumption. The Q-method can help in identifying the relationship between community residents and local wild plant resource use in rapidly transitioning areas and in identifying the barriers that affect the resilience of local socio-ecological systems.

Cite this article

DING Lubin , HE Siyuan , MIN Qingwen , LI Heyao , MA Nan , LI Wenhua . Perceptions of Local People toward Wild Edible Plant Gathering and Consumption: Insights from the Q-method in Hani Terraces[J]. Journal of Resources and Ecology, 2021 , 12(4) : 462 -470 . DOI: 10.5814/j.issn.1674-764x.2021.04.004

1 Introduction

Agricultural heritage sites are often rich in biodiversity, including the variety of biological resources utilized by local people in their daily life, rituals, and festivals. The conservation of the biodiversity which exists in local socio-ecological systems was one of the original purposes for the establishment of Globally Important Agricultural Heritage Systems (GIAHS). However, this biodiversity, which is so relevant to local people in heritage sites, faces multiple pressures, including changes in the market and economic conditions, land-use changes (e.g., conversion of native forests to secondary forests, which affects the growth of wild fruits), and the loss of traditional practices. These pressures are quietly influencing the behavior of local people with respect to collecting and consuming local edible plant resources. For example, developed agricultural markets have increased the behavior of some people in collecting and selling wild plants, while possibly decreasing the behavior of some people in consuming wild plants. For the inhabitants of heritage sites, edible wild plant resources have the potential to ensure food security (Nolan and Pieroni, 2014), provide rich nutrition (Mavengahama et al., 2013), and help the local people avoid some market risks and increase their income (Abbet et al., 2014). The collection and consumption of Wild Edible Plants (WEPs) is an important aspect of local people’s traditions and livelihoods, and plays an important role in the resilience of local agricultural culture, cultural landscape and socio-ecological systems (Luo et al.,2019; Abdul et al., 2020). However, knowledge related to wild edible plant resources is under threat in many regions globally, and the collection and consumption of WEPs are generally declining (Millennium Ecosystem Assessment, 2003), a phenomenon that is receiving increasing attention.
The Hani Terraces region in Yunnan Province, China, is a global biodiversity hotspot and a relatively well-preserved area for traditional culture. It was selected by the Food and Agriculture Organization of the UN as a GIAHS site in 2010 because of its rich biodiversity and breathtaking cultural landscape (Zhang et al., 2019). In the Hani Terraces, more than 200 species of WEPs, including native and exotic species, are utilized by the local people (Luo et al., 2019), and farmers there consume wild plant resources almost every day. Since WEPs have not been domesticated and cultivated on a large scale, they must be sourced from their natural environment. In the Hani Terraces, the conversion of paddy fields to drylands and the rapid replacement of complex agroecosystems by monocultures, often accompanied by herbicide and pesticide use, have affected WEP biodiversity to some extent and have had a significant impact on the collection and consumption of WEPs by the local people (Luo et al., 2019).
In the Hani Terraces, in addition to the locals’ consumption, there is an annual demand for local WEPs from more than 4 million tourists, and local restaurants offer many dishes made from WEPs, which has had a significant impact on the gathering of wild edible plants by the local people (Luo et al.,2019). Growing awareness and concern about the potential human health impacts of pesticides and herbicides has led to a dramatic increase in interest in organic food in China. This interest extends to wild-harvested WEP species, because they are considered to have the advantages of being pesticide-free, naturally grown, high in nutrients, and fresh in flavor. Some WEP species have great market potential in the context of local tourism development, and WEPs can be a carrier for promoting local food culture, which is also important for local tourism development. In agricultural heritage sites where the use of WEPs is an integral part of local farmers' livelihood and culture, understanding the factors, motivations, and attitudes that influence farmers' collection and consumption of WEPs is critical for maintaining the stability of the social-ecological systems.
The diversity of knowledge and use associated with WEP resources is a key area of ethnoecological research (Geng et al., 2015). A few studies related to biological resource use in the Hani Terraces of Honghe, Yunnan Province, have focused on ethnobotanical studies on the biodiversity and plant uses of local traditional rice species (e.g., Wang et al., 2019), while some studies have also focused on the role of wild plant resources and the culture associated with them in sustaining the local social and cultural systems (Yuan et al., 2013). However, fewer studies have been conducted on the current status, motivations, barriers, and drivers of WEP collection and consumption in the Hani Terraces, resulting in a lack of relevant conservation actions based on sound scientific research. Many factors influence WEP collection and consumption, such as socio-economic changes and non- material benefits (e.g., ability and experience) (Reyes-García et al., 2015). This paper analyses and discusses the factors that may affect WEP collection and consumption and the drivers of these changes from a farmer’s perception perspective, and it then proposes feasible conservation recommendations. The research objectives of this study are therefore to: 1) Collect data on the local perceptions and attitudes toward WEP collection and consumption behavior; 2) Explain the causes and possible drivers of the changes affecting (or potentially affecting) WEP collection and consumption.

2 Methodology, data collection and analysis

2.1 Q-method

Q-method is a pile-sorting method that systematically explores and analyses different perspectives on a particular topic based on the degree of agreement and disagreement among respondents across the same set of statements about that topic (Brown, 1980; Watts and Stenner, 2012). The Q-method combines quantitative analysis and qualitative analysis (ethnographic inquiry), which is based on factor analysis to find explanatory models, and qualitatively interprets these models based on the participants’ arrangement of relationships between statements to uncover any common patterns of engagement, orientation, or forms of understanding (Zabala and Pascual,2016). The advantage of the Q-method over other traditional survey-based methods is that it provides a systematic means of identifying and exploring the different perspectives on a topic represented in a selected group of participants, while avoiding the researcher’s bias against clustering participants (Brown,1996). Thus, the Q-method is particularly suitable for studying highly controversial phenomena and as a powerful method for examining subjectivity or perceptions about a particular topic (Cross, 2005). Q-method has been used for various research topics related to natural resource management, such as farmers’ motivations for crop diversification choices (Nordhagen et al.,2017; Buckwell et al., 2020), Indonesian perceptions of pulpwood plantations (Pirard et al., 2016), blueberry growers’ attitudes towards deforestation in Georgia, USA (Upadhaya and Dwivedi, 2019), heterogeneity in the motivations for adopting silvopastures (Zabala et al.,2017), etc. However, it has not been applied to issues related to WEP collection and consumption. For this study, the use of the Q-method was valuable because it helped the researchers to identify the diversity of potential perspectives on WEP collection and consumption and the groups that share similar patterns of thinking about behavioral explanations.

2.2 Study site

The study area is located in the Samaba Terraces in Honghe County, one of the ten areas of the “Honghe Hani Rice Terraces System”, and the study villages include Gata Village, Chaoyang Village, and Baohua Village. Honghe County is a national key county for poverty alleviation and development, which is located in the Ailao Mountain and on the south bank of the Red River, with 97% mountainous terrain of three types: low mountain valley area, semi-mountainous area, and mountainous area. It has a subtropical monsoon climate with abundant sunshine, an average annual temperature of 20 ℃, and average annual precipitation of 1340 mm (Liu et al., 2014; Zhang et al., 2017). The economy is mainly based on agriculture. Gata Village is 7 km from the government of Baohua town and 40 km from Honghe County, with a total land area of 11.8 km2, an altitude of 1700-1800 m, an average annual temperature of 16 ℃, and average annual precipitation of 3200 mm. Crops grown in the village include rice, corn, and wheat. There are 2 km2 of arable land and more than 6.5 km2 of forest land, with agricultural income accounting for more than 95% of the total. Chaoyang Village is 3.70 km from the town, with an altitude of 1720 m. The annual average temperature is 14.3 ℃ and the annual precipitation is 1485 mm. Baohua Village is the seat of the township government, with an average altitude of 1830 m, an average annual temperature of 13.7 ℃ and an annual rainfall of 1470 mm, and there is a farmer product market in the village.

2.3 Data collection methods

Conducting research using Q-method involves a series of steps. The first step is to create a Q sample, i.e., to develop a list of statements that includes as many ideas as possible about the research topic. The main challenge in developing the Q sample was to make them short and easily be understood by the participants. The statements in the Q sample was not facts, but rather views and opinions in a broad sense. Most of the statements in our study were obtained through focus group discussions with local farmers and statements by researchers, while a few statements were obtained by collating the text of declarations submitted to the FAO and scientific literature published in academic journals. Initially, we selected 30 statements, and this list was refined by considering that the size of the Q sample should be manageable, a long Q sample requires more time for analysis, and the same topic can be discussed from different perspectives in several statements if it is considered important. Therefore, by removing overly similar statements and piloting them in the field, 23 key statements were finally identified, covering five themes (Table 1). Based on the literature and previous field surveys, these themes were deemed the most relevant for explaining farmers’ perspectives on the collection and consumption of WEPs. The themes covered were (A) knowledge; (B) economics; (C) availability; (D) socioeconomic and political; and (E) cultural services.
Table 1 Factor Q-sort values of each statement and its corresponding topic
ID Statement Topic Factors
1 2 3 4
S1 WEPs are usually delicious, so I will gather them E 3 1 0 3
S2 Gathering WEPs saves time and effort and is more convenient than growing my own vegetables B -2** -1** -3** 1**
S3 WEPs are nutritious and eating them is good for my health E 2 0 0 2
S4 Gathering WEPs can increase family income B -1 0* -2 3**
S5 When I have nothing to do, I gather WEPs to pass the time E 0 0 -3** -1*
S6 Picking WEPs puts me in a good mood and makes me happier E 3** -2** 0 0
S7 Watching other people eat WEPs, I will eat them too D 1* -1 -1 -1
S8 Eating WEPs is a Hani tradition D 1 1** 3 2
S9 I have a way of cooking WEPs that will be delicious A 1 -2** 1 1
S10 The government should promote the benefits of eating WEPs and increase the purchase and price of WEPs D 1 0 -2 0
S11 WEPs can be sold or made into specialties and sold to tourists B 2 3 0 0
S12 Knowledge about gathering and cooking WEPs is important A 2 1 3* 1
S13 I think WEPs can be very helpful in dealing with food scarcity E 0 1 -1 1
S14 Nostalgia for picking WEPs as a child will influence my gathering of WEP E 0 2* 2 -1**
S15 Eating WEPs will save my family some money B 0 -1 1 -2*
S16 Talking to friends about WEPs can affect the collection of WEPs D -1 -2 1 0
S17 There are some wildcrafted vegetables that you need to learn from others to master A 0 2** 0* -1
S18 Wild vegetables are for the poor D -3* -3 -1** -3
S19 Gathering WEPs is something women (or children) do D -2 -3 -2 -3
S20 Changing habits can affect the collection of WEPs D -2 2 1 -2
S21 Fewer places to gather WEPs than before C -1** 3 2 2
S22 It’s easier to buy groceries, which affects my picking of WEPs D -1 0 -1 0
S23 For me, gathering WEPs is not cost effective B -3** -1 2** -2

Note: In this table, -3 represents most disagree, and 3 represents most agree.*,** denote that the statement in question is a distinguishing statement for that group, with significance level at P<0.05,P<0.01, respectively. Factors are as the main types of perspectives. Key for topics: (A) knowledge; (B) economics; (C) availability; (D) socioeconomic and political; and (E) cultural services.

The second step is to recruit participants and form a P sample. Participants were recruited purposefully, not randomly, to capture different perspectives (Dziopa and Ahern, 2011). For this study, we selected three villages in the core area of the heritage site. Due to the lack of census information, a strict random sampling was not possible, so participants were recruited for the sessions through local leaders. Participants were randomly selected and their composition was examined to ensure roughly representative distributions of age, economic status, market, and natural exposure. We ended up recruiting 34 farmer participants, and we first explained our study to the participants and then obtained their verbal informed consent. Four farmers discontinued the survey midway through due to the long duration of the survey. Ultimately, we ended up with a P sample of 30 WEP collectors and eaters, which is an acceptable and appropriate number of respondents for a Q-method study (Watts and Stenner, 2012).
The third step was to ask participants to sort Q statements using their subjectivity. In our study, the low literacy level and language barrier of local villagers were challenges. Since interviewing only literate people may bias the results, all of our work was conducted verbally even though some villagers were able to read and understand the written content. Three university students who were fluent in the local language were recruited for the study, and each of the three students was trained to interact one-on-one with the interviewees. The trained local university students instructed the participants to read the statements one by one and to classify the statements into two categories: agree and disagree. Each statement was then ranked in three groups (agree, disagree, and neutral), placed in a quasi-normal distribution grid, with the most agreeable and least agreeable statements at each end of the grid, and then the other statements were ranked and placed in the grid (Fig. 1). The person in charge of the study was on-site and always available to clarify questions. Throughout the Q-sorts process, participants could move statements between columns and re-sort them within columns. As statements were sorted, we asked participants to justify some choices to ensure that they fully understood the rules and made choices that reflected their true thoughts. Each interview lasted between 40 minutes and 1 hour. Finally, we administered a short survey to participants to collect basic demographic information, frequency of using wild plants, and other relevant information.

2.4 Analysis

We used PQMethod software (available at http://schmolck.org/qmethod/downpqmac.htm) to analyze the collected data. We conducted the Principal Component Analysis (PCA) to extract the factors, and eight of the 23 components had eigenvalues greater than 1, with a maximum eigenvalue of 10.42. Since factors with eigenvalues less than one did not capture enough variation to explain even the views of individual participants, following Watts and Stenner (2012), we excluded factors with eigenvalues below 1.00. We selected four top factors for the explanation, and these four factors explained 61% of the variability among respondents, a percentage consistent with other Q studies (Watts and Stenner, 2012; Lynch et al.,2014). Seven respondents were not labeled because they had relatively high loadings on two or three factors, meaning that they were characterized by more than one viewpoint at the same time. Next, factor loadings, i.e., correlation coefficients between the factors and Q-sort, were calculated to show how much each Q-sort loaded on a particular factor: i.e., how much does that individual agree with this viewpoint? (Sandbrook et al., 2011). For clarity, we rotated the remaining factors using the Varimax module (QVARIMAX) to maximize the differences between the factors and make them as distinct as possible (Watts and Stenner, 2012). The rotated factors were re-expressed by ranking the factor z scores as statement scores (i.e., from -3 to 3). Thus, each group is represented by an “ideal” Q-sort, which shows how a hypothetical respondent with 100% loading on that factor would sort the statements (Watts and Stenner, 2012).
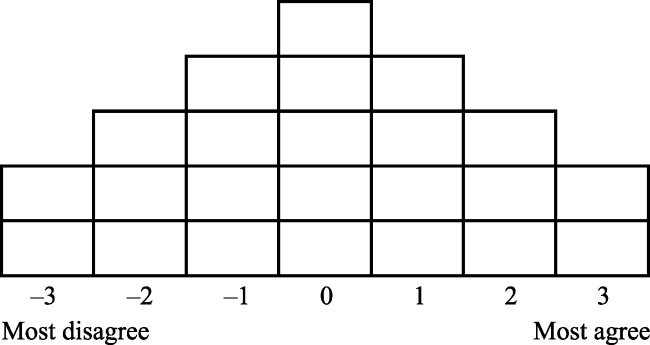
Fig. 1 Q-sorts ranking grid Note: Each cell represents one statement, where -3 represents most disagree, and 3 represents most agree.
The Q-method analysis yields three main results: overall factor characteristics, factor loadings of respondents, and stated factor and z scores. The z scores are “the weighted average of the respondents most closely related to the factor for a given statement” ( Zabal and Pascual, 2016) and are used for the main results of the interpretation. The z-scores of the statements indicate how the prototypical respondents for each factor would rank the statements. The interpretation of the factors is based on the stated results, i.e., their salience in each factor and their unique position compared to other factors. Statements with significant differences in scores among the factors are differentiating statements, and they represent statements where there is significant disagreement among the factors. Statements with the smallest differences in scores between factors are consensus statements, and they indicate a common view and shared understanding of the issue.

3 Results

The overall characteristics (variability explained and number of defined Q-classifications) indicated that the first factor was highly representative of more than one-fourth of the sample and explained about one-fifth of the total variability (21% of the total variability explained and six defined Q-classifications). The other three factors also explained a considerable amount of variability (factor 2, 15%; factor 3, 10%; and factor 4, 15%), and each of these factors was represented by a considerable number of defined Q-scores (factor 2, 6; factor 3, 5; and factor 4, 6).
Table 2 shows the results for the groupings and statement scores. These subgroups and associated statement scores are the results from the factor analysis. Each column represents a farmer type, the number represents the ideal ranking of that farmer type for each statement that was made, and the asterisks indicate those statements that were rated as significantly different by a particular group. Note that some statements had significant loading on multiple factors (e.g., S6).
Table 2 Factor loadings and flagged Q-sorts
Respondent Factor 1 Factor 2 Factor 3 Factor 4
1 0.4057 0.6336* 0.0849 0.1884
2 -0.1317 0.8078* 0.0733 0.0526
3 -0.0864 -0.1478 0.4273 0.5793*
4 -0.1360 0.2197 -0.5378* -0.0011
5 0.2289 0.0087 -0.2639 0.7453*
6 0.7694* -0.0050 0.2337 -0.0723
7 0.7732* 0.1064 0.3123 0.1966
8 0.3243 -0.0130 0.5943* 0.3496
9 -0.0371 0.4983 0.7675* 0.0430
10 0.7308* 0.1296 0.0353 0.2960
11 0.4868 0.4153 0.1496 0.2135
12 0.3294 0.1486 0.0745 0.8165*
13 0.0004 0.2083 0.7218* -0.1399
14 0.2813 0.4105 0.1552 0.4773
15 -0.0656 0.3367 -0.1335 0.5243*
16 0.3443 0.3521 0.0622 -0.1041
17 0.6488* -0.0022 -0.2491 0.5375
18 0.1693 -0.0667 0.2656 0.5483*
19 0.3838 0.6356* 0.3008 0.3777
20 0.3936 0.4355 0.1382 0.5075
21 0.3972 0.2953 0.4229 0.2868
22 0.8119* 0.0603 -0.0596 0.2909
23 0.5862* 0.2706 0.0928 0.4858
24 0.5272* 0.0678 0.4118 0.1339
25 0.2158 0.2536 0.0679 0.7189*
26 0.3904 0.6137* 0.2413 0.2542
27 0.5788 0.5724 -0.0070 0.2558
28 0.8752* 0.0547 -0.0128 0.2208
29 -0.0765 -0.6637* 0.3834 0.0246
30 0.5128 -0.6134* -0.0168 -0.0584
Explained variance in % 21 15 10 15
Number of defining
variable
8 6 4 6
Correlations between factor scores
Factor 1 0.2540 0.2172 0.5261
Factor 2 0.3530 0.3301
Factor 3 0.1735

Note:* denote that flagged Q-sorts are used to create factor arrays.

These groupings were given meaning through interpretation, which is the more subjective phase of the Q-method approach. According to Q-method standard criteria, the naming of these factors is based on their qualitative interpretation. Referring to other norms in the published literature (Robbins, 2000; Dziopa and Ahern, 2011; Nordhagen et al., 2017), the interpretation of the groupings is mainly based on the ideal type of each group and the defined individuals (those who load the strongest on each factor). We mainly considered: 1) The statements which the group scored significantly different from other groups; 2) The extreme statements (2, 3, - 2, or - 3). To aid the discussion, we assigned descriptive names to the groups, which were determined by considering the local context and the broader literature. Thus, the four groups were named as: 1) Cultural service demanders; 2) Market preferences; 3) Tradition followers; 4) Home use preferences.
Group 1: Cultural service demanders. This group consisted of eight significant loaders who strongly believed that WEPs were often very tasty (S2) and enjoyed gathering them (S6), and they also agreed that WEPs were nutritious (S3) and could be made into specialty foods for sale to tourists (S11). This group’s view of WEPs as nutritious and good for health was consistent with the views of the other groups. They strongly disagreed with the notion that gathering wild greens is costlier than it is worth (S23) and also disagreed with the notion that wild greens are for the poor (S18), and they did not believe that changes in lifestyle habits would affect their consumption of WEPs (S20). This group did not believe that WEP collection activities were more time and labor efficient compared to home gardening of vegetables (S2).
Group 2: Market preferences. This group of six significant individuals strongly believed that there were fewer places to collect WEPs than before (S21), and agreed that WEPs had a high market value and could be sold to tourists as a specialty (S11), that they missed the time when they collected WEPs as children (S14), and that the frequency of collecting WEPs had changed as their habits had changed (S20). In contrast to the first group, this group opposed the ideas that WEPs are for the poor and that gathering WEPs is something that children or women do (S19) and did not consider themselves to have unique skills in cooking WEPs (S9). Compared to the first group, the second group differed more on statements S6, S20, and S21, emphasizing the market value of WEPs and not considering the collection of WEPs as a pleasurable activity.
Group 3: Followers of tradition. This group believed that skills required for gathering and cooking WEPs were important (S12) and that eating WEPs was a tradition among the Hani people (S8), and they also agreed that the number of places to gather WEPs had declined (S21). All groups expressed agreement with the view that eating WEPs is a Hani tradition and that traditional knowledge related to WEPs is very important, but the third group in particular agreed more strongly. However, they did not think that gathering WEPs was for pleasure (S5), they strongly believed that growing vegetables in the garden was less work and less effort than gathering WEPs (S2), and they did not think that gathering WEPs would increase household income (S4). Group 3 differed more on statements S5, S21, and S23 compared to Group 1, and more on statements S5, S2, and S9 compared to Group 2.
Group 4: Home use preferences. This group believed that collecting WEPs increases household income (S4), agreed that WEPs are a very tasty food (S1), believed that eating WEPs is a Hani tradition (S8) and that eating WEPs is good for health (S3), and also agreed that the number of places to collect WEPs has declined (S21). However, this group did not believe that WEPs were eaten by the poor (S18), that gathering WEPs was something that children and women do (S19), and they did not believe that changes in lifestyle habits affected the gathering of WEPs (S20). The fourth group differed greatly from the first group on statement S4 and relatively more on statement S2; from the second group on statements S2, S14, and S9; and from the third group on statements S2 and S4. Also, statement S13 does not distinguish between any pair of factors.
Based on the differences in z scores, the Q-method can help to identify statements that are roughly the same across all groups, highlighting the common features among the different types. Different farmers’ perceptions of WEP collection and consumption have considerable commonalities. The correlations between the groups were mostly moderate (0.1735-0.3530), except for factors 1 and 4 (0.5261) (Table 2).
The main areas of disagreement between the groups were the impact of WEP collection on household income, whether WEP collection is a pastime activity, and whether changes in lifestyle habits have a significant impact on WEP collection. As noted above, a major area of consensus was the residents’ taste preference for WEPs (S1) and general confidence in the preparation of WEPs, which is important for consumption in the Hani Terraces where residents cook all their own WEPs and it was the highest rated statement. Other areas of consensus included: Eating WEPs is a Hani tradition; Traditional knowledge around WEP gathering and cooking related to WEPs was generally considered important across all groups; Most people refused to acknowledge the existence of gender differences (men are more involved than women) and the idea that WEPs are for the poor to eat; No one disagreed about the economic value of WEPs, but no one indicated strong beliefs about it. These commonalities confirm that a consensus was built among different groups of farmers about the importance of the cultural service value of WEPs.

4 Discussion

Based on the results of the local people’s perceptions of WEP collection and consumption, three main insights emerge, namely, the uncertainty of influencing factors, the importance of cultural services and market development, and reflections on the Q-method. We compared the results of the local population analysis with other similar studies, and point out implications for research and conservation efforts.

4.1 Constraining and enabling factors for WEP gathering and consumption

The availability of WEPs is influenced by a number of factors. Our respondents generally believed that fewer species could be collected for WEPs, suggesting that WEP-related biodiversity is declining, which affects WEP availability. Changes in availability are the most common explanation affecting WEP use (Sõukand, 2016; Wijaya,2019). In our case sites, the availability of some commonly used plants did not decrease (e.g., fiddlehead, dulcamara, and herba houttuyniae are very commonly used in this area), but the variation in availability varied widely among the plants. Changes in plant collection were not conclusively proven in our study; some farmers suggested that changes in forest structure, quarrying activities, etc., had reduced WEPs, but others believed that changes in market conditions had increased WEP consumption. Some villagers suggested that changes in knowledge have led to many wild plants no longer being consumed and collected. The loss of traditional knowledge (Wijaya,2019) can also affect the availability of WEPs. Regarding the collection of WEPs, some interviewees noted changes during their lifetime, such as “when I was a child, I had more knowledge about WEPs and knew a lot of WEPs, especially the elderly collected more WEPs, and then this knowledge was gradually forgotten.” The traditional knowledge of the diversity and uses of some wild plants is being lost, indirectly affecting the availability of WEPs. On the other hand, there is a lack of knowledge of how to cook these traditional foods, and there is little innovation in cooking or processing methods. Therefore, closing the knowledge gap will potentially improve farmers’ knowledge, and the collection and consumption of WEPs.
Changes in livelihoods and lifestyles can also affect WEP collection and consumption. More and more people in the local area are engaging in gardening activities, and many farmers have started vegetable gardens in front of their gardens. Many people in this study felt that there was no conflict between the consumption of WEPs and the consumption of their home-grown vegetables, but WEP collection is still an inefficient task. The decrease in people’s efforts for WEP collection partly reflects the lower economic value of WEPs and their high substitutability. Also, people’s tastes are beginning to change, especially among young people who have less contact with nature, leading to a decrease in interest in some WEPs. The increasing number of fruits and vegetables traded in the market can also affect the use of WEPs. Although WEPs are still common in local restaurants of all types, there is a lack of species richness. Therefore, future research needs to investigate the market potential and economic value of WEPs in detail.
Pawera et al. (2020) studied the barriers, motivations, and reasons for the changes in WEP consumption and concluded that the main motivation for people to consume WEPs is free and “uncontaminated” natural foods, the main drivers of change are socioeconomic factors and changes in the market, and the barriers are decreasing availability and limited knowledge of WEP nutritional value. However, none of these factors were reflected in our study. In the Pawera et al. (2020) study, local markets were considered more convenient and increasingly common for purchasing and cooking ingredients, but this was not corroborated in our study. In some studies, laboring in the fields or forests is a characteristic of masculine identity, and thus, WEP gathering activities are usually performed by men (Acosta-Naranjo et al., 2020). In our study, even though Hani men are more involved in manual labor, some women will often participate in WEP collection.
Participants generally rejected the idea that WEPs are hunger food or for the poor. This suggests that locals have moved away from reliance on WEPs as a basic food and toward higher levels of need, such as cultural needs. Leisure is not the most important reason for the Hani to collect WEPs. WEP collection is an important activity in the lives of Hani people, and some respondents believe that WEP collection and consumption can bring them pleasure, but those who collect WEPs as recreation are still in the minority. The local people’s interest in WEP collection and consumption may come from the influence of traditional food culture. WEP collection is a local tradition and has developed a strong culture, as local people still enjoy eating WEPs and often engage in collection activities in their daily lives. The persistence of this strong culture has slowed the change in dietary structure (Pawera et al.,2020), which in turn has sustained WEP collection and consumption.

4.2 Cultural services and marketability of WEPs should receive more attention

Although speculative, this study argues that a focus on local WEP-related cultural services and increased market development for WEPs would benefit WEP conservation and resource utilization. The fundamental role of WEPs is as a food that provides provisioning services. WEPs represent a traditional food that is often richer in micronutrients than cultivated crops (Hunter et al., 2019). In rural areas, WEPs offer the potential to alleviate micronutrient deficiencies in some cases. Some studies have linked the decline in wild food consumption to the perception of wild foods as food for the poor or as a reserve food in times of famine (Duguma, 2020). In the Hani Terraces, most respondents did not consider WEPs as “food only for the poor” and many denied that the use of wild plants was related to food scarcity, although in some areas WEPs were often associated with famine food (Muller and Almedom, 2008). In contrast, most respondents in this study had a positive attitude, associating WEPs with good taste, nutrition, and healthy, and some even argued that WEPs are a food eaten by the rich because they usually found in restaurants and the poor do not have the time to gather them. The health benefits provided by food are classified as cultural services in some studies (e.g., Reyes-García et al., 2015) and the same view is adopted in this paper. WEPs can provide rich cultural services (Wijaya,2019) such as entertainment (Pouta et al., 2006), health, and deliciousness. Contrary to Wijaya’s study, the idea that “limited knowledge of its nutritional and health benefits can influence WEP consumption” was not reflected in this study. Specifically, the statement “I would eat more wild foods if I knew about their nutritional and health benefits” was not supported, although there was strong agreement with the statement that “WEP consumption is beneficial to health.” The disagreement was strongest for the statement “WEPs plants are associated with lower social status.” These responses indicate that local people generally agree that WEPs are healthy and nutritious.
The use of WEPs tends to persist in indigenous communities, and in this study, the Hani people considered the consumption of WEPs to be a traditional local custom. People still enjoy and value the traditional foods of their people. Even so, the impact of cultural change on behavior toward WEPs was not assessed in this paper. WEPs are still consumed in many parts of the world, not only in subsistence-oriented economies but often in rural and even urban areas of developed countries. This is partly attributed to the supply of cultural services (Reyes-García et al., 2015), including recreation or the need for innovative foods, and the greater the cultural services of the WEP species, the greater biological benefits of the species are less necessary, and changes in demand for cultural services are thought to be the main cause of reduced WEP consumption (Reyes-García et al., 2015). In contrast to Wijaya’s (2009) study, respondents in this study perceived WEPs as usually tasty, which may be related to plant resource utilization and food culture.
In the Hani Terraces, WEPs are a part of the local people’s life, so local people do not pay much attention to the fact that WEPs are free and do not consider some plants as a source of household income, and only some of them believe that WEP consumption can save household expenses and bring indirect benefits. Many studies argue that the free availability of WEPs in nature leads to their low economic value and reduces their visibility and promotion (Ngome et al.,2017). In our study, there was a large variation in local perceptions of the economic value of WEPs. Many farmers believed that the economic value of WEPs was high and that increased marketability would increase their chances of consuming WEPs. However, even with the high economic value, most farmers would not participate in the sale of WEPs but would collect WEPs out of a desire to be self-sufficient. Therefore, farmers were neutral regarding indications that the government should promote the benefits of WEPs and increase the purchase price of WEPs. As the economy develops and more WEPs are being sold or purchased in the market, some people have acquired the knowledge of WEP domestication, and increased marketability will probably increase WEP collection and consumption.

4.3 Reflections on carrying out the Q-method in the Hani Terraces

In terms of methodology, this is the first time that the Q-method has been applied to the topic of WEP collection and consumption, especially in the context of the global trend of generally decreasing WEP consumption. This method has strengths and limitations. During the interview, participants generally reported good results. Some interviewees had difficulty prioritizing the statements, but this did not necessarily create analytical difficulties, as the Q-method aims to force participants to make trade-offs and prioritize (Nordhagen et al., 2017). Also, some new statements emerged during the study and these comments could only be analyzed as ranked interviews. While studies using the Q-method typically produce strong differences of opinion (Hiedanpää et al.,2020), the relatively broad overlapping of opinions in this study is not an uncommon phenomenon (e.g., Andrew et al., 2020). Finally, naming groups under the Q-method may give a simplistic and false impression: in fact, the factors represent not groups but a continuum along which people can expect to change, each with a different degree of association with the group (Fairweather and Klonsky,2009). In our preliminary study, specific factors influencing WEP availability were not collected and specific changes in WEP consumption were not measured in the field, and the incorporation of such factors could be enhanced in future studies. Overall, the method proved to be very useful for gaining a clearer understanding of farmers’ motivations or perceptions.

5 Concluding remarks

Farmers can be divided into different categories, such as those who demand cultural services, those who follow traditional practices, and those who have market preferences. The availability of WEPs as well as traditional culture and knowledge can influence the collection and consumption of WEPs. WEPs are an important part of the agricultural cultural heritage system and also have strong links with local tourism development and the sustainable development of communities (Zhang et al., 2018). However, the role of WEPs in traditional diets has been neglected in the practice of collaborative conservation of local cultures and species and the promotion of tourism development. Therefore, our conservation practices should pay more attention to local knowledge and practices related to WEPs so that they can continuously evolve and adapt to changes in the social-ecological system. In future conservation actions, knowledge transfer should be an important aspect of education and tourism activities to bring knowledge to the public. The government and various stakeholders can support and stimulate agrobiodiversity-related activities such as food and culture festivals, industrial integration planning, and in eco-agricultural conservation practices, as a way to increase public interest in WEPs and improve the marketability of WEPs. In addition, knowledge of the characteristics and uses of various plant species is particularly important in itself, and some species that taste better, are easier to collect or manage, have multiple uses, or have higher economic value are more likely to be used.
[1]
Abbet C, Mayor R, Roguet D, et al. 2014. Ethnobotanical survey on wild alpine food plants in Lower and Central Valais (Switzerland). Journal of Ethnopharmacology, 151(1):624-634.

DOI

[2]
Abdul A M, Abbasi A M, Ullah Z, et al. 2020. Shared but threatened: The heritage of wild food plant gathering among different linguistic and religious groups in the Ishkoman and Yasin valleys, North Pakistan. Foods, 9(5):601. DOI: 10.3390/foods9050601.

DOI

[3]
Acosta-Naranjo R, Guzmán-Troncoso A J, Gómez-Melara J. 2020. The persistence of wild edible plants in agroforestry systems: The case of wild asparagus in southern Extremadura (Spain). Agroforestry Systems, 94(6):2391-2400.

DOI

[4]
Brown S R. 1980. Political subjectivity:Applications of Q methodology in political science. New Haven, USA: Yale University Press.

[5]
Brown S R. 1996. Q methodology and qualitative research. Qualitative Health Research, 6(4):561-567.

DOI

[6]
Buckwell A, Fleming C, Muurmans M, et al. 2020. Revealing the dominant discourses of stakeholders towards natural resource management in Port Resolution, Vanuatu, using Q-method. Ecological Economics, 177:106781. DOI: 10.1016/j.ecolecon.2020.106781.

DOI

[7]
Cross R M. 2005. Exploring attitudes: The case for Q methodology. Health Education Research, 20(2):206-213.

PMID

[8]
Dziopa F, Ahern K. 2011. A systematic literature review of the applications of Q-technique and its methodology. Methodology, 7(2):39-55.

DOI

[9]
Duguma H T. 2020. Wild edible plant nutritional contribution and consumer perception in Ethiopia. International Journal of Food Science, 2020: 2958623. DOI: 10.1155/2020/2958623.

DOI

[10]
Fairweather J R, Klonsky K. 2009. Response to Vanclay et al. on farming styles: Q methodology for identifying styles and its relevance to extension. Sociologia Ruralis, 49(2):189-198.

DOI

[11]
Geng Y F, Yang Y, Zhang Y, et al. 2015. Research development of food plant ethnobotany—Bibliometric and mapping knowledge domains analysis based on Web of Science. Journal of Plant Taxonomy and Resources, 37(4):479-490.

[12]
Hiedanpää J, Saijets J, Jounela P, et al. 2020. Beliefs in conflict: The management of Teno Atlantic salmon in the Sámi homeland in Finland. Environmental Management, 66(6):1039-1058.

DOI

[13]
Hunter D, Borelli T, Beltrame D M O, et al. 2019. The potential of neglected and underutilized species for improving diets and nutrition. Planta, 250(3):709-729.

DOI PMID

[14]
Liu M C, Xiong Y, Yuan Z, et al. 2014. Standards of ecological compensation for traditional eco-agriculture: Taking Rice-fish System in Hani Terrace as an example. Journal of Mountain Science, 11(4):1049-1059.

DOI

[15]
Luo B S, Liu B, Zhang H Z, et al. 2019. Wild edible plants collected by Hani from terraced rice paddy agroecosystem in Honghe Prefecture, Yunnan, China. Journal of Ethnobiology and Ethnomedicine, 15(1):56. DOI: 10.1186/s13002-019-0336-x.

DOI

[16]
Lynch A H, Adler C E, Howard N C. 2014. Policy diffusion in arid basin water management: A Q-method approach in the Murray-Darling Basin, Australia. Regional Environmental Change, 14(4):1601-1613.

DOI

[17]
Mavengahama S, McLachlan M, Clercq W. 2013. The role of wild vegetable species in household food security in maize based subsistence cropping systems. Food Security, 5(2):227-233.

DOI

[18]
Millennium Ecosystem Assessment. 2003. Ecosystems and human well-being:A framework for assessment. Washington DC, USA: Island Press.

[19]
Muller J, Almedom A M. 2008. What is “famine food”? Distinguishing between traditional vegetables and special foods for times of hunger/scarcity (Boumba, Niger). Human Ecology, 36(4):599-607.

DOI

[20]
Ngome P I T, Shackleton C, Degrande A, et al. 2017. Addressing constraints in promoting wild edible plants’ utilization in household nutrition: Case of the Congo Basin forest area. Agriculture & Food Security, 6(1):1-10.

[21]
Nolan J M, Pieroni A. 2014. Introduction to special issue on food security in a changing world. Journal of Ethnobiology, 34(1):4-6.

DOI

[22]
Nordhagen S, Pascual U, Drucker A G. 2017. Feeding the household, growing the business, or just showing off? Farmers’ motivations for crop diversity choices in Papua New Guinea. Ecological Economics, 137:99-109.

DOI

[23]
Pawera L, Khomsan A, Zuhud E A M, et al. 2020. Wild food plants and trends in their use: From knowledge and perceptions to drivers of change in west Sumatra, Indonesia. Foods, 9(9):1240. DOI: 10.3390/foods9091240.

DOI

[24]
Pirard R, Petit H, Baral H, et al. 2016. Perceptions of local people toward pulpwood plantations: Insights from the Q-method in Indonesia. International Forestry Review, 18(2):218-230.

DOI

[25]
Pouta E, Sievänen T, Neuvonen M. 2006. Recreational wild berry picking in Finland—Reflection of a rural lifestyle. Society & Natural Resources, 19(4):285-304.

[26]
Wijaya S. 2019. Indonesian food culture mapping: A starter contribution to promote Indonesian culinary tourism. Journal of Ethnic Foods, 6(1):1-10.

DOI

[27]
Yuan Z, Min Q W, Cheng S K. 2013. The smallholder economy for the Hani Rice Terraces sustaining millennium. Journal of China Agricultural University ( Social Sciences Edition) , 30(4):133-140. (in Chinese)

[28]
Zabala A, Pascual U. 2016. Bootstrapping Q methodology to improve the understanding of human perspectives. Plos One, 11(2):e0148087. DOI: 10.1371/journal.pone.0148087.

DOI

[29]
Zabala A, Pascual U, García-Barrios L. 2017. Payments for pioneers? Revisiting the role of external rewards for sustainable innovation under heterogeneous motivations. Ecological Economics, 135:234-245.

DOI

[30]
Zhang Y X, Xia D L, Min Q W. 2018. How to balance the relationship between conservation of Important Agricultural Heritage Systems (IAHS) and socio-economic development? A theoretical framework of sustainable industrial integration development. Journal of Cleaner Production, 204:553-563.

DOI

[31]
Zhang Y X, Li X D, Min Q W. 2019. Transportation accessibility of central towns in important Agricultural Heritage Systems sites in mountainous areas and its impact on local economic development: A case study of Honghe Hani Rice Terraced System, Yunnan. Journal of Resources and Ecology, 10(1):29-38.

DOI

[32]
Zhang Y X, Min Q W, Zhang C Q, et al. 2017. Traditional culture as an important power for maintaining agricultural landscapes in cultural heritage sites: A case study of the Hani Terraces. Journal of Cultural Heritage, 25:170-179.

DOI

Outlines

/