Resources and Sustainbility

Ecological Footprint Evaluation of Three Types of Wood Flooring in China based on Their Production Data from 2000 to 2018

  • LI Jianquan 1 ,
  • YUAN Yue , 2, * ,
  • LUO Shuzheng 3
Expand
  • 1.Research Institute of Forestry Policy and Information, Chinese Academy of Forestry, Beijing 100091, China
  • 2.Operation Centre, Chongming Dongtan Nature Reserve of Shanghai City, Shanghai 202162, China
  • 3.Department of Biological Sciences, Xinzhou Teachers University, Xinzhou, Shanxi 034000, China
*YUAN Yue, E-mail:

Received date: 2020-07-27

  Accepted date: 2021-03-01

  Online published: 2021-07-30

Supported by

The Fundamental Research Funds for the Central Non-profit Research Institution of CAF(CAFYBB2019MB002)

The Project of the State Forestry Administration of the People’s Republic of China(2015-R04)

Abstract

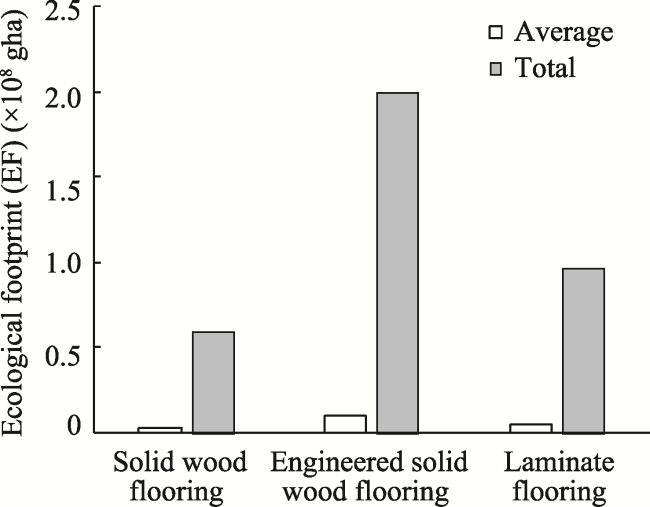
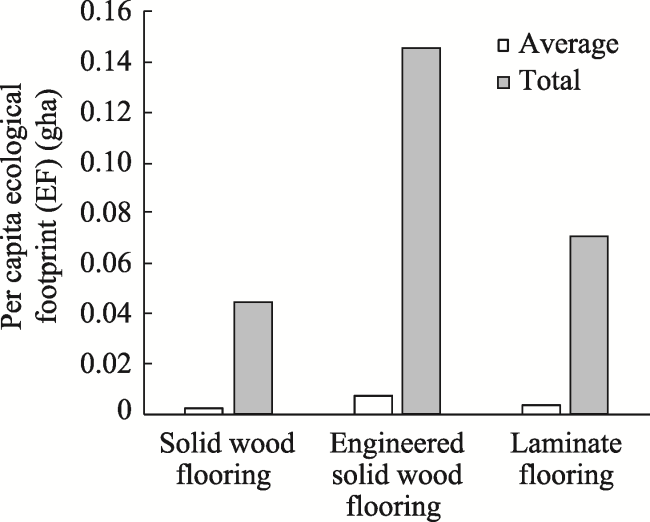
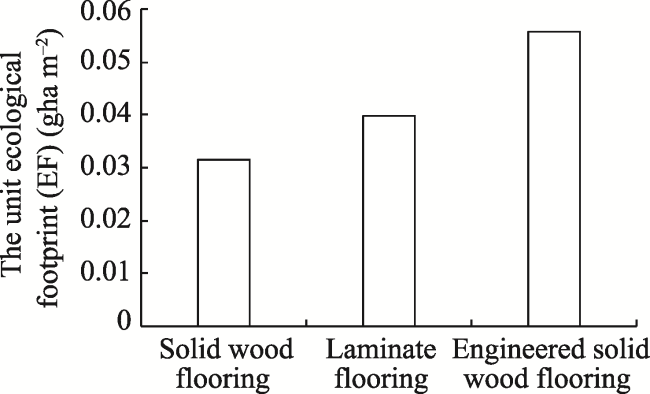
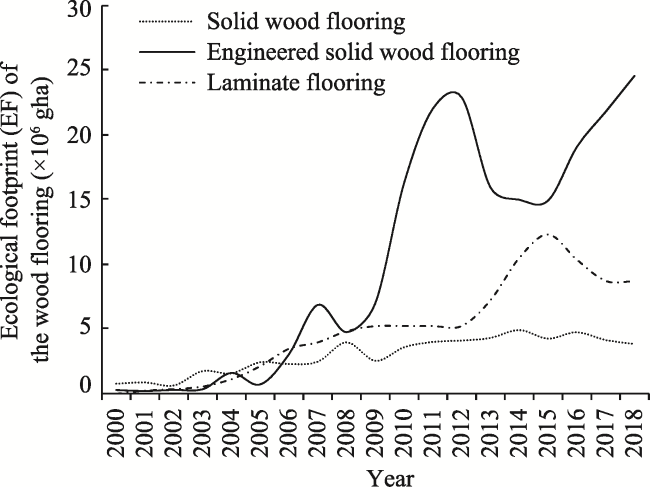
To encourage the environmental responsibility of consumers and manufacturers for forest management, it is necessary to evaluate the environmental influences of forest products. Ecological footprint (EF) is an internationally recognized indicator for estimating the natural capital consumption and environmental influences of various forest products. In this study, we developed an accounting model for the EF evaluation of wood flooring, which is a tertiary forest product, by the method of transformation. Next, we used that model to evaluate the EF of three types of wood flooring in China according to their production data from 2000 to 2018. We collected the necessary data by visiting typical enterprises in China and referring to the relevant literature. According to our results, the average EFs of solid wood flooring, engineered solid wood flooring and laminate flooring between 2000 to 2018 were 3.13×10 6, 1.05×10 7 and 5.07×10 6gha, respectively. The total EFs of solid wood flooring, engineered solid wood flooring and laminate flooring from 2000 to 2018 were 5.95×10 7, 1.99×10 8and 9.64×10 7gha, respectively. The coefficients of variation (CV) of the EFs for these three types of wood flooring were 0.45, 0.87 and 0.76, respectively. The average and total EFs of the engineered solid wood flooring were the largest among the three types of wood flooring. The per capita EF and unit EF for the engineered solid wood flooring were also the highest among the three types of wood flooring. The EFs showed an upward trend with irregular fluctuations from 2000 to 2018 for all three types of wood flooring. It is necessary to reduce the EF of the engineered solid wood flooring and use more environmentally friendly products, such as solid wood flooring, for environmental protection.

Cite this article

LI Jianquan , YUAN Yue , LUO Shuzheng . Ecological Footprint Evaluation of Three Types of Wood Flooring in China based on Their Production Data from 2000 to 2018[J]. Journal of Resources and Ecology, 2021 , 12(3) : 430 -436 . DOI: 10.5814/j.issn.1674-764x.2021.03.012

1 Introduction

Wood products occupy an important position in international trade. The wood flooring exports of China are large every year, which has indirectly transferred environmental damage problems from all over the world (Xu et al., 2014). Therefore, it is important to evaluate the environmental influence and consumption of wood flooring. The ecological footprint (EF) put forward by Mathis Wackernagel in 1990 is an internationally recognized indicator (Rees, 1992; Wackernagel and Rees, 1997). It is often used to measure the environmental influence and consumption of a human population, national and regional development, industrial production or a single product (Penela and Villasante, 2008; Kitzes and Wackernagel, 2009).
EF provides a measurement of the ecologically productive land and water needed to meet the consumption of a population and to absorb all of its wastes (Simmons, 2001). It is estimated by converting the agricultural or biological production or consumption data of a population into the corresponding ecologically productive land area (Penela and Villasante, 2008). The ecologically productive land area can be divided into six categories: energy land, degraded or built land, gardens, crop land, forests and sea space (Bicknell et al., 1998). The forest products footprint represents the area of world average forest land needed to supply wood for fuel, construction and paper.
Wood flooring is a tertiary forest product obtained from the primary forest products, and studies related to EF evaluation of wood flooring are lacking. According to the working guidebook to the national footprint and biocapacity accounts (Lin et al., 2019), the EF for a derived product can be calculated by converting the tonnes of the product directly into a roundwood equivalent. For a tertiary forest product, a similar transformation should be carried out in two steps.
In China, wood flooring mainly consists of solid wood flooring, laminate flooring and engineered solid wood flooring. Raw materials for solid wood flooring mainly include logs (or sawn wood) and paint. Raw materials for laminate flooring mainly include resisting paper, decorated paper, fiberboard, equilibrium paper and adhesives. Raw materials for engineered solid wood flooring mainly include plywood, veneer sheets, adhesives and paint. With the severe global ecological problems, solid wood flooring is known to consume a large amount of wood and perhaps less of it should be produced. However, the concept of green consumption encourages the consumption of wood raw material products rather than synthetic materials. Thus, the study of the EF for the three types of wood flooring can provide a reference for the flooring type selection.
In this study, we developed an EF accounting model for the three types of the wood flooring. Then, we estimated and compared the EFs of the three types of the wood flooring based on their production data from 2000 to 2018 using this model. We also analyzed the factors influencing the EF values of the three types of the wood flooring and put forward several proposals for reducing their overall EFs.

2 Methods

We obtained all the necessary data for EF estimation of the wood flooring by searching for relevant literature and related websites and by visiting eight wood flooring enterprises.
We used the traditional EF evaluation method to estimate the EF of the wood flooring without considering imports and exports, according to the Working Guidebook to the National Footprint and Biocapacity Accounts (Lin et al., 2019). The following equation was used for estimating the EF of the wood flooring.
$EF\text{=}\sum\limits_{j=1}^{m}{\sum\limits_{i=1}^{n}{\left( {{\tau }_{i}}\times P\times EQ{{F}_{j}} \right)/\gamma _{i}^{{}}}}$
where τi is the demand coefficient of wood flooring for raw materials i; P is the production of the wood flooring; EQFj is the equivalence factor of land use types j; γi is the global average yield of raw materials i.

2.1 The demand coefficient (τ)

The values of τ for the three types of wood flooring for wood can be calculated by following equations:
${{\tau }_{sw}}={{\tau }_{ss}}\times {{\tau }_{saw}}$
${{\tau }_{lw}}={{\tau }_{lf}}\times {{\tau }_{fw}}$
${{\tau }_{ew}}={{\tau }_{ep}}\times {{\tau }_{pw}}$
where τsw is τ of the solid wood flooring for wood, τss is τ of the solid wood flooring for sawn wood, τsaw is τ of sawn wood for wood; τlw is τ of the laminate flooring for wood, τlf is τ of the laminate flooring for fiberboards, τfw is τ of fiberboards for wood; τew is τ of the engineered solid wood flooring for wood, τep is τ of the engineered solid wood flooring for plywood, and τpw is τ of plywood for wood. All of the data needed for the above τ calculations were from investigation of the enterprises. Specifically, the five typical leading enterprises investigated were located in Shandong, Zhejiang, Jiangsu, Guangdong and other places, and include both state-owned enterprises and private enterprises. According to the survey, the production cost includes about 80% for raw materials, less than 10% for energy consumption and 10%-20% for labor cost.
The τ values of the three types of wood flooring for other non-wooden raw materials can be calculated by the following equation:
${{\tau }_{wr}}=\chi \times {{\theta }_{e}}$
where τwr is τ of the wood flooring for the raw material, χ is the consumption of the raw material, and θe is the specific embodied energy of the raw material. The main non-wooden raw materials used in the process of wood flooring production were paint and adhesives. The consumption values of these two raw materials were obtained from the enterprise investigation data and the values of θe for the two raw materials referenced a related document (Saravia-Cortez et al., 2013).
The τ of the three types of wood flooring for different raw materials were calculated and are listed in Table 1.
Table 1 Demand coefficient (τ) of the wood flooring for raw materials
Wood flooring Raw material Demand coefficient (τ)
Solid wood flooring Wood 0.046 (m3 m-2)
Paint per unit flooring 0.00062 (MJ m-2)


Laminate flooring

Wood 0.058 (m3 m-2)
Paint per unit flooring 0.00062 (MJ m-2)
Adhesive per unit flooring 0.00126 (MJ m-2)

Engineered solid wood flooring

Wood 0.081 (m3 m-2)
Paint per unit flooring 0.00062 (MJ m-2)
Adhesive per unit flooring 0.00112 (MJ m-2)

Note: Source data from enterprise research.

2.2 The equivalence factor (EQF)

For our analysis, raw materials of the wood flooring included wood and other non-wooden materials whose EFs were estimated by converting to energy consumption. Therefore, only the EQFs of the absorption land and forest were needed in this paper.
The data on the EQF was from the academic literature and global footprint network (Ewing et al., 2010; Saravia-Cortez et al., 2013; Lazarus et al., 2014; Lee, 2015). Specifically, the EQF in 2005 was used to calculate the EF of the wood flooring from 2000 to 2005 (WWF, 2004). The EQF in 2015 was used to calculate the EF of the wood flooring from 2011 to 2015 (Salvo et al., 2015). The EQF in 2016 was used to calculate the EF of wood flooring in 2016 and 2017 (Lin et al., 2019).

2.3 The global average yield (γ) and the production of the wood flooring (P)

The γ of wood (1.82 m3 wha-1) was from the Working Guidebook to the National Footprint and Biocapacity Accounts (Lin et al., 2019). The γ of oil (48.2 GJ wha-1) was identified according to relevant literature (Saravia-Cortez et al., 2013). It should be noted that due to the diversity of wood sources (domestic and imported), global parameters (γ value) were used for the calculations.
The data on the P of the wood flooring were from “China Forestry Statistical Yearbook 2000-2018”. The EQF andP values we used for the calculation are listed in Table 2. Specifically, the EF evaluation for the laminate flooring was from 2001. Moreover, the data on the P of the laminate flooring in 2010, 2011 and 2012 were absent. In the diagram, we estimated the EF of the laminate flooring in these three years by linear interpolation.
Table 2 Equivalence factors and production quantities of the three types of the wood flooring from 2000 to 2018
Year Equivalence factor of forest Equivalence factor of CO2 absorption land (gha wha-1) The production quantities of solid wood flooring (m2) The production quantities of laminate flooring (m2) The production quantities of engineered solid wood flooring (m2)
2000 a 1.25 a 1.25 2.65´107 5.65´106 -
2001 a 1.25 a 1.25 2.98´107 4.28´106 5.92´106
2002 a 1.25 a 1.25 2.25´107 5.93´106 8.64´106
2003 a 1.25 a 1.25 5.65´107 6.52´106 1.32´107
2004 a 1.25 a 1.25 5.11´107 2.76´107 2.68´107
2005 a 1.25 a 1.25 7.74´107 1.28´107 5.13´107
2006 b 1.24 b 1.24 7.36´107 5.18´107 8.47´107
2007 c 1.26 c 1.26 7.78´107 1.13´108 9.49´107
2008 c 1.26 c 1.26 1.23´108 7.90´107 1.16´108
2009 d 1.24 d 1.24 8.14´107 1.18´108 1.27´108
2010 e 1.26 e 1.26 1.12´108 2.68´108 -
2011 f 1.28 f 1.28 1.22´108 3.57´108 -
2012 f 1.28 f 1.28 1.25´108 3.71´108 -
2013 f 1.28 f 1.28 1.31´108 2.58´108 1.70´108
2014 f 1.28 f 1.28 1.50´108 2.43´108 2.47´108
2015 f 1.28 f 1.28 1.30´108 2.42´108 2.90´108
2016 g 1.25 g 1.25 1.48´108 3.16´108 2.50´108
2017 g 1.25 g 1.25 1.29´108 3.61´108 2.10´108
2018 g 1.29 g 1.29 1.17´108 3.94´108 2.03´108

Note: Sources: a WWF (2010); b Salvo et al. (2015); c Lee (2015); d Ewing et al. (2010); e Saravia-Cortez et al. (2013); fLazarus et al. (2014); gLin et al. (2019).

2.4 The per capita EF and the unit EF

The per capita EFs of the solid wood flooring, engineered solid wood flooring and laminate flooring were calculated as the respective EF divided by population size. The unit EFs of the solid wood flooring, laminate flooring and engineered solid wood flooring were calculated as the EF divided by P (production).

3 Results

3.1 The EFs of the solid wood flooring, engineered solid wood flooring and laminate flooring

The average EFs of the solid wood flooring, engineered solid wood flooring and laminate flooring between 2000 and 2018 were 3.13´106, 1.05´107 and 5.07´106 gha, respectively. The total EFs of the solid wood flooring, engineered solid wood flooring and laminate flooring from 2000 to 2018 were 5.95´107, 1.99´108 and 9.64´107 gha, respectively. The coefficients of variation (CV) of the EFs among these years for the solid wood flooring, engineered solid wood flooring and laminate flooring were 0.45, 0.87 and 0.76, respectively. The average and total EFs of the engineered solid wood flooring were the largest among the three types of the wood flooring. The average and total EFs of the solid wood flooring were the smallest among the three types of the wood flooring (Fig. 1). The differences of the average and total EFs for the three types of the wood flooring were mainly due to the consumption of different raw materials. The high consumption of the engineered solid wood flooring for wood led to a large demand coefficient.
Fig. 1 The EFs of the three types of wood flooring based on the production data from 2000 to 2018

3.2 The per capita EFs and the unit EFs for the three types of wood flooring

The average per capita EFs of the solid wood flooring, engineered solid wood flooring and laminate flooring between 2000 and 2018 were 0.002, 0.008 and 0.004 gha, respectively. The average per capita EF of the engineered solid wood flooring was the highest and the average per capita EF of the solid wood flooring was the lowest. The total per capita EFs of the solid wood flooring, laminate flooring and engineered solid wood flooring from 2000 to 2018 were 0.044, 0.146 and 0.071 gha, respectively. The total per capita EF of the engineered solid wood flooring was the highest and the total per capita EF of the solid wood flooring was the lowest (Fig. 2).
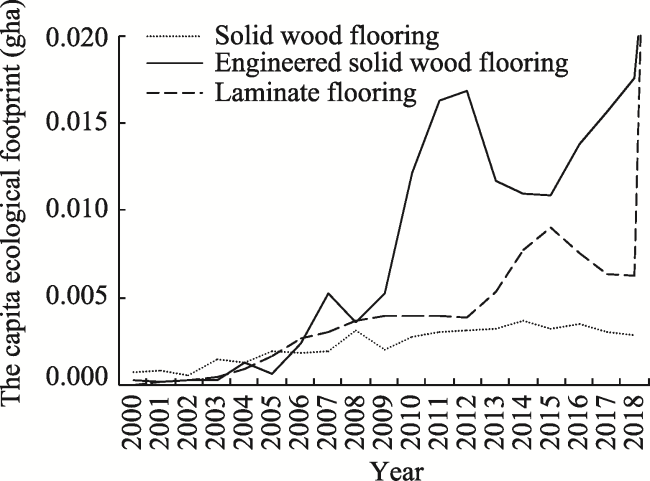
Fig. 2 The per capita EFs of the three types of the wood flooring based on the production data from 2000 to 2018
The unit EFs of the solid wood flooring, engineered solid wood flooring and laminate flooring were 0.032, 0.056 and 0.040 gha m-2, respectively. The unit EF of the engineered solid wood flooring was the highest and the unit EF of the solid wood flooring was the lowest (Fig. 3). Differences in the unit EFs of the wood flooring were caused by different production processes and wood sources. In particular, solid wood flooring is processed on the basis of sawn timber; engineered solid wood flooring is processed based on fiberboard pasted with solid wood veneer and wood paper; while laminate flooring is processed based on plywood covered with a wear-resistant layer and balance paper. These differences in raw material consumption led to different demand coefficients.
Fig. 3 The unit EFs of the three types of wood flooring

3.3 The changes in EFs of the three types of wood flooring from 2010 to 2018

The EF value changes of all three types of wood flooring appeared as upward trends on the whole with irregular fluctuations from 2000 to 2018. The EF of the solid wood flooring and its per capita EF were the highest in 2014 and lowest in 2002. The EF of the engineered solid wood flooring and its per capita EF were the lowest in 2001 and highest in 2018. The EF of the laminate flooring and its per capita EF were the lowest in 2001 and highest in 2015 (Fig. 4, Fig. 5). The changes in EF of the three types of wood flooring from 2010 to 2018 were mainly caused by their different production quantities in these years.
Fig. 4 The changes in EF of the three types of the wood flooring from 2000 to 2018
Fig. 5 The changes in per capita EF of the three types of wood flooring from 2000 to 2018
The EF of engineered solid wood flooring was the largest part in the overall EF of wood flooring and the EF of solid wood flooring was the smallest part in the overall EF of wood flooring for all the years. The proportion of solid wood flooring in the total EF decreased year by year (Fig. 6).
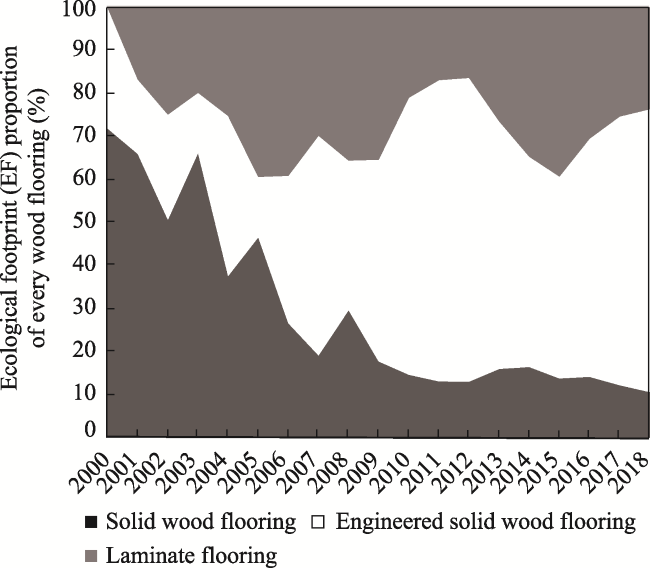
Fig. 6 The proportions of the three types of wood flooring in the overall EF from 2000 to 2018

4 Discussion

4.1 Environmental influences of products

Many previous researchers have studied the GHG emissions of consumer behavior and production enterprises, and the carbon footprint became an important evaluation index for measuring the total amount of carbon dioxide emissions (Scipioni et al., 2012; Pelletier et al., 2013). Pelletier et al. (2013)conducted a carbon footprint analysis of the egg production and processing supply chains based on LCA. Scipioni et al. (2012) offered a model for monitoring the carbon footprint of individual products based on an analysis of the published ISO standards for GHG emissions. Based on this, major industrialized countries have adopted many energy-saving and emission reduction measures and imposed carbon taxes in international trade. However, greenhouse gas emissions are only a portion of the environmental influences of production processes. Resource consumption, especially for forestry resources, is even more important for the environmental protection of the earth. Recently, many researchers even put forward a definition of the “Footprint Family” as a suite of indicators, in which the carbon footprint was included, to track human pressure on the planet (Galli et al, 2012). Our study evaluated the EF of three different types of wood flooring which consume forestry resources. We found that the higher unit EF of wood flooring was usually associated with higher yield. The producers and consumers may not have paid the necessary attention yet to the environmental impact of wood flooring. Some optimists may believe that technical progress would help humans to overcome these difficulties (Christodoulou and Kourantidou, 2013), however, it would be more important to improve the environmental awareness of enterprise producers and citizens.

4.2 Product ecological footprint (PEF)

Product ecological footprint (PEF) is the sum of time-integrated direct land occupation and indirect land occupation, related to nuclear energy use, CO2 emissions from fossil fuels and cement burning (Limnios et al., 2016). Previous research on the PEF mostly focused on the life cycle assessment (LCA) method. For example, some researchers applied ecological footprint analysis (EFA) to a commercial nectarine orchard in Piedmont and considered the whole lifetime of the orchard or the use of a multifunctional EF-based method (Cerutti et al., 2013). Other researchers compared the EFs of two typical Tuscan wines, which involved the comparison of two production procedures (Niccolucci et al., 2008). Some researchers who studied the annual energy consumption, CO2 consumption and EF of the external wall structure in the Daqing region of China combined life cycle theory and EF theory (Jin and Ling, 2015). Another group discussed EF calculations for a number of products and services based on the LCA method (Huijbregts et al., 2008). Some researchers proposed a staged, self-improving approach for the computation of PEF and applied it to a small-scale case study (Limnios et al., 2009). However, unlike these studies, our study evaluated the EF of wood flooring based on the traditional definition of the EF, just like the method guidebook suggested. Although the LCA method can be used for the evaluation of environmental aspects associated with all stages of the life of a product, it is not conducive to the comparison of environmental impacts among different products.

4.3 Ecological inequality and polarization

It is widely known that a country can maintain an ecological surplus through its importing capacity, and can also obtain short-term economic interests through its exporting capacity. However, if such measures continue for too long, they will cause economic and ecological inequality and polarization. Some nations' demands on the planet are greater than their respective biocapacity, while others use less than their available capacity (Duro and Teixidó-Figueras, 2012). Similarly, a product can be produced in one country and consumed in another country, so the EFs of consumption and production are not equal. In this study, we only calculated the EF of wood flooring production. In fact, only about 2% wood flooring in China was used for exports.

5 Conclusions

The production of wood flooring has important influences on the environment and requires a large supply of wood. It is important to evaluate the environmental influence of wood flooring. In this study, we established an accounting model for evaluating the EF of wood flooring using transformed methods, and we found that the average EF, the total EF, the per capita EF and the unit EF of the engineered solid wood flooring were the highest among the three wood flooring types based on wood flooring production data from 2000 to 2018. The EF of the engineered solid wood flooring increased sharply from 2009 to 2012. According to our results, the EF of the engineered solid wood flooring was the highest and its demand coefficient was also the highest among the three types of wood flooring. Determining how to decrease the demand coefficient of the engineered solid wood flooring for the wood would be important for reducing its EF. Moreover, the proportion of engineered solid wood flooring in the overall EF was the largest. So, if we can control the engineered solid wood flooring outputs and use environmentally friendly products we will reduce the EF for the whole wood flooring industry.
1
Bicknell K B, Ball R J, Cullen R , et al. 1998. New methodology for the ecological footprint with an application to the New Zealand economy. Ecological Economics, 27(2):149-160.

DOI

2
Cerutti A K, Beccaro G L, Bagliani M , et al. 2013. Multifunctional ecological footprint analysis for assessing eco-efficiency: A case study of fruit production systems in Northern Italy. Journal of Cleaner Production, 40(3):108-117.

DOI

3
Christodoulou A, Kourantidou M . 2013. The ecological footprint and its economic dimension in terms of greek and international reality. Fresenius Environmental Bulletin, 22(7b):2124-2127.

4
Duro J A, Teixidó-Figueras J . 2013. Ecological footprint inequality across countries: The role of environment intensity, income and interaction effects. Ecological Economics, 93(3):34-41.

DOI

5
Ewing B, Moore D, Goldfinger S . 2010. Ecological footprint atlas 2010. Bulletin of the World Health Organization, 79(10):971-979.

6
Galli A, Wiedmann T, Ercin E , et al. 2012. Integrating ecological, carbon and water footprint into a “Footprint Family” of indicators: Definition and role in tracking human pressure on the planet. Ecological Indicators, 16(16):100-112.

DOI

7
Huijbregts M A J, Hellweg S, Frischknecht R , et al. 2008. Ecological footprint accounting in the life cycle assessment of products. Ecological Economics, 64(4):798-807.

DOI

8
Jin H, Ling W . 2015. External wall structure of green rural houses in Daqing, China, based on life cycle and ecological footprint theories. Frontiers of Architecture and Research, 16(3):212-219.

9
Kitzes J, Wackernagel M . 2009. Answers to common questions in Ecological Footprint accounting. Ecological Indicators, 9(4):812-817.

DOI

10
Lazarus E, Zokai G, Borucke M , et al. 2014. Working guidebook to the national footprint accounts 2014. Oakland, USA: Global Footprint Network.

11
Lee Y J . 2015. Land, carbon and water footprints in Taiwan. Environmental Impact Assessment Review, 54:1-8.

DOI

12
Limnios E A M, Ghadouani A, Schilizzi S G M , et al. 2009. Giving the consumer the choice: A methodology for product ecological footprint calculation. Ecological Economics, 68(10):2525-2534.

DOI

13
Limnios E M, Schilizzi S G, Burton M , et al. 2016. Willingness to pay for product ecological footprint: Organic vs non-organic consumers. Technological Forecasting and Social Change, 111:338-348.

DOI

14
Lin D, Hanscom L, Martindill J , et al. 2019. Working guidebook to the national footprint and biocapacity accounts. Oakland, USA: Global Footprint Network.

15
Niccolucci V, Galli A, Kitzes J , et al. 2008. Ecological footprint analysis applied to the production of two Italian wines. Agriculture Ecosystems & Environment, 128(3):162-166.

DOI

16
Pelletier N, Ibarburu M, Xin H . 2013. A carbon footprint analysis of egg production and processing supply chains in the Midwestern United States. Journal of Cleaner Production, 54(9):108-114.

DOI

17
Penela A C, Villasante C S . 2008. Applying physical input-output tables of energy to estimate the energy ecological footprint (EEF) of Galicia (NW Spain). Energy Policy, 36(3):1148-1163.

DOI

18
Rees W E . 1992. Ecological footprints and appropriated carrying capacity: What urban economics leaves out. Environment and Urbanization, 4(2):121-130.

DOI

19
Salvo G, Simas M S, Pacca S A , et al. 2015. Estimating the human appropriation of land in Brazil by means of an Input-output economic model and ecological footprint analysis. Ecological Indicators, 53:78-94.

DOI

20
Saravia-Cortez A M, Herva M, García-Diéguez C , et al. 2013. Assessing environmental sustainability of particleboard production process by ecological footprint. Journal of Cleaner Production, 52:301-308.

DOI

21
Scipioni A, Manzardo A, Mazzi A , et al. 2012. Monitoring the carbon footprint of products: A methodological proposal. Journal of Cleaner Production, 36(17):94-101.

DOI

22
Simmons C . 2001. The use of ecological footprint and biocapacity analyses as sustainability indicators for sub-national geographical areas: A recommended way forward. Rome, Italy: Ambiente Italia (ECIP).

23
Wackernagel M, Rees W E . 1997. Perceptual and structural barriers to investing in natural capital: Economics from an ecological footprint perspective. Ecological Economics, 20(1):3-24.

DOI

24
Xu J, Li M L, Chen B D . 2014. The situation, problems and solutions of China’s wood flooring exports. China Forestry Economy, ( 4):76-78.

Outlines

/