
Journal of Resources and Ecology >
Analysis of the Spatio-temporal Evolution of Land Intensive Use and Land Ecological Security in Tianjin from 1980 to 2019
Received date: 2020-10-20
Accepted date: 2021-03-04
Online published: 2021-07-30
Supported by
Tianjin Art and Science Planning Project(D16007)
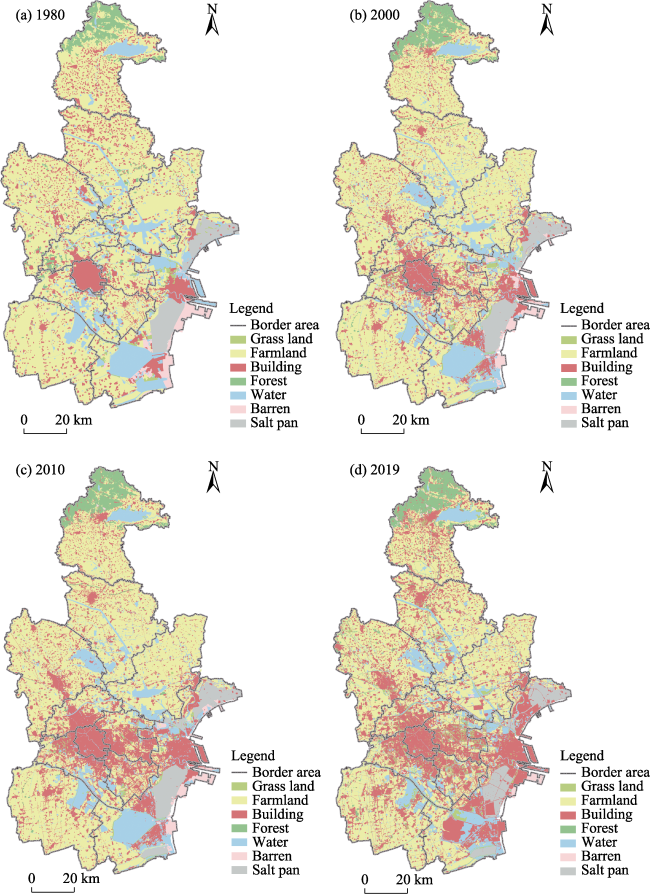
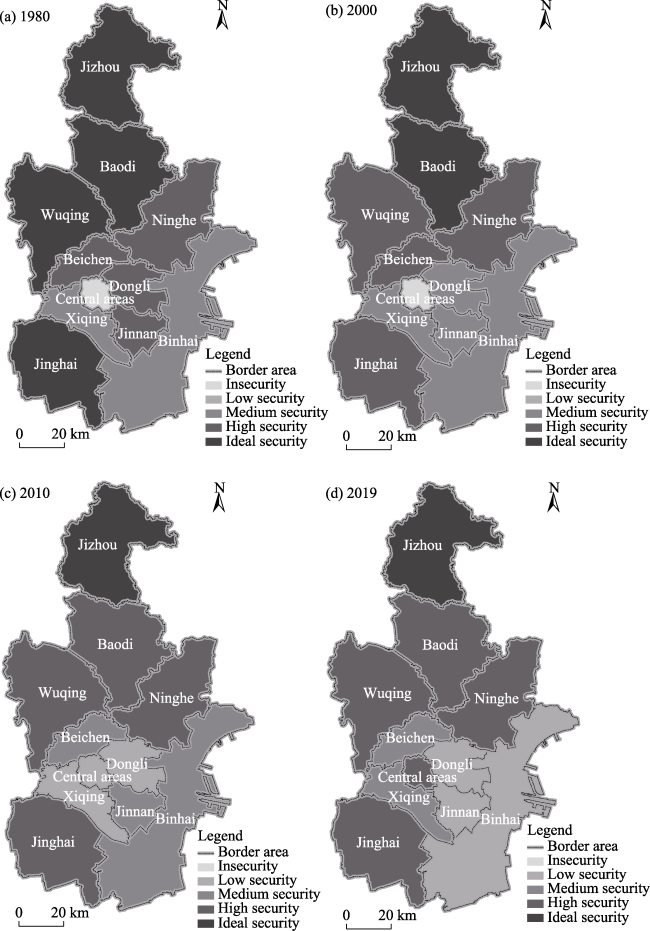
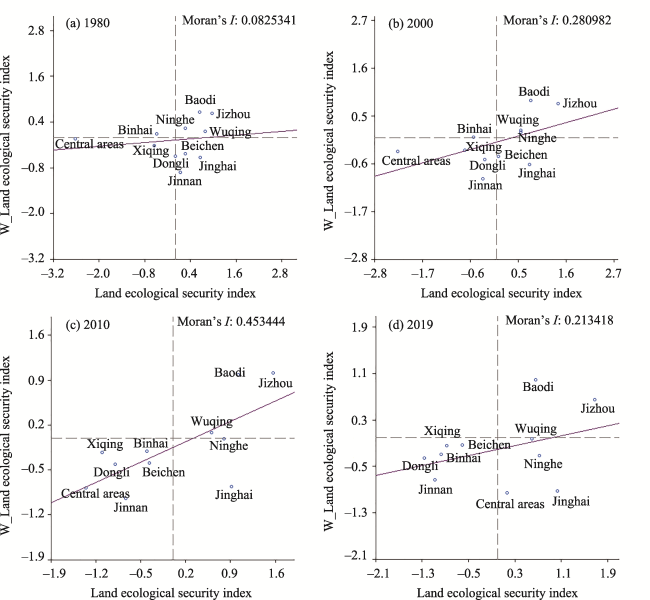
The problem of land ecological security directly threatens the sustainable development of many regions, and exploring the spatio-temporal characteristics of land ecological security is helpful for analyzing the land ecological patterns between regions and over time. Based on the interpretation of remote sensing image data for Tianjin in 1980, 2000, 2010 and 2019, supported by software such as ArcGIS and GeoDa, the changes of land use in the study area are calculated by using the land use dynamic degree. Then, the land ecological security index and spatial autocorrelation analysis methods are used to study the spatial correlations and internal heterogeneity of land ecological security in each district in Tianjin. The results show that: (1) The land use of Tianjin has changed dramatically in the past 40 years: the building land has been expanding, while the farmland and barren have been shrinking continuously. (2) The overall level of land ecological security is in the high security area, and Jizhou District is the highest, while the Central areas and Binhai are low. (3) The spatial heterogeneity of land ecological security is not obvious, but the spatial agglomeration is strong.
LI Xuemei , LIU Qian , HAN Jie , YUAN Ping , LI Yamin . Analysis of the Spatio-temporal Evolution of Land Intensive Use and Land Ecological Security in Tianjin from 1980 to 2019[J]. Journal of Resources and Ecology, 2021 , 12(3) : 367 -375 . DOI: 10.5814/j.issn.1674-764x.2021.03.006
Fig. 1 Land use and its changes in Tianjin from 1980 to 2019 |
Table 1 Ecological risk intensity coefficients of different land use types |
| Grass land | Farmland | Building | Forest | Water | Barren | Salt pan | Data sources |
|---|---|---|---|---|---|---|---|
| 0.0493 | 0.1425 | 0.6137 | 0.0258 | 0.0552 | 0.1135 | 0.0000 | Xiao and Tian, 2014 |
| 0.1290 | 0.1691 | 0.3112 | 0.0708 | 0.0961 | 0.2238 | 0.0000 | Wang et al., 2018 |
| 0.1600 | 0.3200 | 0.8500 | 0.1200 | 0.5300 | 0.8200 | 0.0000 | Bai et al., 2019 |
| 0.0004 | 0.0276 | 0.0109 | 0.0059 | 0.0481 | 0.0025 | 0.0000 | He et al., 2019 |
| 0.1500 | 0.9500 | 0.7200 | 0.1200 | 0.1600 | 0.0000 | 0.0000 | Zhao et al., 2013 |
| 0.1600 | 0.3200 | 0.8500 | 0.1200 | 0.5300 | 0.8200 | 0.0000 | Xu et al., 2016 |
| 0.0726 | 0.1916 | 0.3934 | 0.0427 | 0.1425 | 0.1572 | 0.0000 | Hu et al., 2017 |
| 0.1600 | 0.3200 | 0.7200 | 0.1200 | 0.5300 | 0.8200 | 0.0000 | Yang et al., 2010 |
| 0.0000 | 0.2156 | 0.3141 | 0.1518 | 0.1983 | 0.0000 | 0.0000 | An et al., 2010 |
| 0.0000 | 0.0000 | 0.0000 | 0.0000 | 0.0000 | 0.0000 | 0.0952 | Mo et al., 2017 |
| 0.0726 | 0.1797 | 0.4903 | 0.0464 | 0.0664 | 0.1648 | 0.0952 | This study |
Table 2 Land use areas and proportions in Tianjin from 1980 to 2019 |
| Land use type | 1980 | 2000 | 2010 | 2019 | ||||
|---|---|---|---|---|---|---|---|---|
| Area (ha) | Proportion (%) | Area (ha) | Proportion (%) | Area (ha) | Proportion (%) | Area (ha) | Proportion (%) | |
| Grass land | 13830.87 | 1.19 | 13328.76 | 1.14 | 13095.85 | 1.12 | 22033.59 | 1.89 |
| Farmland | 730818.61 | 62.75 | 676615.04 | 58.10 | 612309.14 | 52.58 | 566705.41 | 48.66 |
| Building | 158861.08 | 13.64 | 207869.66 | 17.85 | 276577.89 | 23.75 | 332985.14 | 28.59 |
| Forest | 42236.13 | 3.63 | 43419.37 | 3.73 | 43419.37 | 3.73 | 62396.20 | 5.36 |
| Water | 155709.61 | 13.37 | 164014.71 | 14.08 | 163056.45 | 14.00 | 137980.16 | 11.85 |
| Barren | 20526.58 | 1.76 | 17244.86 | 1.48 | 15033.68 | 1.29 | 8040.64 | 0.69 |
| Salt pan | 42574.56 | 3.66 | 42084.97 | 3.61 | 41084.97 | 3.53 | 35084.97 | 3.01 |
Table 3 Dynamic degree of land use in each district of Tianjin from 1980 to 2019 (Unit: %) |
| District | Grass land | Farmland | Building | Forest | Water | Barren | Salt pan |
|---|---|---|---|---|---|---|---|
| Jizhou | 1.43 | -0.67 | 1.10 | 1.24 | 0.05 | 0.00 | 0.00 |
| Baodi | -1.43 | -0.34 | 0.85 | 2.68 | 1.33 | -0.29 | 0.00 |
| Wuqing | -0.75 | -0.44 | 1.13 | 3.83 | 1.78 | 7.23 | 0.00 |
| Ninghe | -0.89 | -0.15 | 2.84 | -1.60 | -0.62 | 8.07 | 0.00 |
| Beichen | -1.84 | -0.88 | 5.04 | -1.82 | -0.48 | 36.41 | 0.00 |
| Xiqing | 11.43 | -1.17 | 6.40 | 0.76 | -0.92 | 0.00 | 0.00 |
| Dongli | 2.93 | -1.62 | 5.47 | 2.54 | -0.26 | 0.00 | 0.00 |
| Jinnan | 11.56 | -1.34 | 5.13 | 0.66 | 0.34 | 0.00 | 0.00 |
| Central areas | 0.00 | -2.56 | 0.54 | -0.30 | 4.23 | 0.00 | 0.00 |
| Jinghai | 0.39 | -0.43 | 4.34 | 5.50 | 0.25 | 2.29 | 0.00 |
| Binhai | 1.42 | -0.74 | 4.38 | -1.67 | -0.86 | -1.87 | -0.45 |
Fig. 2 Grade of land ecological safety in Tianjin from 1980 to 2019 |
Table 4 Land use ecological security indexes of individual districts in Tianjin from 1980 to 2019 |
| Year | Jizhou | Baodi | Wuqing | Ninghe | Beichen | Xiqing | Dongli | Jinnan | Central areas | Jinghai | Binhai | Tianjin |
|---|---|---|---|---|---|---|---|---|---|---|---|---|
| 1980 | 0.77 | 0.75 | 0.76 | 0.72 | 0.72 | 0.66 | 0.70 | 0.71 | 0.51 | 0.75 | 0.67 | 0.72 |
| 2000 | 0.78 | 0.74 | 0.72 | 0.72 | 0.69 | 0.64 | 0.67 | 0.66 | 0.53 | 0.73 | 0.65 | 0.71 |
| 2010 | 0.76 | 0.73 | 0.70 | 0.71 | 0.64 | 0.59 | 0.61 | 0.62 | 0.58 | 0.72 | 0.64 | 0.69 |
| 2019 | 0.77 | 0.71 | 0.70 | 0.71 | 0.63 | 0.62 | 0.59 | 0.60 | 0.68 | 0.73 | 0.61 | 0.68 |
Fig. 3 Scatter plot of land ecological security index values in Tianjin from 1980 to 2019 |
Table 5 Moran's I values of land ecological security index in each district of Tianjin from 1980 to 2019 |
| Year | 1980 | 2000 | 2010 | 2019 |
|---|---|---|---|---|
| Moran's I value | 0.083* | 0.281** | 0.453*** | 0.213* |
| P value | 0.086 | 0.013 | 0.001 | 0.061 |
Note: *, ** and *** are respectively 10%, 5% and 1% statistically significant. |
| 1 |
|
| 2 |
|
| 3 |
|
| 4 |
|
| 5 |
|
| 6 |
|
| 7 |
|
| 8 |
|
| 9 |
|
| 10 |
|
| 11 |
|
| 12 |
|
| 13 |
|
| 14 |
|
| 15 |
Publication Format Sub-Committee of National Technical Committee for Standardization of Information and Documentation work. 2007. Current Land Use Classification: GB/T 21010-2017. Beijing, China: China Standard Press. (in Chinese)
|
| 16 |
|
| 17 |
|
| 18 |
|
| 19 |
|
| 20 |
|
| 21 |
|
| 22 |
|
| 23 |
|
| 24 |
|
| 25 |
|
| 26 |
|
| 27 |
|
| 28 |
|
| 29 |
|
| 30 |
|
| 31 |
|
| 32 |
|
| 33 |
|
| 34 |
|
| 35 |
|
/
| 〈 |
|
〉 |