
Journal of Resources and Ecology >
Impact of Agricultural Labor Transfer on Agricultural Nonpoint Source Pollution: A Case Study of Jiangxi, China
|
ZHANG Peiwen, E-mail: zpw_jc@163.com |
Received date: 2020-08-04
Accepted date: 2020-11-30
Online published: 2021-07-30
Supported by
The National Natural Science Foundation of China(71803071)
The National Natural Science Foundation of China(72063014)
The Natural Science Foundation of Jiangxi Province(20181BAB211006)
Humanities and Social Sciences Foundation in Ministry of Education of China(20YJC790014)
The Humanities and Social Science Foundation of Jiangxi Province(JJ20204)
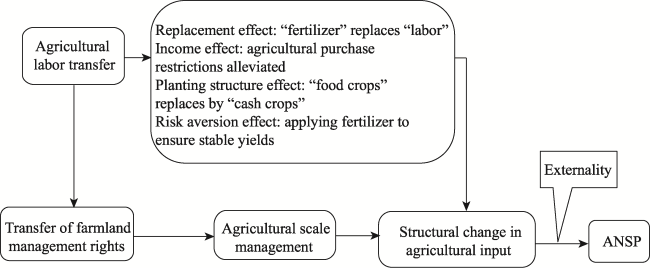
A large proportion of the rural labor force in China will continue to transfer to non-agricultural sectors in the near future, which will inevitably lead to the transformation of the agricultural production mode and the structure of the farmers’ livelihood. The Chinese government is making great efforts to govern agricultural nonpoint source pollution (ANSP), and farmers' environmental behavior is a key factor that must be considered in the formulation of agricultural environmental policies. Based on a set of micro survey data on farmers in the study area and econometric methods, this study investigates the impact of agricultural labor transfer on ANSP by considering the substitution effect of agricultural factors and the effect of agricultural economies of scale. The results show that the increase of the agricultural labor force will not be conducive to reducing ANSP, while the income increase brought by agricultural labor transfer will improve the input structure of agricultural factors and have a positive impact on ANSP reduction. Government departments should provide subsidies or incentive measures to help agricultural social service organizations to expand their coverage and increase the frequency of socialized agricultural services, in order to guide farmers in the use of environment-friendly agricultural technology to reduce the ANSP caused by agricultural factors at the source. Furthermore, it is necessary to facilitate the development of small-sized agricultural machinery suitable for small-area land cultivation.
ZHANG Peiwen , LU Hua , CHEN Yijing , SHU Cheng . Impact of Agricultural Labor Transfer on Agricultural Nonpoint Source Pollution: A Case Study of Jiangxi, China[J]. Journal of Resources and Ecology, 2021 , 12(3) : 358 -366 . DOI: 10.5814/j.issn.1674-764x.2021.03.005
Fig. 1 Mechanism for the impact of agricultural labor transfer on ANSP |
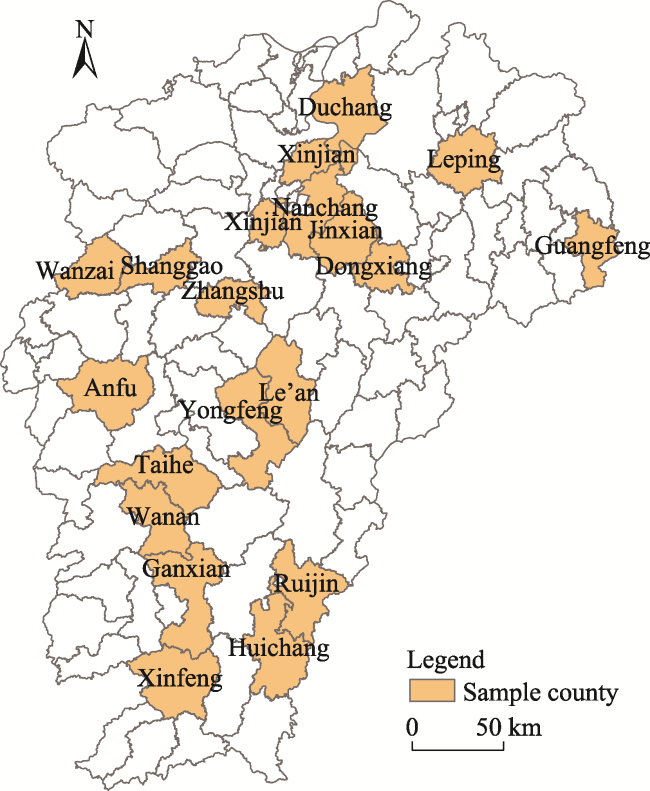
Fig. 2 The study area |
Table 1 Descriptive statistics of the variables |
| Variables | Assignment | Mean | Std. Dev. |
|---|---|---|---|
| Excess nitrogen | The amount of nitrogen input minus the amount of crop nutrients required | 105.9 | 193.87 |
| Number of agricultural laborers | Person | 1.93 | 0.85 |
| Health of the head of household | 1 = very good; 2 = good; 3 = general; 4 = bad | 2.11 | 1.00 |
| Non-agricultural income ratio | Proportions of non-agricultural income in total income | 0.52 | 0.36 |
| Are irrigation conditions suitable for cultivated land? | 0 = no; 1 = yes | 0.56 | 0.50 |
| Education of the head of household | 0 = 0; 1 = primary school; 2 = junior high school; 3 = high school; 4 = university and above | 1.40 | 0.82 |
| Age of head of the household | Years | 52.28 | 11.62 |
| Terrain conditions | 1= plain; 2= mountain; 3 =hill | 2.33 | 0.88 |
| Farm size | ha | 0.37 | 0.92 |
| Purpose of agricultural production | Proportions of agricultural production for sale at market | 0.42 | 0.40 |
| Is there an agricultural fertilization service organization in or near the village? | 0= no; 1= yes | 0.16 | 0.37 |
| Number of times participating in agricultural techniques training | Per year | 0.19 | 0.59 |
Table 2 Regression results for relationship between agricultural labor transfer and ANSP |
| Variables | Coef. | Std. Dev. | Spearman |
|---|---|---|---|
| Number of agricultural laborers | 6.49 | 7.517 | 0.035 |
| Health of the head of household | 6.67 | 9.043 | 0.090* |
| Non-agricultural income ratio | ‒90.08*** | 25.751 | ‒0.116** |
| Are irrigation conditions suitable for cultivated land? | ‒18.87 | 18.635 | ‒0.036 |
| Education of the head of household | 5.88 | 9.777 | 0.036 |
| Age of the head of household | 0.08 | 0.651 | 0.045 |
| Terrain conditions | 29.85*** | 9.618 | 0.155*** |
| Farm size | 0.62 | 1.627 | 0.2669*** |
| Purpose of agricultural production | 80.00*** | 24.711 | 0.037 |
| Is there an agricultural fertilization service organization in or near the villages? | ‒119.81*** | 17.528 | ‒0.309*** |
| Number of times per year participating in agricultural techniques training | ‒3.54 | 20.830 | ‒0.149*** |
| Constant | 35.84 | 57.135 | ‒ |
| Observations | 436 | ‒ | |
| R2 | 0.125 | ‒ | |
| VIF | 1.11 | ‒ | |
Note: ***, ** and * represent 1%, 5% and 10% significance levels, respectively. |
| 1 |
|
| 2 |
|
| 3 |
|
| 4 |
|
| 5 |
|
| 6 |
|
| 7 |
|
| 8 |
|
| 9 |
|
| 10 |
|
| 11 |
|
| 12 |
|
| 13 |
|
| 14 |
|
| 15 |
|
| 16 |
|
| 17 |
|
| 18 |
|
| 19 |
|
| 20 |
|
| 21 |
|
| 22 |
|
| 23 |
|
| 24 |
|
| 25 |
|
| 26 |
|
| 27 |
|
| 28 |
|
| 29 |
|
| 30 |
|
| 31 |
|
| 32 |
|
| 33 |
|
| 34 |
|
| 35 |
|
| 36 |
|
/
| 〈 |
|
〉 |