Human Activities and Ecological Security

Carbon Emission Evaluation in Jinan Western New District based on Multi-source Data Fusion

  • XIAO Huabin ,
  • HE Xinyu ,
  • KUANG Yuanlin ,
  • WU Binglu , *
Expand
  • School of Architecture and Urban Planning, Shandong Jianzhu University, Jinan 250101, China
*WU Binglu, E-mail:

XIAO Huabin, E-mail:

Received date: 2020-10-11

  Accepted date: 2021-02-28

  Online published: 2021-07-30

Supported by

The National Key Research and Development Program of China(2019YFD1100803)

Abstract

Carbon emissions caused by human activities are closely related to the process of urbanization, and urban land utilization, function vitality and traffic systems are three important factors that may influence the emission levels. For clarifying the space structure of a low-carbon eco-city, and combining the concept of “Combining Assessment with Construction” to track and contrast the construction of the low-carbon eco-city, this research selects quantifiable low-carbon eco-city spatial characteristics as indicators, and evaluates and analyzes the potential carbon emissions. Taking the Jinan Western New District as an example, diversity of construction land, travel carbon emission potential, and density and accessibility of adjacent road networks in the overall urban planning were measured. After the completion of the new urban area, the evaluation mainly reflected certain factors, such as the mixed degree of urban functions, the density of urban functions, the walking distance to bus stops and the density and number of bus stops. Dividing the levels and adding equal weights after index normalization, the carbon emission potential is evaluated at the two levels of the overall and fragmented areas. The results show that: (1) The low-carbon emission potential areas in the planning scheme basically reached the planned goals. (2) There is inconsistency between districts and indicators in the planning scheme. The diversity of construction land and the accessibility of the adjacent road network are relatively small; however, there is a large difference between the travel carbon emission potential and the road network accessibility. (3) Carbon emission potential after completion did not reach the planned expectation, and the low-carbon emission potential plots were concentrated in the Changqing Old City Area and Central Area of Dangjia Town Area. (4) The carbon emission indicators varied greatly in different areas, and there were serious imbalances in the density of public transportation lines and the mixed degree of urban functions.

Cite this article

XIAO Huabin , HE Xinyu , KUANG Yuanlin , WU Binglu . Carbon Emission Evaluation in Jinan Western New District based on Multi-source Data Fusion[J]. Journal of Resources and Ecology, 2021 , 12(3) : 346 -357 . DOI: 10.5814/j.issn.1674-764x.2021.03.004

1 Introduction

Under the background of the “greenhouse effect” leading to global climate change and local extreme climate causing frequent disasters, as cities generate greenhouse gas emissions accounting for 80% of global emissions, they face huge pressures on resource shortages and the ecological environment. It is difficult to adapt the urban growth model of extensional growth to the urban development requirements, so it is facing a choice of transformation. The low-carbon model and ecological concept have become the most time-sensitive themes for human sustainable development in the 21st century, and a new development direction to deal with the challenges of climate change, resource constraints and the ecological environment. With the adjustment and evolution of the industrial structure in China's urban development, it is necessary to seek new expansion space to meet the development activities of the new urban areas. As the energy consumption of the secondary and tertiary industries in the new urban area becomes more prominent, the new urban area plays an important role in energy consumption and carbon emissions. Building and transportation energy consumption and its carbon emissions will become the main component affecting China's energy consumption and carbon dioxide emissions. Based on the different spatial structure models of the low-carbon eco-city in China, one key point is to explore the spatial planning approach of the low-carbon eco-city.
The research on “low-carbon cities” now focuses on the evaluation of the low-carbon economy, energy conservation and emissions reduction, and basically covers all levels from policy theory to technical practice. At the theoretical level, the research mainly discusses the concept and connotation of the low-carbon city, and puts forward the development principles and models of low-carbon urbanization in the future (Xin and Zhang, 2008; Zhang et al., 2010). In the aspect of technical practice, this paper studies the related factors of urban carbon emissions and the measurement of carbon emissions in the process of urban development (Wu et al., 2016; Hukkalainen et al., 2017; Huang et al., 2019; Xiao et al., 2020). In 2010, the Chinese Academy of Social Sciences released an evaluation standard system, which plays a guiding and promoting role in the research and application of the low-carbon city evaluation system (Du et al., 2015). As China's economy and society enter a new normal development, Du et al. (2015) believe that the evaluation of low-carbon cities should not only be “Promoting Construction with Evaluation”, but also “Combining Assessment with Construction”, in order to reflect the basic situation of low-carbon city construction and monitor the development trend by means of evaluation to ensure and guide the construction of low-carbon eco-city. At present, low-carbon eco-city evaluation systems that take cities as research units and use non-spatial factors, such as resource consumption and economic development, as quantitative indexes can grasp the overall urban carbon emission potential dynamically (Li et al., 2017; Guo et al., 2018; Shi et al., 2018; Wang et al., 2020). However, these systems are limited by characteristics such as oversized research units and insufficient spatial indicators. It is difficult to guide the construction of a low-carbon eco-city from the level of urban planning scheme design. The environment created by big data brought on by technological development and new data from commercial websites, government departments, and social platforms (Long and Liu, 2017; Xiao et al., 2019; Xiao et al., 2020; Zhu and Niu, 2020), with its advantages of quantification of information, spatialization of attributes, real-time acquisition, and refined granularity (Croitoru et al., 2012; Ye et al., 2014; Xi and Zhen, 2015; Yu et al., 2020), have changed the traditional urban planning research paradigm from the aspects of data sources, research paradigms, and expression of results.
Combining urban spatial open data and the geographic information system support platform, an evaluation index system for urban planning schemes and carbon emissions evaluation is established under the refined scale to express the measurable value and final result of each evaluation index spatially, which can improve the practicality of the results of urban carbon emissions evaluation. This system provides an effective way to guide the planning and construction of a low-carbon eco-city and realize the “Combining Assessment with Construction” goal.

2 Data and methods

2.1 The regional situation

The Jinan Western New District is located in the northwestern part of Jinan City, from the second ring road west road to the east, west and north to the Yellow River, and south to Wufeng Mountain. It covers three administrative areas of Jinan City including Shizhong District, the Huaiyin District and the Changqing District. The total area is about 450 km2, including two new city districts, the West Railway Station Area and the University Science and Technology Park Area, the Jixi Wetland Ecological Zone and the Changqing Old Town, in addition to the urban-rural areas such as Dangjia Town and Gushan Town (Fig. 1).
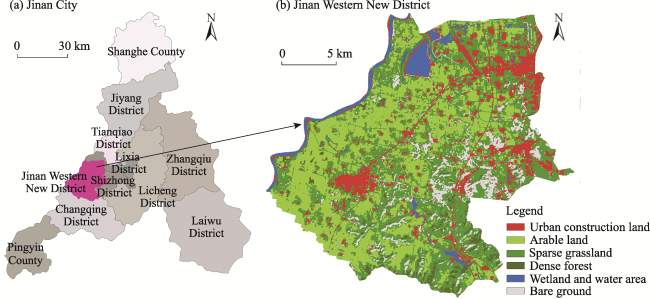
Fig. 1 The location and land use types of the Jinan Western New District
Affected by the topography and the status of construction land usage, Jinan Western New District planning is a multi-core layout, taking the West Railway Station Area, the University Science and Technology Park Area, and Jixi Wetland as the core, for forming business centers, science and education centers, and ecological conservation centers (Fig. 2). The Conceptual Planning of Jinan Western New District puts forward the planning requirements for the construction of the low-carbon eco-city in the following three aspects: improving the spatial energy efficiency of high-density urban built-up areas through mixed land layout and green transportation, reducing the impact of carbon emissions in high-environmentally sensitive areas, and protecting the high-carbon sink natural vegetation and regional ecological quality. Construction concepts are also proposed, such as coordinating the transportation network of Jinan Western New District and Jinan urban area, creating intensive and compact corridors, and encouraging a balanced mixed space layout. There are two main reasons for choosing Jinan Western New District as the research object.
(1) The area has multiple development cores. According to the administrative boundaries and planning requirements of each town, Jinan Western New District can be divided into seven sub-research areas (Fig. 3; Table 1).
Fig. 2 Conceptual planning plan of the Jinan Western New District
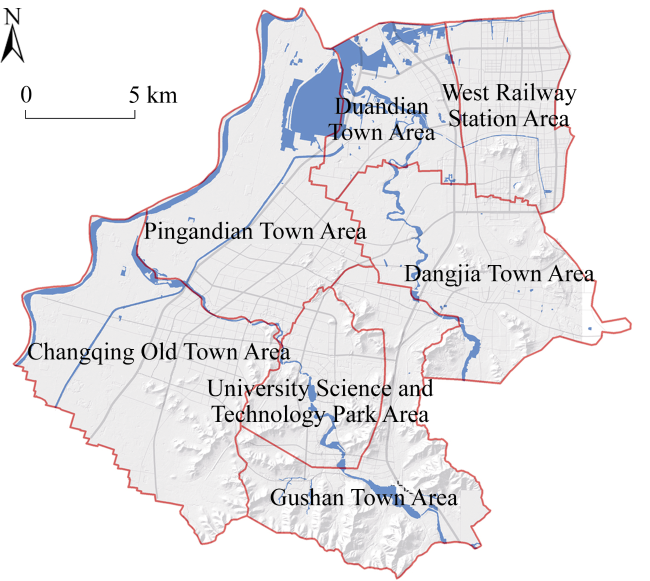
Fig. 3 Sub-district of the Jinan Western New District
Table 1 Overview of the sub-research areas in the Jinan Western New District
The name of areas Acreage (km²) General characteristics
West Railway Station Area 40.81 Construction began in 2009. The core growth pole of Jinan Western New District has both external transportation, residential, and business functions. The planning goal is to create a new Qilu portal, a new commercial port in Quancheng, a new city center and a new cultural highland
Changqing Old Town Area 97.19 Formerly defined as Changqing County, removed in 2001 to set up a district. The road network density in the central area is high, and the buildings are mainly low-rise. It is the most representative old city in the study area
University Science and
Technology Park Area
36.33 Constructed in 2003, in total 12 universities were located in this area until 2017. Based on the “four in one” concept of education, innovation, entrepreneurship, and industry, the plan is to build a first-class domestic and internationally influential ecologically dynamic university city
Dangjia Town Area 71.97 An important industrial cluster in Jinan, above the east-west development axis of one city and two districts proposed in the master plan of Jinan. It is the ecological isolation zone between the main city and the new western city. The southeast has many exposed mountains and the ecological environment is sensitive
Gushan Town Area 68.67 The terrain is dominated by hills, and due to the terrain, the distribution of construction land is scattered. The Jinyun Lake reservoir is located in the middle, and the ecological environment is good. In the latest Jinan City Regulatory Planning Division, it is designated as a university town area together with the University Science and Technology Park Area
Duandian Town Area 39.37 The belt-shaped development along Jingxi Road has developed medical industry, industry and logistics. The current buildings are mainly low-rise and multi-story buildings, and there are many rivers in the area. It is an important water source protection area
Pingandian Town Area 83.66 The belt-shaped development along Jingxi west Road has been affected by the establishment of Jinan Economic Development Zone. In recent years, industrial development has been rapid. The current buildings are mainly low-rise and block-story buildings. The Jixi Wetland is the ecological core of Jinan Western New District, with superior ecological conditions
(2) This area can reflect the process of the new district “from scratch”. Jinan Western New District has undergone 15 years of development and construction. As of 2017, a large number of construction projects with the West Railway Station Area and the University Science and Technology Park Area as the core have basically been implemented in accordance with the planning plan. Therefore, it allows us to compare the current construction situation with the planning expectations to provide countermeasures for planning adjustment.

2.2 Data source

In this study, the road network was used to divide the research unit “lot” and draw the area within reach of the bus station, and for the classification of planning land for measuring the degree of mixed urban planning function coming from the “Conceptual Planning of Jinan Western New District”. As the current (2018) Western New District construction status road grid bureau is basically the same as the planning plan, in order to ensure the comparability of research results, the new district planning plan and the carbon emission potential evaluation after completion use the same road network and research unit. There are 792 basic research units. The POI data required for the measurement of the functional density and functional mixing of the plot after completion in this study are from 11 December 2018 and provided by a well-known domestic map supplier. The acquisition range is the smallest circumscribed square of the study area, with a total of 20870.

2.3 Research methods

In the theme report of the “2009 International Conference on Urban Development and Planning”, the Chinese scholar Qiu proposed firstly the concept of a low-carbon eco-city. In the current literature, low-carbon cities and ecological cities are the main research subjects, with few studies on low-carbon eco-cities. Qiu (2009) believed that the low-carbon eco-city was the embodiment of sustainable development ideas in urban development, the implementation of low-carbon economic development models and ecological development concepts in urban development, and a concentrated expression of sustainable urban development in China with an ideal vision. Shen et al. (2010) found that the low-carbon eco-city belongs to the category of eco-city and was the primary stage in the realization of the eco-city. Their pursuit of an eco-city is carried out from the perspective of reducing carbon emissions. They also proposed that the basic characteristics of a low-carbon eco-city included complexity, diversity, operability, efficiency, recycling, symbiosis and harmony.
High-efficiency spatial structure organization and form, high-efficiency land resource development and utilization, and efficient transportation system planning and management are important spatial planning approaches for achieving a low-carbon orientation (Xiao et al., 2015), and the spatial layout of the low-carbon eco-city is reflected in two aspects.
(1) Land usage layout: The layout of functional centers and public service centers is reasonable, and the functions of urban construction land are mixed.
(2) Traffic layout: The density of the road network meets the needs of low-carbon travel, and the layout of public transportation stations is reasonable and provides wide coverage.
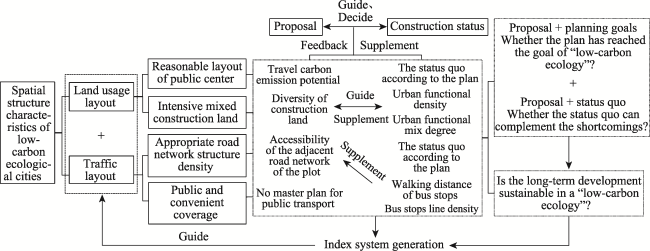
Fig. 4 Construction of the evaluation index of carbon emission in the Urban New District
2.3.1 Research framework
The evaluation system of the carbon emission potential of Jinan Western New District selects the spatial characteristics of the low-carbon eco-city as indicators to evaluate Jinan Western New District from the two aspects of land use and transportation (Fig. 4). It is found that the overall planning is basically consistent with the current land usage layout and road structure, but lacks the elements such as public transportation and functional formats. The combination of these could be used to evaluate the current situation and the future potential of low-carbon development in Jinan Western New District comprehensively. The carbon emission evaluation system of the new urban area, using the smallest land enclosed by urban roads (hereinafter referred to as “land”) as the research units and selecting relevant factors from the land usage layout and traffic layout, is used to study the urban master plan. With respect to the overall urban planning evolution, there are indicators of diversity of construction land, travel carbon emission potential, accessibility of the adjacent road network and road network density around the plot. After the completion of the new urban area, the evaluation is mainly reflected in factors such as walking distance to bus stops, bus stop line density, urban functional density and urban functional mixing degree. These indicators are easy to obtain and universal, and the larger the value of an indicator measurement result, the lower the potentiality carbon emission level.
The evaluation system is based on the following assumptions:
(1) The natural and social conditions of similar land in cities have a nearly homogeneous distribution.
(2) There are no obvious differences in population or class between residents' demand and consumption.
(3) Residents choose the nearest service facilities when obtaining various types of services, and there are no differences in scale or quality between them.
(4) Similar road conditions and speed limits.
2.3.2 Evaluation index of carbon emission potential for the Urban New District Planning
(1) Diversity of construction land
According to the “Standard for Urban Land Classification and Planning and Construction Land (GB50137-2011)”, different types of urban development land are considered as patches of different scales and types. Shannon's diversity index (SHDI) of each plot was applied for characterizing the diversity of urban planning functions. The larger the measured value, the higher the functional diversity of the plot and the lower the potential carbon emissions. The formula is as follows (Wu, 2000):
$SHD{{I}_{i}}=\sum\limits_{k=1}^{n}{(Pik\times \ln Pik})$
where, SHDIi is the Shannon's diversity index of section i; and Pik is the proportion of the k-type patches in section i to the total landscape district.
(2) Travel carbon emission potential
The potentiality for carbon emission was expressed by the shortest travel distance from each block to the nearest public center. According to the plan, ArcGIS was used to construct the OD matrix of each block to its nearest public center, and the shortest travel distance from each block to the nearest public center was estimated (Cao et al., 2015; Yang et al., 2015; Ouyang and Huang, 2018; Ramli et al., 2020). The smaller the value, the lower the carbon emission potential of travel, so it is a negative indicator.
(3) Accessibility of the adjacent road network of the plot
Accessibility was analyzed by the Mean Euclidean Distance (MED) from any location in the study area to the measured section. The plug-in sDNA in ArcGIS was used to build a road network model and measure the MED value of each road section. The larger the value, the lower the accessibility, and the higher the carbon emission potential of the plot, so it is a negative indicator.
(4) Road network density around the plot
This was expressed by the density of the adjacent road network of the plot, and the density of road intersections within 1 km of the plot. According to the ratio of the number of intersections around each block to its own area, the larger the value, the higher the density of the road network, and the more conditions for building a low-carbon pedestrian community, so it is a positive indicator.
2.3.3 Evaluation index of carbon emission potential after completion
(1) Walking distance to bus stops
This was used to express the walking convenience of the bus stops of the land parcel with the proportion of the public in the walking reachable area. The ArcGIS network analysis function was used to draw 5 min, 10 min, and 15 min walking reachable areas centered on bus stops, which showed different weights. The carbon emission potential of the new area was evaluated based on the proportion of accessible domains within the plot (Buczkowska et al., 2019). The larger the value, the lower the carbon emission potential of residents' travel, so it is a positive indicator.
(2) Bus stop line density
The bus stop density was represented by the number of bus lines passing through the station to express the convenience of public transit. Based on ArcGIS, the number of bus stops was used to calculate the ratio of the number of bus stops to the land area within 1 km of each block. The larger the calculated value, the higher the convenience of travel and the smaller the carbon emission potential, so it is a positive indicator.
(3) Urban functional density
The urban functional density was expressed by the density of Points of Interest (POI). Obtained data were used to calculate the ratio of the total amount of various POIs within the plot to its own area (Li et al., 2019). The larger the result, the larger the functional density, the more convenient for residents to obtain urban services, and the lower the carbon emission potential, so it is a positive indicator.
(4) Urban functional mix degree
The POIs are divided into categories such as residence, catering, shopping, industry, and medical according to their own attributes. The degree of mixing calculated by information entropy was used to indicate the degree of the internal functional mixture of the plot. The larger the value, the more POI categories and lower carbon emission potential. The formula is as follows (Hao et al., 2016):
$D=({{P}_{i}}\times \ln {{P}_{i}})\begin{matrix} {} & {} \\ \end{matrix}(i=1\text{,}\ 2\text{,}\ ...\text{,}\ n)$
where, D is the functional mixing degree of the plot; Pi is the proportion of a certain type of POI to the total number; and n is the number of POI categories.
2.3.4 Index normalization and hierarchical division
In order to eliminate the influence of the different dimensions of each index, the Min-Max method is used to carry out the negative index positive processing and standardization of the calculation, so that the final result ranges from 0 to 1. For positive indicators, the formula is as follows:
${{X}^{*}}=\frac{X-\min }{\max -\min }$
For negative indicators, the formula is:
${{X}^{*}}=\frac{\max -X}{\max -\min }$
where, X* is the normalized measurement value of an indicator; X is the original measurement value; max is the maximum measurement value of an indicator in all plots, and min is the minimum.
Based on the normalization of the measurement results, the natural discontinuity classification method was used to identify discontinuities with large differences in data values, and the study area was divided into the following five levels: “lower carbon emission potentiality”, “low carbon emission potentiality”, “moderate carbon emission potentiality”, “high carbon emission potentiality” and “higher carbon emission potentiality”.

3 Results and analysis

The first step was to measure the diversity of land usage in the construction plan of Jinan Western New District, the carbon emission potential of the public center, the road network accessibility of the block, and the density of the road network around the block. Next, the levels were divided, equal weights were added after index normalization, and then the carbon emission potential was evaluated from the two levels of the overall and fragmented areas. On the basis of visual indicators and normalized results, the measurement results of each area were calculated, which returned the radar chart. The land with urban construction land in the “Conceptual Planning of Jinan Western New District” was used to calculate the carbon emission potentiality.

3.1 Assessment on carbon emission potentiality of the planning scheme in the Jinan Western New District

3.1.1 The low carbon emission potentiality basically reached the planned goals
The evaluation results (Figs. 5 and 6) showed that the low and lower carbon emission potentiality plots were concentrated in the two densely populated areas, the West Railway Station Area and the Changqing Old City Area, followed by the Dangjia Town Area, while the University Science and Technology Park Area showed higher carbon emission potentiality, and the remaining areas showed high carbon emission potentiality. The area with the highest carbon emission potentiality is the Gushan Town Area. In the West Railway Station Area, the high-functional mixture and road network density planning layout meet the concepts of “balanced functional mixed space layout” and “green and low-carbon travel” proposed in the “Guidelines for Urban Design of the Core Area of Jinan West Railway Station Area”. The measurement results, based on the higher and high-carbon emission potential plots in the University Science and Technology Park Area, make it difficult to achieve the goals of “open education parks and innovative research and development bases” and “low-density residential areas and recreational areas” proposed in “Regulatory Planning of Jinan University Science and Technology Park Area”, so they need to be optimized.
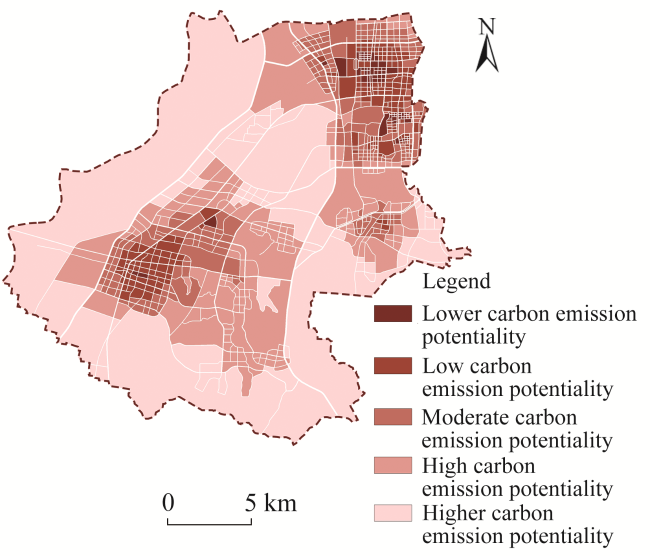
Fig. 5 Spatial pattern of carbon emissions potential in the planning of the Jinan Western New District
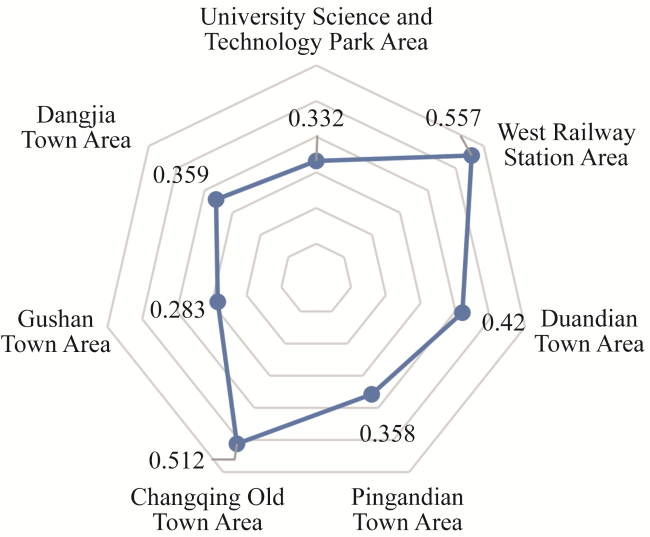
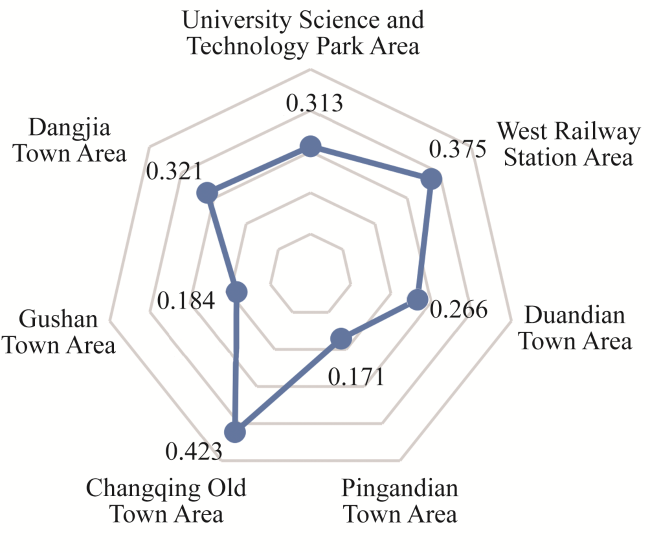
Fig. 6 Regional average of carbon emissions potential in the planning of the Jinan Western New District
3.1.2 Comparison of districts: Inconsistency between districts and indicators
According to the measurement results (Figs. 7-8), the Changqing Old City Area is the best in the following three aspects: travel carbon emission potential, construction land diversity and accessibility of the adjacent road networks. Due to the highest density of the road network, the West Railway Station Area has the most potential for building a low-carbon ecological community. As affected by the terrain and campus area, the University Science and Technology Park Area had low road network density and accessibility, which was not conducive to pedestrian travel. However, because the internal planning includes public service centers for colleges and universities, the measurement results were better than the average. The four indicators of Gushan Town Area showed the lowest measurement scores, and the residential land planned within the scope has carries the risk of residents' inconvenience for residents to travel and large carbon emissions from daily transportation. According to the discrete coefficient formula, the dimensionless values of the measurement results are from 0 to 1, with smaller means. In other words, the smaller the mean, the more obvious the difference between the plots of the index measurement result. Comparing the four indicators, the diversity of construction land and the accessibility of the adjacent road network of Jinan Western New District are relatively small; however, there is a large difference between the travel carbon emission potential and the road network accessibility. Therefore, it is necessary to expand the public service centers and optimize the road layout.
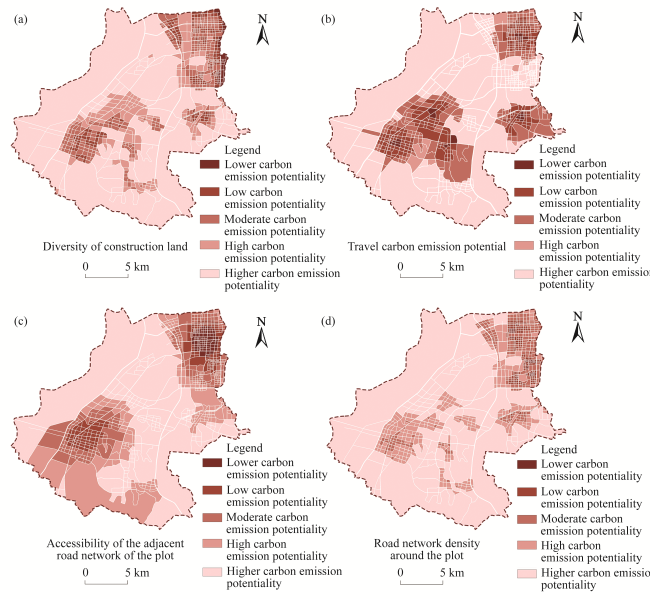
Fig. 7 Spatial patterns of the single-factor measurements of carbon emission potential of the planning schemes in the Jinan Western New District
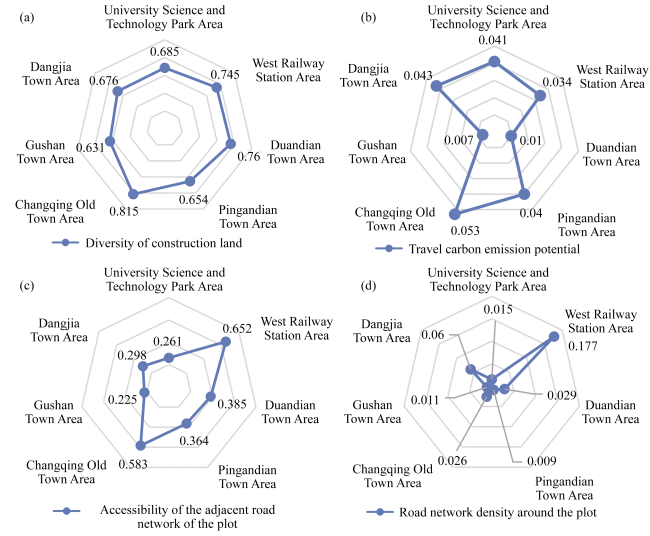
Fig. 8 Regional averages of single-factor measurements of carbon emission potential of the planning scheme in the Jinan Western New District

3.2 Carbon emission potentiality assessment after the construction of the Jinan Western New District

3.2.1 Carbon emission potentiality expectation after the construction
The analysis of the spatial pattern of carbon emission potentiality (Fig. 9) and the average carbon emission potentiality of the seven research areas (Fig. 10) revealed that low- carbon emission potential plots were concentrated in the old urban areas, including Changqing Old City Area and the Central Area of Dangjia Town Area. In the West Railway Station Area, there were many land areas with low and moderate carbon emission potentiality, which had not reached the expected goal. The University Science and Technology Park Area, Gushan Town Area, Ping'andian Town Area and other area planning plans showed higher carbon emission potentials. After the implementation of the plan, except for the University Science and Technology Park Area, the overall carbon emission potential was still high. Therefore, when introducing the industrial population and expanding the city scale, it is necessary to carry out low-carbon space shape design and urban function layout based on the existing planning.
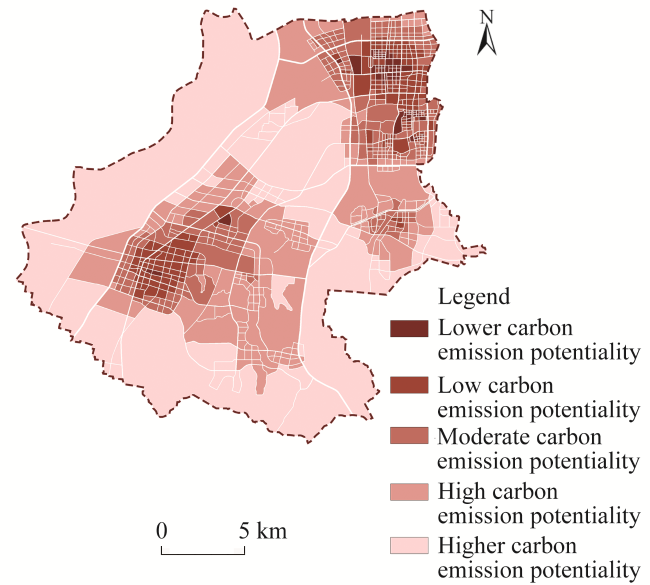
Fig. 9 The spatial pattern of carbon emission potential after the completion of the Jinan Western New District
Fig. 10 The average carbon emission potential after the completion of the Jinan Western New District
3.2.2 Comparisons of different areas
According to the results, there is a serious imbalance in the density of public transportation lines and the mixed degree of urban functions (Figs. 11-12). In terms of convenience of public transportation, the Dangjia Town Area and the West Railway Station Area have high public transport convenience due to the high density of public transportation lines and the high reach of bus stations, respectively. However, the University Science and Technology Park Area and Ping'andian Town Area are less convenient due to fewer roads. The area covered by public transportation on foot in Gushan Town Area was small, and public transport was inconvenient. Therefore, it is difficult to meet the needs of urban low-carbon ecological development. In terms of urban functions, compared with the new urban area, the old urban area represented by the Chanagqing Old City Area has obvious advantages in terms of functional density and mixed functions, and the average values of both indicators are the highest. The University Science and Technology Park Area, which focuses on scientific, educational and cultural functions, has a high urban function density, but low mixing degree, which is not conducive to residents' access to various services. The West Railway Station Area, which was built in 2010, has not fulfilled the requirements for building a “functional mixed space” in the planning concept because of the short use time and incomplete functions.
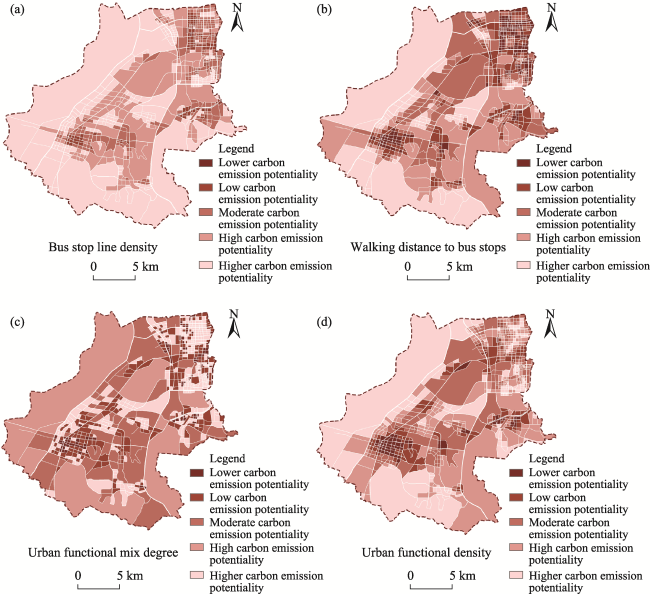
Fig. 11 Spatial patterns of single-factor measurements of carbon emission potential after the completion of the Jinan Western New District
Fig. 12 Regional averages of single-factor measurements of carbon emission potential after the completion of the Jinan Western New District

3.3 Urban core area planning strategy

Based on the conceptual planning of the Jinan Western New District, the planning plan and the evaluation of carbon emission potential after construction, it is found that the West Railway Station Area and University Science and Technology Park Area still have much room for optimization in planning, implementation degree and effect. Comparing the evaluation results, the following urban low-carbon space planning guidance strategies are proposed for the West Railway Station Area and the University Science and Technology Park Area.
3.3.1 The West Railway Station Area
As the core growth pole of Jinan Western New District, the West Railway Station Area has the most abundant land types in the conceptual planning plan. The layout of urban roads with high-density small-scale blocks is conducive to connecting external traffic and local users' walking travel, and therefore to building a low-carbon eco-city. To improve on the current situation, it is necessary to increase the quantity of traffic lines to improve the evacuation capacity of public transportation, such as establishing a transportation system internally and building a Bus Rapid Transit (BRT) connected to the main urban area of Jinan externally. Further recommendations would be to introduce multiple urban functions based on the nature of multiple types of land use, increase functional density and diversity, shorten the distance traveled by urban residents to obtain various urban functions, and improve the frequency of slow traffic.
3.3.2 The University Science and Technology Park Area
For the University Science and Technology Park Area, as a science and education center in Jinan Western New District, the contradiction is mainly reflected in the following aspects. The large campus area makes it difficult to adapt the street length to the walking scale and leads to the contradiction between the large demand for public transportation and the insufficient public transportation coverage. Both the planning scheme and the implementation stage showed high carbon emission potentiality, and it is difficult to meet the needs of introducing scientific research industries and ecological residential areas. In areas where education and residences are predominant, the density of public transportation stations and lines should be increased to meet the travel needs of colleges and communities. At the same time, new urban functions are introduced to achieve a mixed and balanced layout and shorten the travel distance of users. For the unbuilt areas, a tight urban layout should be built with fast public transportation as the framework for achieving the development goal of a low-carbon eco-city guided by public transport and slow traffic.

4 Discussion

In the current study, carbon emissions measurement focuses on urban energy consumption and transportation. In terms of energy consumption, some researchers use different models to measure the total amount of urban carbon emissions, referring to the IPCC carbon emissions list. For transportation carbon emissions, relevant scholars use other discipline models, such as LMDI and DSCG, to simulate and measure urban transportation carbon emissions, or establish urban low-carbon travel pattern index based on ArcGIS network analysis platform. However, with the economic development has entered a new stage, although non-spatial indicators, such as resource consumption and economy development, can reveal the overall city of carbon emissions potential, there are some shortcomings, such as the large scale of the research unit and the lack of spatial indicators. It is difficult to guide the planning and construction of low-carbon eco-city from the level of urban planning and design. Therefore, based on the relevant research results, this study puts forward the characteristics of low-carbon eco-city planning. In addition, the quantifiable spatial characteristics indicators, such as diversity of construction land, accessibility of the adjacent road network of the plot, walking distance to bus stops, urban functional density and so on, were used to evaluate the carbon emissions of Jinan Western New District from the land use layout and traffic layout.
At present, the construction of a low-carbon eco-city in China is still in the primary stage, and the lack of abundant theories and practices is the main problem in low-carbon eco-city research. The construction and evaluation of the low-carbon eco-city in the future should be improved from the aspects of unit scale, data acquisition and measurement model. In the aspect of evaluation theory, the standardized evaluation system of low-carbon eco-city construction is explored by summarizing the low-carbon eco-city construction standards of different countries and regions. On the practical level, according to the development path and spatial structure of different areas, the low-carbon eco-city evaluation system is constructed by selecting indicators with strong representational significance for “low-carbon” and “development” from various aspects, such as economy, environment, science and technology and society. At the same time, based on small-scale spatial units, further research should be undertaken to extract the results of spatial research and optimization strategies as planning indicators, and connect the current urban and rural planning system from the detailed planning level for practical application.

5 Conclusions

The concept of “Combining Assessment with Construction” holds that construction is the foundation and process of development, and evaluation is an effective means and an important guarantee for the construction and management of a low-carbon eco-city. The evaluation system combining construction and evaluation can promote the construction and development of a low-carbon eco-city. This research investigates the status quo of the urban new area and formulates the construction target and corresponding planning scheme to scientifically predict the prospect and mode of the low-carbon eco-city development in the future. Secondly, by evaluating the implementation of the planning scheme, the feasibility and final results of the program are clearly defined. This is followed by the evaluation of the development status and construction effect after the completion of the plan. By comparing the results of the planning scheme with those after the completion of the planning, the deviations between the urban construction and the planning goals can be revealed, and the formulation and implementation of the low-carbon eco-city planning scheme in the future can also be pointed out. The comparison shows that the future low-carbon eco-city construction should be planned according to the current situation and development mode of the city. In an area with abundant land types, it is advisable to increase the quantity of traffic lines and establish a transportation system internally, so as to improve the evacuation capacity of public transportation. For this area, the layout of urban roads with high-density small-scale blocks is conducive to promoting local users' walking travel. In the area with a single urban function, the planning goal of the low-carbon eco-city guided by public transport and slow traffic can be achieved by increasing the density of public transportation stations and introducing new urban functions. Although this study is carried out in Jinan, the characteristics and indicators of low-carbon eco-city come from the relevant research results at home and abroad. Therefore, the research framework can be widely applied to other cities, and the results of this study can also provide a reference for others similar to Jinan Western New District.
1
Buczkowska S, Coulombel N, de Lapparent M . 2019. A comparison of euclidean distance, travel times, and network distances in location choice mixture models. Networks and Spatial Economics, 19(4): 1215-1248.

DOI

2
Cao X S, Yang W Y, Huang X Y . 2015. Aaccessibility and CO2 emissions from travel of smart transportation: Theory and empirical studies. Progress in Geography, 34(4):418-429. (in Chinese)

3
Croitoru A, Stefanidis A, Radzikowski J , et al. 2012. Towards a collaborative geosocial analysis workbench. Washington DC, USA: ACM Press.

4
Du D, Zhuang G Y, Xie H S . 2015. Study on the evaluation of low carbon cities from “promoting construction by evaluation” to “the combination of evaluation and construction”. Urban Development Studies, 22(11):7-11. (in Chinese)

5
Guo H X, Yang C M, Liu X , et al. 2018. Simulation evaluation of urban low-carbon competitiveness of cities within Wuhan City circle in China. Sustainable Cities and Society, 42:688-701.

DOI

6
Hao X H, Long Y, Shi M , et al. 2016. Street vibrancy of Beijing: Measurement, impact factors and design implication. Shanghai Urban Planning Review, (3):37-45. (in Chinese)

7
Huang Y S, Shen L, Liu H . 2019. Grey relational analysis, principal component analysis and forecasting of carbon emissions based on long short-term memory in China. Journal of Cleaner Production, 209:415-423.

DOI

8
Hukkalainen Née Sepponen M, Virtanen M, Paiho S , et al. 2017. Energy planning of low carbon urban areas Examples from Finland. Sustainable Cities and Society, 35:715-728.

DOI

9
Li Y Y, Xian Y N, Yin C X . 2017. Research on evaluation model of low carbon development: A case study of four municipalities in China. Ecological Economy, 33(12):46-51. (in Chinese)

10
Li Z Q, Zheng J, Zhang Y K . 2019. Study on the layout of 15-minute community-life circle in third-tier cities based on POI: Baoding City of Hebei Province. Engineering, 11(9):592-603.

DOI

11
Long Y, Liu L L . 2017. Four transformations of Chinese quantitative urban research in the new data environment. Urban Planning International, 32(1):64-73. (in Chinese)

DOI

12
Ouyang L Q, Huang D . 2018. An activity-based model for the estimation of origin-destination matrix on road networks. Technical Gazette, 25(5):1530-1537.

13
Qiu B X . 2009. The transformation trends of urban development model in China—Low carbon eco-city. Urban Development Studies, ( 8):1-6. (in Chinese)

14
Ramli M I, Runtulalo D, Yatmar H , et al. 2020. An estimation of origin-destination matrices for a public transport network in Makassar using macrosimulation visum. IOP Conference Series: Materials Science and Engineering, 875:012027. DOI: 10.1088/1757-899X/875/1/012027.

DOI

15
Shen Q J, An C, Liu C S . 2010. A discussion on the connotation, characteristics, and basic principles of of the low carbon eco-city planning/construction. Urban Planning Forum, ( 5):48-57. (in Chinese)

16
Shi R, Wang X, Gao J T , et al. 2018. Evaluation of low-carbon economy development level in Harbin. IOP Conference Series: Materials Science and Engineering, 394:052080. DOI: 10.1088/1757-899X/394/5/052080.

DOI

17
Wang Y J, Lan Q X, Jiang F , et al. 2020. Construction of China’s low-carbon competitiveness evaluation system: A study based on provincial cross-section data. International Journal of Climate Change Strategies and Management, 12(1):74-91.

DOI

18
Wu J G. 2000. Landscape ecology pattern, process, scale and hierarchy. Beijing, China: Higher Education Press. (in Chinese)

19
Wu J S, Xu N, Zhang X W . 2016. Evaluation of low-carbon city and spatial pattern analysis in China. Progress in Geography, 35(2):204-213. (in Chinese)

20
Xi G L, Zhen F . 2015. Processes or results?—The exploration of the urban plan innovation supported by big data. Modern Urban Research, 30(1):19-23. (in Chinese)

21
Xiao H B, Sheng S, An Q , et al. 2019. Research on the identification of urban green infrastructure supply-demand spatial differentiation and optimization strategies: A case study on Jinan West New District. Chinese Landscape Architecture, ( 11):65-69. (in Chinese)

22
Xiao H B, Sheng S, Liu J . 2015. The review and prospect on the research of spatial planning of low carbon eco-city. Urban Development Studies, 22(12):8-12. (in Chinese)

23
Xiao H B, Sheng S, Ren Z , et al. 2020. Does the culture service supply of green spaces match the demand of residents in a new district? A perspective from China. Polish Journal of Environmental Studies, 29(5):3395-3407.

DOI

24
Xin Z P, Zhang Y T . 2008. Low carbon economy and low carbon city. Urban Development Studies, 15(4):98-102. (in Chinese)

25
Yang W Y, Li T, Cao X S . 2015. The spatial pattern of Community Travel Low Carbon Index (CTLCI) and spatial heterogeneity of the relationship between CTLCI and influencing factors in Guangzhou. Geographical Research, 34(8):1471-1480. (in Chinese)

26
Ye Y, Wei Z C, Wang H J . 2014. Urban planning response for big data development. Planners, 30(8):5-11. (in Chinese)

27
Yu W, Wang T, Xiao Y J , et al. 2020. A carbon emission measurement method for individual travel based on transportation big data: The case of Nanjing Metro. International Journal of Environmental Research and Public Health, 17(16):5957. DOI: 10.3390/ijerph17165957.

DOI

28
Zhang Q, Ye X P, Chen G W . 2010. Low-carbon urban planning: A new vision. City Planning Review, 34(2):13-18, 41. (in Chinese)

29
Zhu J, Niu X Y . 2020. Jobs-housing balance, land use mix and relationships with commuting distance: A study of Nanning City based on cellphone signaling data. Modern Urban Research,( 2): 98- 105, 116. (in Chinese)

Outlines

/