
Journal of Resources and Ecology >
Effects of Grazing on the Grassland Vegetation Community Characteristics in Inner Mongolia
|
GUO Caiyun, E-mail: guocy.17b@igsnrr.ac.cn |
Received date: 2020-08-31
Accepted date: 2021-02-24
Online published: 2021-07-30
Supported by
The National Key Research and Development Program of China(2017YFA0604803)
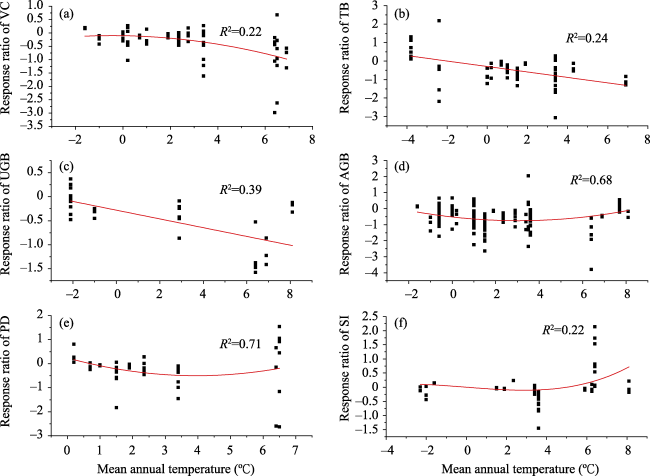
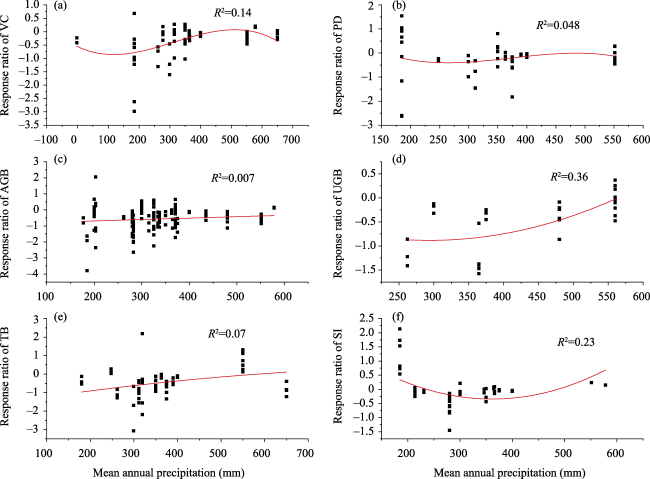
The continuous increase of livestock production in Inner Mongolia has caused severe degradation of the grassland ecosystems in recent years. Previous grazing experiments have shown a wide range of vegetation responses between the biome types on a global scale, but there is still a lack of sufficient studies to discern the relative responses of a given biome type. We conducted a meta-analysis of vegetation coverage (VC), plant density (PD), total biomass (TB), above-ground biomass (AGB), under-ground biomass (UGB) and Shannon-Weaver Index (SI) in different grassland types in Inner Mongolia obtained under conditions of different grazing intensities and durations. The results showed that grazing decreased VC, TB, AGB, UGB, and PD significantly. Compared to the global and national average values, the negative effects of grazing to steppe biomass in Inner Mongolia were higher than that on the global scale, while less pronounced than that in China. TB of the meadow steppe in Inner Mongolia increased by 40% under moderate grazing intensity and duration because of compensatory growth. SI of the desert and meadow steppe showed negative linear relationships with the grazing intensity in Inner Mongolia. The percentage changes in AGB, PD, and SI to grazing showed quadratic relationships with the mean annual temperature of the experimental year. With increasing mean annual precipitation, the negative effects of grazing on UGB and SI first decreased and then increased, with that of VC and grazing showing a cubic relationship.
GUO Caiyun , ZHAO Dongsheng , ZHENG Du , ZHU Yu . Effects of Grazing on the Grassland Vegetation Community Characteristics in Inner Mongolia[J]. Journal of Resources and Ecology, 2021 , 12(3) : 319 -331 . DOI: 10.5814/j.issn.1674-764x.2021.03.002
Fig. 1 The flow diagram for identifying the studies to include in the meta-analysis |
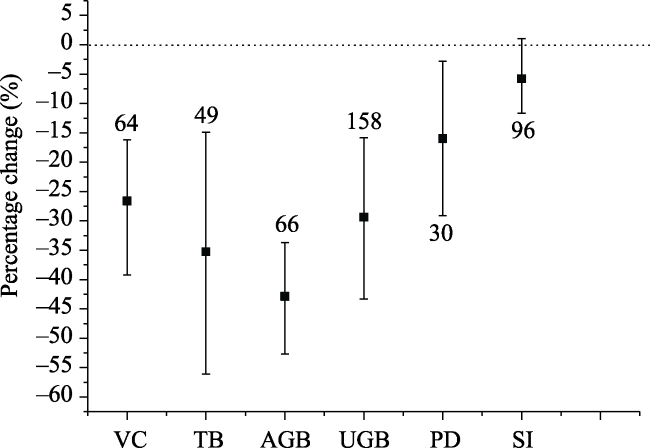
Fig. 2 Percentage changes of vegetation community characteristics in response to grazing in Inner MongoliaNote: Vegetation coverage (VC), total biomass (TB), above-ground biomass (AGB), under-ground biomass (UGB), plant density (PD), and the SI were included in the meta-analysis. Error bars indicate 95% confidence intervals (CIs). A significant effect is indicated if the 95% CI does not overlap zero. The numbers above or below the error bars show the number of observations used in the analysis of each characteristic. |
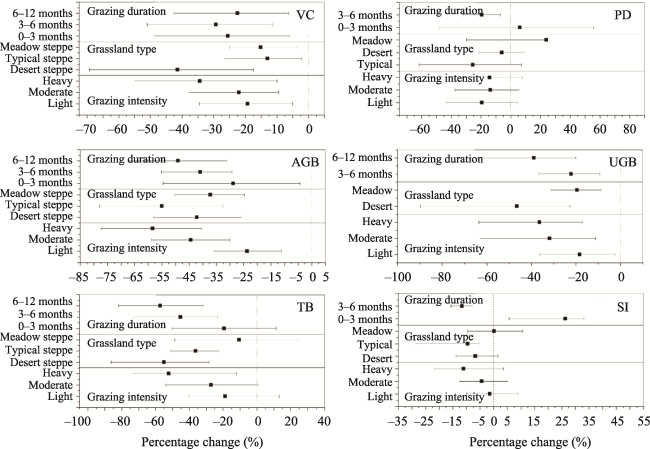
Fig. 3 Percentage changes of vegetation community characteristics due to differing grazing intensity, grazing duration, and grassland type.Note: Values are means ± 95% CI. |
Table 1 Between-group heterogeneity (QB) and probability (P) for grazing effects on VC, PD, TB, AGB, UGB, and SI among different grazing intensities, grassland types, and grazing durations. |
| Subgroup | Category | QB | P |
|---|---|---|---|
| Grazing intensity | VC | 5.6528 | 0.338 |
| PD | 0.4744 | 0.896 | |
| TB | 2.9992 | 0.085 | |
| AGB | 68.0871 | 0.001 | |
| UGB | 4.6779 | 0.344 | |
| SI | 5.9352 | 0.413 | |
| Grassland type | VC | 25.3576 | 0.009 |
| PD | 5.8753 | 0.275 | |
| TB | 5.1752 | 0.022 | |
| AGB | 12.3124 | 0.061 | |
| UGB | 18.8179 | 0.005 | |
| SI | 2.4998 | 0.723 | |
| Grazing duration | VC | 0.9955 | 0.834 |
| PD | 5.2990 | 0.148 | |
| TB | 2.8244 | 0.106 | |
| AGB | 9.7965 | 0.085 | |
| UGB | 7.4774 | 0.085 | |
| SI | 72.7619 | 0.001 |
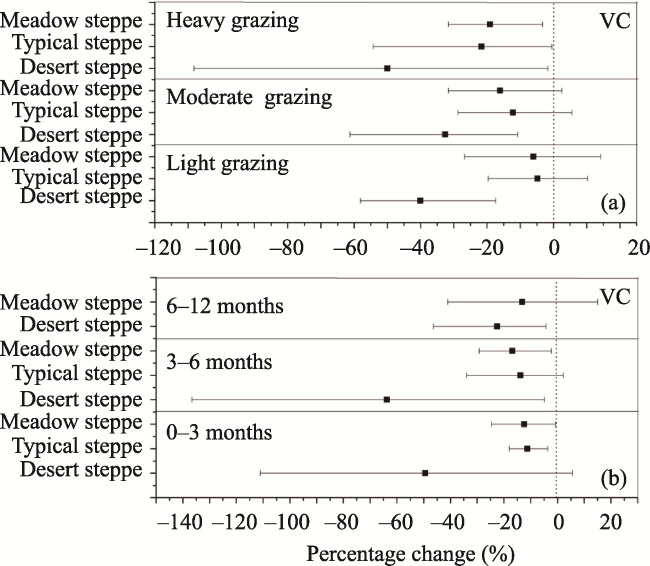
Fig. 4 Percentage changes of VC in response to different grazing intensities (a) and grazing durations (b) |
Fig. 5 Percentage changes of TB in response to different grazing intensities (a) and grazing durations (b) |
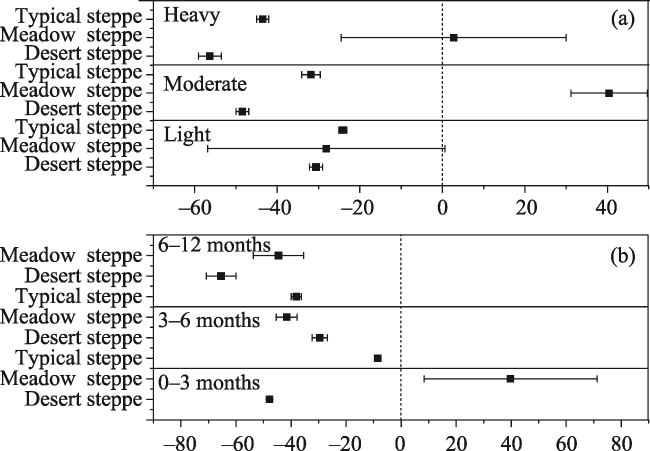
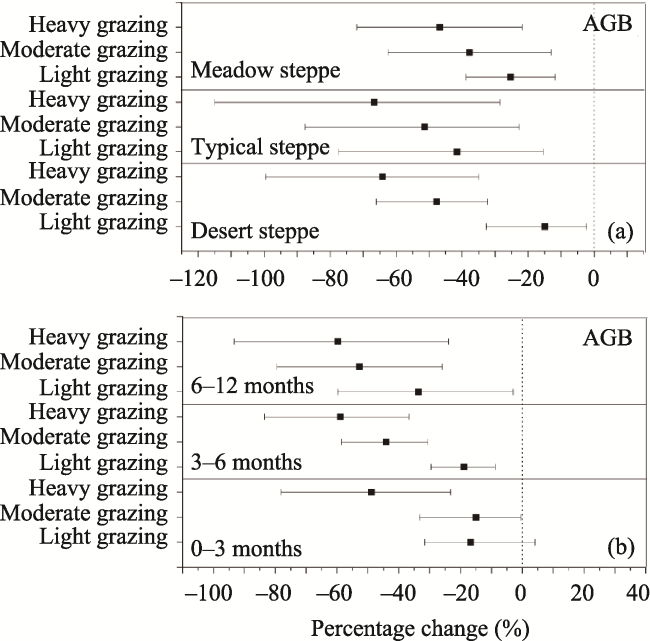
Fig. 6 Percentage changes of AGB in response to differing grazing durations (a) and grassland types (b) |
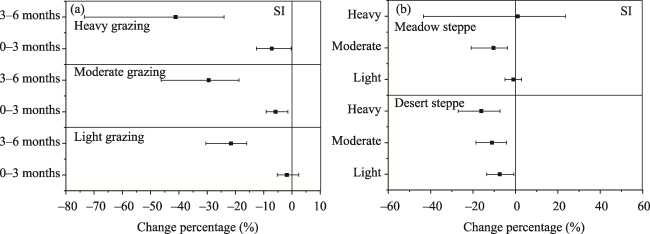
Fig. 7 Percentage changes in the SI caused by differing grazing durations (a) and grassland types (b) |
Table 2 Percentage changes in grazing effects globally, in China, and in Inner Mongolia |
| Spatial scale | Global (%) | China (%) | Inner Mongolia (%) |
|---|---|---|---|
| Milchunas and Lauenroth, 1993 | Yan et al., 2013 | This study | |
| TB | No significant effect | -58.34 | -45.12 |
| AGB | -23 | -42.77 | -35.04 |
| UGB | 20 | -23.13 | -13.85 |
Fig. 8 Response ratios of VC (a), TB (b), UGB (c), AGB (d), PD (e), and SI (f) relative to mean annual temperature of experimental year. |
Fig. 9 Response ratios of VC (a), PD (b), AGB (c), UGB (d), TB (e), and SI (f) relative to mean annual precipitation of the experimental year. |
Fig. 10 Bubble plots of the meta-regression results between the responses of TB to the SI reductionNote: The size of each bubble is the relative weight of the effect size (response ratio, ln R) in the meta-regression. Larger bubbles indicate study outcomes that contributed a greater overall weight in the meta-regressions. |
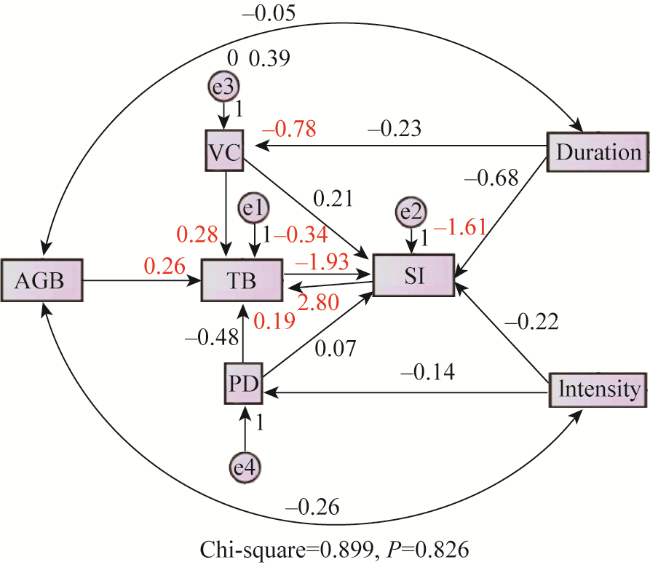
Fig. 11 Structure equation modeling examining the direct and indirect effects on vegetation community characteristics of grasslands in Inner Mongolia (n = 159)Note: Double-headed arrows represent covariance between related variables. Single-headed arrows indicate the hypothesized direction of causation. The numbers in red adjacent to arrows are standardized path coefficients. |
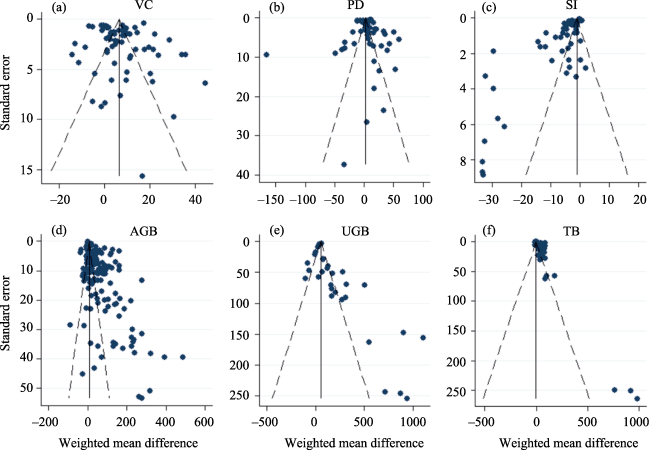
Fig. 12 Funnel plots of VC (a), PD (b), SI (c), AGB (d), UGB (e), and TGB (f) used for assessing publication bias in this study. |
| 1 |
|
| 2 |
|
| 3 |
|
| 4 |
|
| 5 |
|
| 6 |
|
| 7 |
|
| 8 |
|
| 9 |
|
| 10 |
|
| 11 |
|
| 12 |
|
| 13 |
|
| 14 |
|
| 15 |
|
| 16 |
|
| 17 |
|
| 18 |
|
| 19 |
|
| 20 |
|
| 21 |
|
| 22 |
|
| 23 |
|
| 24 |
|
| 25 |
|
| 26 |
GB/T 34754-2017 B/T 34754-2017. 2017. Grade of grazing intensity on rangeland for the household ranch. Beijing, China: China Academic Journal Electronic Publishing House. (in Chinese)
|
| 27 |
|
| 28 |
|
| 29 |
|
| 30 |
|
| 31 |
|
| 32 |
|
| 33 |
|
| 34 |
IPCC. 2013. Working Group I Contribution to the IPCC Fifth Assessment Report, Climate Change 2013: The Physical Science Basis: Summary for Policy makers. Cambridge, UK: Cambridge University Press.
|
| 35 |
|
| 36 |
|
| 37 |
|
| 38 |
|
| 39 |
|
| 40 |
|
| 41 |
|
| 42 |
|
| 43 |
|
| 44 |
|
| 45 |
|
| 46 |
|
| 47 |
|
| 48 |
|
| 49 |
|
| 50 |
|
| 51 |
|
| 52 |
|
| 53 |
|
| 54 |
|
| 55 |
|
| 56 |
|
| 57 |
|
| 58 |
|
| 59 |
|
| 60 |
|
| 61 |
|
| 62 |
|
| 63 |
|
| 64 |
|
| 65 |
|
| 66 |
|
| 67 |
|
| 68 |
|
| 69 |
|
| 70 |
|
| 71 |
|
| 72 |
|
| 73 |
|
| 74 |
|
| 75 |
|
| 76 |
|
| 77 |
|
| 78 |
|
| 79 |
|
| 80 |
|
/
| 〈 |
|
〉 |

