
Journal of Resources and Ecology >
The Bowen Ratio of an Alpine Grassland in Three-River Headwaters, Qinghai-Tibet Plateau, from 2001 to 2018
|
ZHAO Xuanlan, E-mail: zhaoxl.17s@igsnrr.ac.cn |
Received date: 2020-08-02
Accepted date: 2020-10-20
Online published: 2021-07-30
Supported by
The National Key Basic Research and Development Program(2017YFC0503803)
The National Natural Science Foundation of China(31971507)
Qinghai Province Science and Technology Program(2018-ZJ-T09)
CAS-Qinghai Province Joint Program on Three-River Headwaters National Park(YHZX-2020-07)
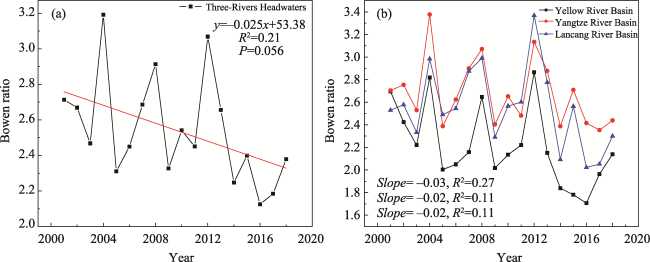
The Bowen ratio (β) is used to quantify heat transfer from the land surface into the air, which is becoming a hot topic in research on the biogeophysical effects of land use and cover changes. The Three-River Headwaters (TRH), as a sensitive and fragile region, was selected as the study area. The β for 2001-2018 was estimated from the evapotranspiration product (ETMOD16) of MODIS and the net radiation of the land surface through the albedo from GLASS. The ETMOD16 data were evaluated against the observation data (ETOBS) at two alpine grassland flux towers obtained from ChinaFLUX. The interannual trend of the β was analyzed by multiple linear regression (MLR) and structure model (SEM) with the multiple factors of precipitation, temperature, humidity, albedo, and normalized difference vegetation index (NDVI, MOD09Q1). The results show that the ETMOD16 values were significantly correlated with ETOBS, with a correlation coefficient above 0.70 (P < 0.01) for the two sites. In 2001-2018, the regional mean β was 2.52 ± 0.77 for the whole grassland, and its spatial distribution gradually increased from the eastern to western region. The interannual β showed a downward trend with a slope of -0.025 and a multiple regression coefficient (R 2) of 0.21 (P = 0.056). Most of the variability (51%) in the interannual β can be explained by the linear regression of the above multiple factors, and the temperature plays a dominant role for the whole region. The SEM analysis further shows that an increasing NDVI results in a decreasing albedo with a path coefficient of -0.57, because the albedo was negatively correlated with NDVI (R 2 = 0.52, P < 0.01), which indicates a negative and indirect effect on β from vegetation restoration. An obvious warming climate was found to prompt more evapotranspiration, and restoring vegetation makes the land surface receive more radiation, which both resulted in a decreasing trend in the annual β. This study revealed the biogeophysical mechanisms of vegetation restoration under a changing climate, and demonstrated the Bowen ratio can be applied as an indicator of climate-regulating functions in ecosystem assessments.
Key words: alpine grassland; Bowen ratio; Three-River Headwaters; MODIS; evapotranspiration
ZHAO Xuanlan , WANG Junbang , YE Hui , MUHAMMAD Amir , WANG Shaoqiang . The Bowen Ratio of an Alpine Grassland in Three-River Headwaters, Qinghai-Tibet Plateau, from 2001 to 2018[J]. Journal of Resources and Ecology, 2021 , 12(3) : 305 -318 . DOI: 10.5814/j.issn.1674-764x.2021.03.001
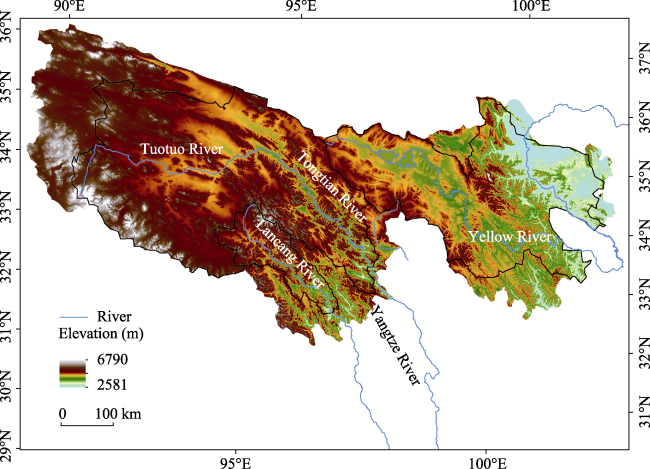
Fig. 1 Location of the Three-River Headwaters Region, Qinghai Province, China. |
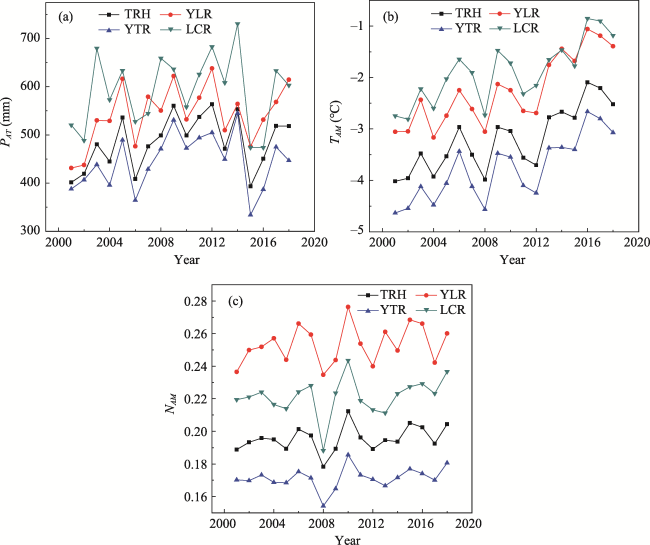
Fig. 2 Interannual changes of the annual total precipitation (PAT), the annual mean temperature (TAM) and NDVI (NAM) of the whole region (TRH) and the three sub-basins of Yellow River (YLR), Yangtze River (YTR) and Lancang River (LCR) in the Three-River Headwaters, Qinghai, China, from 2000 to 2018. |
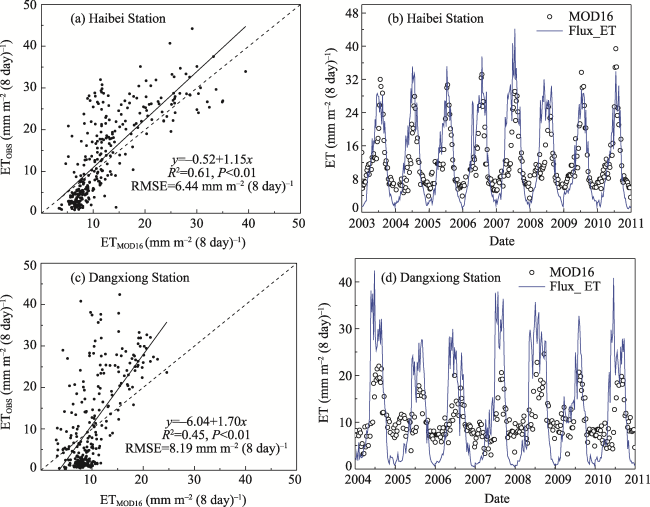
Fig. 3 The evapotranspiration (ETMOD16) products of MODIS (MOD16A2) were validated against the observations (ETOBS) through the linear regression analysis (a, c) and the seasonal change comparisons (b, d) on the alpine grasslands at Haibei Station (a, b) and Dangxiong Station (c, d) on the Qinghai-Tibet Plateau, China. |
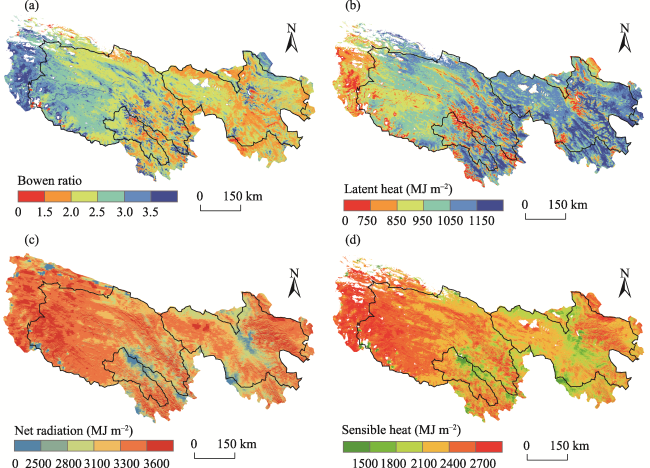
Fig. 4 Distribution patterns of multi-year averages of Bowen ratio (a), Latent heat (b), Net Radiation (c), and Sensible Heat (d) of the Three-River Headwaters from 2001 to 2018. |
Fig. 5 Inter-annual variation trends of the Bowen ratio in Three-River Headwaters (a) and each of the three sub-Basins (b) from 2001 to 2018 |
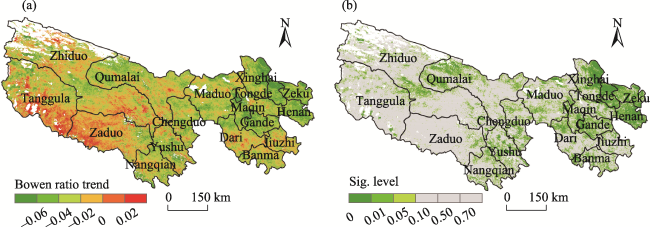
Fig. 6 Spatial pattern of the inter-annual trend of the Bowen ratio (a) and its significant level (b) on the pixel scale for the Three-River Headwaters from 2001 to 2018 |
Table 1 Multiple linear normalized regression coefficients for the three sub-basins in the Three-River Headwaters and the whole region |
| Area | bP | bT | bH | bN | bA | R2 | P-value |
|---|---|---|---|---|---|---|---|
| Yellow River | -0.01 | -0.55 | -0.04 | -0.31 | -0.09 | 0.57 | 0.10 |
| Yangtze River | -0.15 | -0.37 | -0.19 | -0.23 | 0.02 | 0.48 | 0.19 |
| Lancang River | 0.02 | -0.43 | -0.26 | -0.22 | 0.03 | 0.46 | 0.23 |
| Whole region | -0.08 | -0.43 | -0.14 | -0.27 | -0.05 | 0.51 | 0.16 |
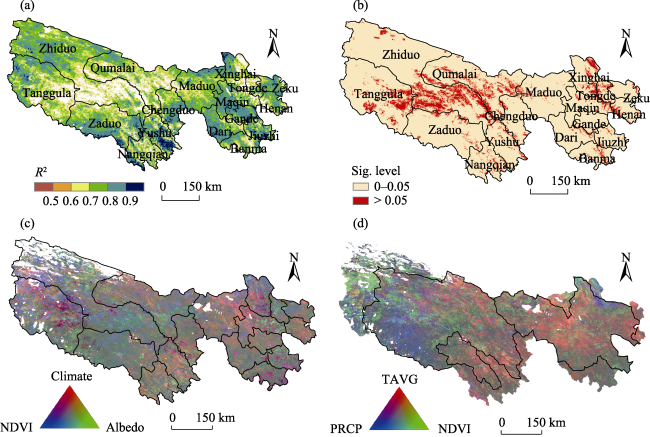
Fig. 7 The trends of Bowen ratio attributed to climate (PAT, TAM and RHAM), vegetation greenness (NAM) and AAM through the multiple linear regression with its multiple correlation coefficient (a), significance level (b), and the regression coefficients multiplied by the trends of the dependent variables (c,d). |
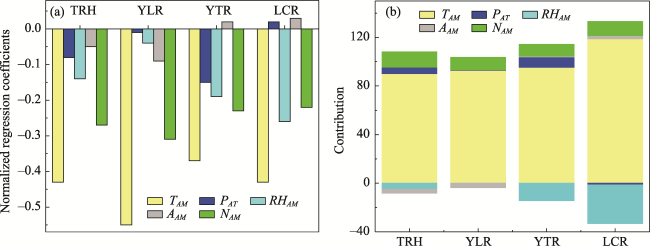
Fig. 8 The standard regression coefficients (a) and their contributions (b) on the Bowen ratio from the annual mean temperature (TAM), annual total precipitation (PAT), annual mean humidity (RHAM), annual mean albedo (AAM) and annual mean normalized difference vegetation index (NAM) in the Three-River Headwaters in the period from 2001 to 2018. |
Table 2 The 2001-2018 interannual trends of Bowen ratio and related climate variables in the Three-River Headwaters |
| Region | Area (%) | Bowen trend | TAM trend | PAT trend | RHAM trend | AAM trend | NAM trend | Bowen = bT + bP + bR + bA + bN | |||||
|---|---|---|---|---|---|---|---|---|---|---|---|---|---|
| bT | bP | bR | bA | bN | R2 | ||||||||
| TRH | 86 | ‒0.0255 | 0.093(<0.001) | 3.88(0.13) | ‒0.007(0.43) | ‒0.001(0.07) | 0.00047(0.20) | ‒0.3417 | ‒0.0005 | ‒0.2525 | ‒1.1175 | ‒9.4901 | 0.5038 |
| YLR | 25 | ‒0.0339 | 0.109(<0.001) | 4.71(0.09) | ‒0.002(0.87) | ‒0.001(0.16) | 0.00059(0.30) | ‒0.3877 | ‒0.00004 | ‒0.0372 | ‒1.5741 | ‒7.8781 | 0.5629 |
| YTR | 31 | ‒0.0184 | 0.092(<0.001) | 2.40(0.38) | ‒0.012(0.22) | ‒0.001(0.04) | 0.00031(0.29) | ‒0.3004 | ‒0.0010 | ‒0.3456 | 0.2343 | ‒9.0489 | 0.4715 |
| LCR | 4 | ‒0.0204 | 0.089(<0.001) | 1.79(0.62) | ‒0.026(0.04) | ‒0.001(0.31) | 0.00052(0.33) | ‒0.3851 | 0.0002 | ‒0.3506 | 0.7142 | ‒6.4999 | 0.4448 |
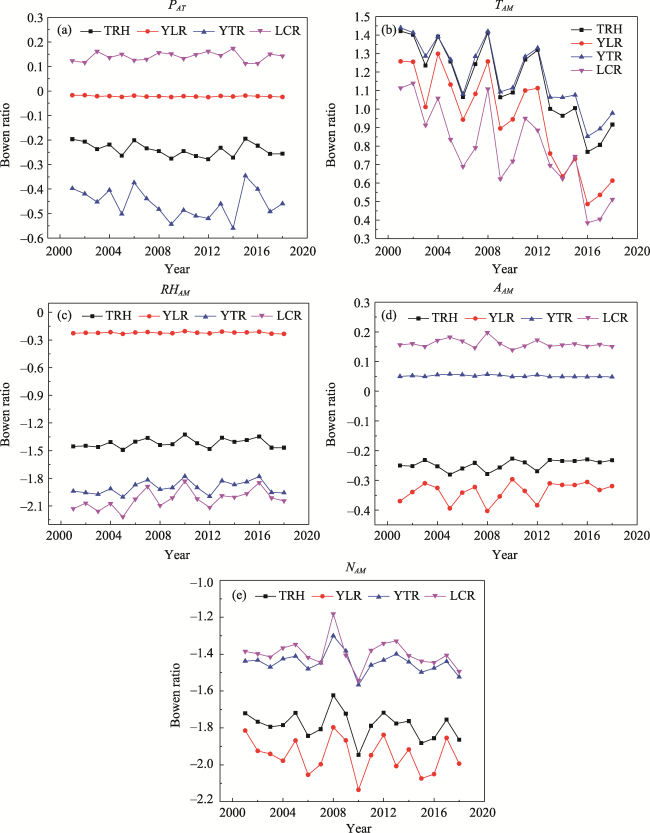
Fig. 9 Effects of different factors on the interannual variation of the Bowen ratio in the Three-River Headwaters: (a) PAT, (b) TAM, (c) RHAM, (d) AAM, and (e) NAM. |
Table 3 Fitness test results of SEM |
| Assessment index | Absolute goodness-of-fit indices | Comparative fit index | Information criteria index | ||||||
|---|---|---|---|---|---|---|---|---|---|
| Chi-sq | df | P value | RMSEA | SRMR | RMR | GFI | CFI | AIC | |
| Optimal value | P > 0.05 | ‒ | <0.05 | <0.05 | <0.08 | <0.08 | >0.90 | >0.90 | The smaller, the better |
| Practical value | 0.000 | 0.000 | NA | 0.000 | 0.000 | 0.000 | 1.000 | 1.000 | ‒527.85 |
Note: Root Mean Square Error of Approximation (RMSEA), Chi-square value (Chi-sq), Comparative fit index (CFI), Standardized Root Mean Square Residual (SRMR), Root Mean Square Residual (RMR), Goodness of Fit Index (GFI), Red Pool Information Criterion (AIC). The degree of freedom of the model is 0, so it is called just a recognition model or saturation model, and its chi-square value is also 0. All parameters of this model have only unique solutions. A CFI of 1 means that the model is fully adapted. |
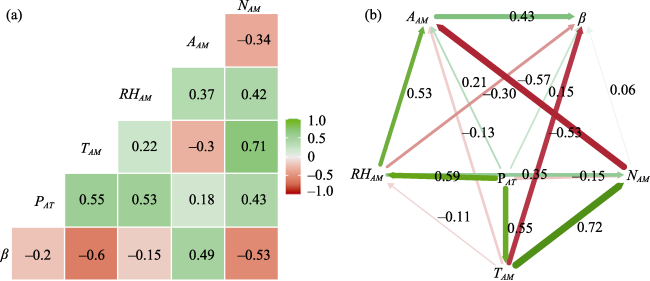
Fig. 10 The correlation matrix (a) and the structural equation model (b) for the variables of annual total precipitation (PAT), the annual mean temperature (TAM), annual mean relative humidity (RHAM), and the vegetation factors of the annual mean Albedo (AAM) and annual mean normalized difference vegetation index (NAM), and the Bowen ratio (β).Note: In subplot (b), the width of a line indicates the correlation and the green and red colors indicate a positive and a negative effect, respectively. The labeled values are the normalized path coefficients. |
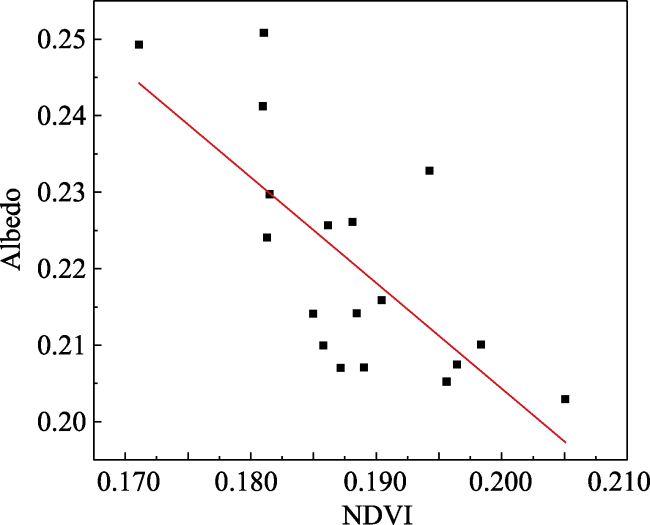
Fig. 11 The annual mean albedo was significantly correlated with the annual mean NDVI in the Three-River Headwaters, Qinghai Province, in the period from 2001 to 2018. |
| 1 |
|
| 2 |
|
| 3 |
|
| 4 |
|
| 5 |
|
| 6 |
|
| 7 |
|
| 8 |
|
| 9 |
|
| 10 |
|
| 11 |
|
| 12 |
|
| 13 |
|
| 14 |
|
| 15 |
|
| 16 |
|
| 17 |
|
| 18 |
|
| 19 |
|
| 20 |
|
| 21 |
|
| 22 |
|
| 23 |
|
| 24 |
|
| 25 |
|
| 26 |
|
| 27 |
|
| 28 |
|
| 29 |
|
| 30 |
|
| 31 |
|
| 32 |
|
| 33 |
|
| 34 |
|
| 35 |
|
| 36 |
|
| 37 |
|
| 38 |
|
| 39 |
|
| 40 |
|
| 41 |
|
| 42 |
|
| 43 |
|
| 44 |
|
| 45 |
|
| 46 |
|
| 47 |
|
| 48 |
|
| 49 |
|
| 50 |
|
| 51 |
|
| 52 |
|
| 53 |
|
| 54 |
|
| 55 |
|
| 56 |
|
| 57 |
|
| 58 |
|
| 59 |
|
| 61 |
|
/
| 〈 |
|
〉 |