
Journal of Resources and Ecology >
Spatiotemporal Variation of Cultivated Land Security and Its Drivers: The Case of Yingtan City, China
Received date: 2020-10-15
Accepted date: 2020-12-26
Online published: 2021-05-30
Supported by
The Research Project of Humanities and Social Sciences in Colleges and Universities of Jiangxi Province(JC19221)
The National Natural Science Foundation of China(41361049)
The Ganpo “555” Talent Research Funds of Jiangxi Province, China(201295)
Maintaining an adequate security level of cultivated land is essential for the healthy and sustainable survival of China’s large and growing population. We constructed a cultivated land security evaluation index system, combined with an improved TOPSIS method by taking into account the balance and stability of quantitative, qualitative, and ecological security. We applied this improved method to an evaluation of the state of cultivated land security and analyzed its spatiotemporal variation in Yingtan City (Jiangxi Province, China) from 1995 to 2015. The drivers of the changes in cultivated land security were investigated via a spatial regression model, which can eliminate the effect of spatial autocorrelation. The results showed that cultivated land security decreased rapidly from 1995 to 2005, although it tended to rise slowly in the subsequent period from 2005 to 2015. Areas deemed to be in a highly dangerous state were mainly distributed in the Yuehu District, while those that were secure appeared primarily in the southern mountainous area, with the area in a generally dangerous state extending to the west in the same direction as urban development. Among the examined drivers, social-economic factors and policy factors significantly influenced the cultivated land security. Our work suggests that government managers should take appropriate measures to improve cultivated land security according to its spatiotemporal variations and the underpinning drivers in this region.
KUANG Lihua , YE Yingcong , GUO Xi , XIE Wen , ZHAO Xiaomin . Spatiotemporal Variation of Cultivated Land Security and Its Drivers: The Case of Yingtan City, China[J]. Journal of Resources and Ecology, 2021 , 12(2) : 280 -291 . DOI: 10.5814/j.issn.1674-764x.2021.02.014
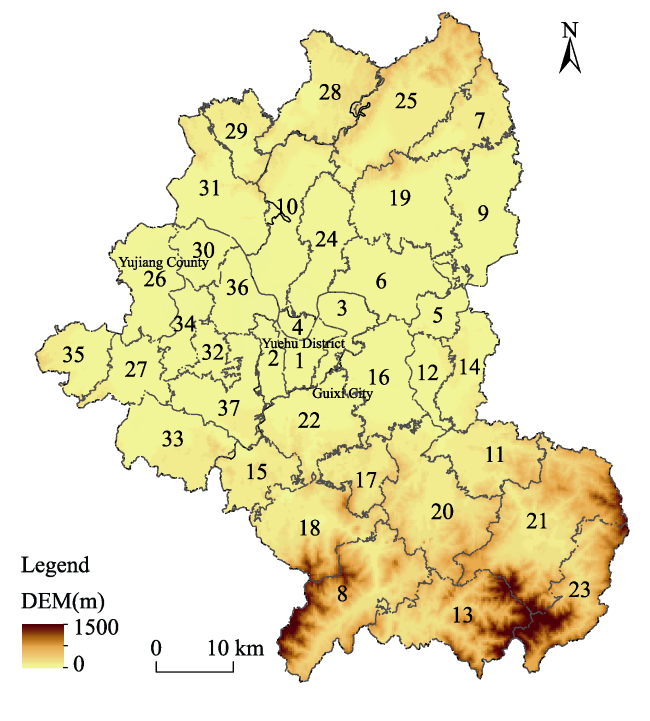
Fig. 1 Elevation and administrative divisions of Yingtan City Note: 1. Chengqu; 2. Bailu; 3. Tongjia; 4. Xiabu; 5. Guixi subdistrict Community; 6. Binjiang; 7. Baitian; 8. Erkou; 9. Hetan; 10. Hongtan; 11. Jintan; 12. Leixi; 13. Lengshui; 14. Liukou; 15. Longhushan; 16. Luohe; 17. Pengwan; 18. Shangqing; 19. Sili; 20. Tangwan; 21. Wenfang; 22. Tianlu; 23. Zhangping; 24. Zhiguang; 25. Zhoufang; 26. Chuntao; 27. Dengbu; 28. Huaqiao; 29. Huangzhuang; 30. Huangxi; 31. Jinjiang; 32. Liujiazhan; 33. Maqun; 34. Pingding; 35. Yangxi; 36. Zhongtong; 37. Honghu. |
Table 1 Detailed structure of the comprehensive index system designed to evaluate cultivated land security |
| Criteria layer | Indicator layer | Indicator description | Weight | |
|---|---|---|---|---|
| Quantitative security | Cultivated land retention (n1) | The area of cultivated land in the year / the area of cultivated land in 2015 | 0.3254 | |
| Per capita cultivated area (n2) | Cultivated land area / population (ha per person) | 0.3186 | ||
| Cultivated land supplement coefficient (n3) | Increased area of cultivated land in the same year / reduced area of cultivated land | 0.3560 | ||
| Qualitative security | Natural qualities | Effective soil thickness (n4) | Reflecting the depth of soil effective tillage | 0.0817 |
| Soil texture (n5) | Reflecting soil physical properties | 0.0686 | ||
| Soil pH (n6) | Reflecting the acidity and alkalinity of cultivated soil | 0.0883 | ||
| Soil organic matter (n7) | Reflecting the soil fertility level of cultivated land | 0.1972 | ||
| Farming conditions | Irrigation guarantee rate (n8) | Reflecting the ability of irrigation and water conservancy | 0.1750 | |
| Drainage condition (n9) | Reflecting the ability of arable land to drain water | 0.1051 | ||
| Plot flatness (n10) | Reflecting the steepness of the cultivated land surface | 0.0431 | ||
| Road density (n11) | Reflecting road accessibility, Road length / spot area (m ha‒1) | 0.1606 | ||
| Cultivated land concentration (n12) | The concentration of cultivated land in space | 0.0804 | ||
| Ecological security | Forest coverage (n13) | Forest area / total land area | 0.3381 | |
| Proportion of soil erosion area of cultivated land (n14) | Soil erosion area / total cultivated area | 0.1362 | ||
| Fertilizer load per unit area (n15) | Fertilizer application rate / cultivated area (kg ha‒1) | 0.1957 | ||
| Pesticide load per unit area (n16) | Pesticide application rate / cultivated area (kg ha‒1) | 0.1587 | ||
| Heavy metal pollution (n17) | Reflecting the degree of damage by heavy metals | 0.1713 | ||
Table 2 Preliminary selection of the drivers of changes in cultivated land security |
| Feature class | Driver | Instruction | Predicted influence direction |
|---|---|---|---|
| Natural factors | The effective accumulated temperature (X1) | Sum of the average temperature>10 ℃ per year | + |
| Precipitation (X2) | Unit: mm | + | |
| Socio-economic factors | Per capita income of farmers (X3) | Changes in farmers’ income levels | + |
| Agricultural mechanization level (X4) | Unit: ha per agricultural machine | + | |
| Policy factors | Investment in environmental governance as a proportion of GDP (X5) | Environmental governance investment / GDP | + |
| Protection of cultivated land (X6) | Increased area of cultivated land / reduced area of cultivated land | + | |
| Input of agricultural technicians (X7) | Unit: ha per person | + |
Note: Both independent and dependent variables are the changing amount of the factor values from 1995 to 2005 (the first period) and from 2005 to 2015 (the second period), namely the value of 2005 minus that of 1995 for the first period, and likewise the value of 2015 minus that of 2005 for the second period. |
Table 3 The state of cultivated land security in Yingtan City from 1995 to 2015, expressed as a proportion of its total area in 1995, 2005, and 2015. (%) |
| Security state | 1995 | 2005 | 2015 |
|---|---|---|---|
| Generally secure | 8.01 | 6.14 | 5.95 |
| Critically secure | 91.32 | 48.96 | 60.72 |
| Generally dangerous | 0.67 | 37.55 | 27.38 |
| Highly dangerous | 0 | 7.36 | 5.95 |
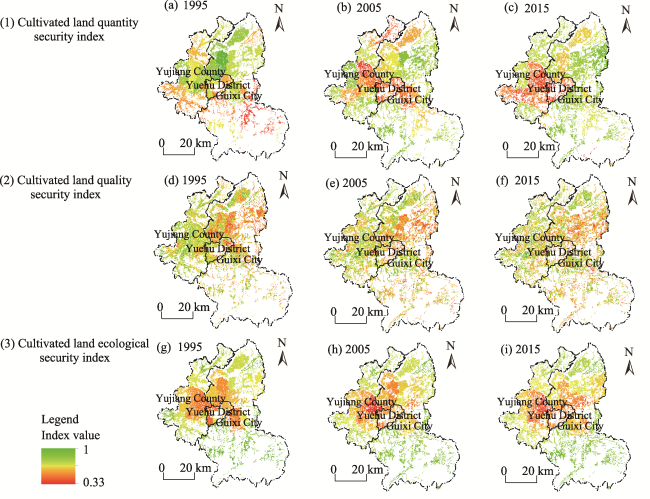
Fig. 2 Spatial distribution of values for the quantitative security (a-c), qualitative security (d-f), and ecological security (g-i) indexes of cultivated land in Yingtan City, China, in 1995, 2005, and 2015. |
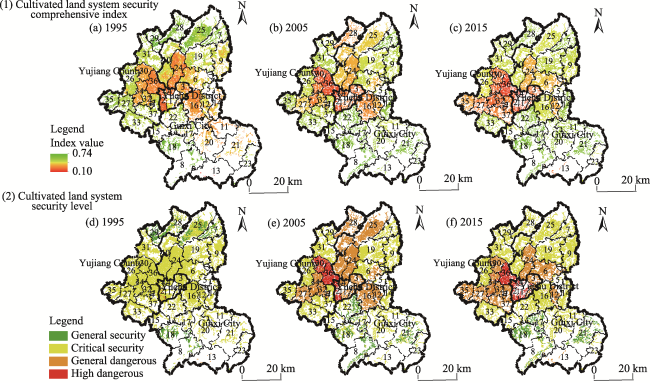
Fig. 3 Spatial distribution of values for the comprehensive index of cultivated land security (a-c) and areas with different security levels (d-f) in Yingtan City, China, in 1995, 2005, and 2015. Note: The meaning of the numbers in maps is the same as that of the numbers in Fig. 1. |
Table 4 Driving factors of cultivated land security in Yingtan City from 1995 to 2015 based on the SEM |
| Variable | The first period (1995-2005) | The second period (2005-2015) | ||||
|---|---|---|---|---|---|---|
| Coefficient | Std. Error | P | Coefficient | Std. Error | P | |
| Constant | 0.307 | 0.066 | <0.01 | ‒0.873 | 0.228 | <0.01 |
| l | 0.816 | 0.009 | <0.01 | 0.941 | 0.007 | <0.01 |
| The effective accumulated temperature (X1) | ‒0.001 | 0.001 | 0.720 | ‒0.025 | 0.004 | <0.01 |
| Precipitation (X2) | ‒0.001 | 0.001 | <0.01 | 1.007 | 0.256 | <0.01 |
| Per capita income of farmers (X3) | 0.001 | 0.001 | <0.01 | 0.002 | 0.007 | 0.795 |
| Agricultural mechanization level (X4) | 0.001 | 0.002 | 0.921 | 0.036 | 0.018 | 0.046 |
| Investment in environmental governance as a proportion of GDP (X5) | 0.357 | 0.034 | <0.01 | 0.073 | 0.019 | <0.01 |
| Protection of cultivated land (X6) | 0.003 | 0.001 | <0.01 | 0.001 | 0.002 | <0.01 |
| Input of agricultural technicians (X7) | 0.001 | 0.001 | <0.01 | 0.001 | 0.001 | 0.803 |
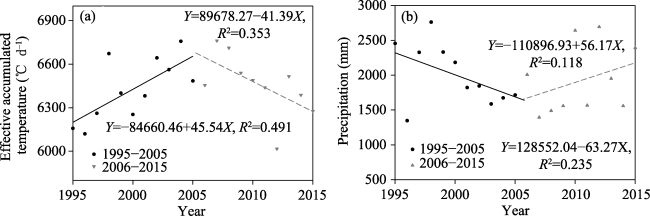
Fig. 4 The changing of natural factors in Yingtan City from 1995 to 2015, (a) Effective accumulated temperature; (b) Precipitation. |
Table S1 Statistical results for the driver analysis of changes in the cultivated land security in Yingtan City (Jiangxi Province, China) from 1995 to 2015 |
| Variable | The first period (1995-2005) | The second period (2005-2015) | ||||
|---|---|---|---|---|---|---|
| OLS | SLM | SEM | OLS | SLM | SEM | |
| Constant | 0.235*** | 0.049*** | 0.307*** | ‒0.618*** | 0.013 | ‒0.873*** |
| X1 | ‒0.041*** | ‒0.001 | ‒0.001 | ‒0.043*** | ‒0.026 | ‒0.025*** |
| X2 | ‒0.206*** | ‒0.001*** | ‒0.001*** | 0.650*** | 0.007 | 1.007*** |
| X3 | 0.026*** | 0.001 | 0.001*** | 0.065*** | 0.006 | 0.002 |
| X4 | ‒0.076*** | ‒0.002*** | 0.001 | 0.031*** | 0.008 | 0.036** |
| X5 | 0.192*** | 0.083*** | 0.357*** | 0.071*** | 0.013** | 0.073*** |
| X6 | 0.081*** | 0.002*** | 0.003*** | 0.015*** | ‒0.001 | 0.001*** |
| X7 | 0.002*** | 0.001*** | 0.001*** | 0.003*** | 0.001 | 0.001 |
| l | 0.816*** | 0.941*** | ||||
| W_Y | 0.798*** | 0.925*** | ||||
| Lagrange multiplier (lag) | 18841.548*** | 46087.474*** | ||||
| Robust LM (lag) | 249.744*** | 256.640*** | ||||
| Lagrange multiplier (error) | 19681.217*** | 53157.894*** | ||||
| Robust LM (error) | 10894.13*** | 7327.059*** | ||||
| Log likelihood | ‒4587.287 | ‒2049.645 | ‒2004.538 | 1186.945 | 3950.090 | 4056.011 |
| Akaike info criterion | 9192.574 | 4119.289 | 4026.716 | ‒2355.890 | ‒7880.172 | ‒7994.020 |
| Schwarz criterion | 9265.655 | 4200.490 | 4099.797 | ‒2283.502 | ‒7799.744 | ‒7921.640 |
Note: Numbers in the table are the regression coeffcients; *** P < 0.01, ** P < 0.05, and * P < 0.1. |
| 1 |
|
| 2 |
|
| 3 |
|
| 4 |
|
| 5 |
|
| 6 |
|
| 7 |
|
| 8 |
|
| 9 |
|
| 10 |
|
| 11 |
|
| 12 |
|
| 13 |
|
| 14 |
|
| 15 |
|
| 16 |
|
| 17 |
|
| 18 |
|
| 19 |
|
| 20 |
|
| 21 |
|
| 22 |
|
| 23 |
|
| 24 |
|
| 25 |
|
| 26 |
|
| 27 |
|
| 28 |
|
| 29 |
|
| 30 |
|
| 31 |
|
| 32 |
|
| 33 |
|
| 34 |
|
| 35 |
|
| 36 |
|
| 37 |
|
| 38 |
|
| 39 |
|
| 40 |
|
| 41 |
|
| 42 |
|
| 43 |
|
| 44 |
|
| 45 |
|
| 46 |
|
| 47 |
|
| 48 |
|
| 49 |
|
| 50 |
|
| 51 |
|
| 52 |
|
| 53 |
|
| 54 |
|
| 55 |
|
| 56 |
|
| 57 |
|
| 58 |
|
| 59 |
|
| 60 |
|
| 61 |
|
| 62 |
|
| 63 |
|
| 64 |
|
| 65 |
|
| 66 |
|
/
| 〈 |
|
〉 |