Land Use Change and Land Multifunction Tradeoffs

Spatio-temporal Pattern of Multifunction Tradeoffs and Synergies of the Rural Landscape: Evidence from Qingpu District in Shanghai

  • REN Guoping 1, 2 ,
  • LIU Liming , 3, * ,
  • LI Hongqing 4 ,
  • YIN Gang 1, 2 ,
  • ZHAO Xu 1, 2
Expand
  • 1. College of Management, Hunan City University, Yiyang, Hunan 413000, China
  • 2. Hunan New-type Urbanization Insitute, Yiyang, Hunan 413000, China
  • 3. College of Land Science and Technology, China Agricultural University, Beijing 100193, China
  • 4. School of Public Administration, Hohai University, Nanjing 211100, China
*: LIU Liming, E-mail:

REN Guoping, E-mail:

Received date: 2020-09-26

  Accepted date: 2020-12-15

  Online published: 2021-05-30

Supported by

The National Natural Science Foundation of China(41471455)

The Humanities and Social Science Research Project of Hunan Education Department(19A086)

The Key Laboratory of Key Technologies of Digital Urban-Rural Spatial Planning of Hunan Province(2018TP1042)

Abstract

The configuration of a multifunctional rural landscape is critical for its protection. Although studies on multifunctional rural landscapes have been conducted, there is a lack of information regarding the spatiotemporal characteristics and tradeoff/synergy relationships of rural landscape functions in the time series on the administrative unit scale. The purposes of this study were to (1) analyze the spatial-temporal distribution characteristics of the tradeoff and synergy from the perspective of multifunctionality for efficient use of rural landscape resources and (2) formulate regional sustainable development policies to minimize the conflict between people and nature. Aiming at the scientific representation of landscape function and the quantification of landscape multifunctional relationships, and by taking Qingpu District of Shanghai as an example, six kinds of rural landscape functions were constructed according to the functional framework of “productive function, living function and ecological function”. Based on the data for 1980 to 2018, the characteristics of variations of multifunctional tradeoff and synergy relationships of the rural landscape in 184 administrative villages were studied by the methods of Spearman rank correlation coefficient analysis and bivariate spatial autocorrelation. The following results were obtained. 1) The fine division of rural landscape function types was realistic and necessary for analyzing the regional multi-function relationships in the regions with rapid development. In the process of rapid urbanization, the rural landscape functions of urban suburban areas changed under the combined action of natural resource endowment, social and economic conditions and other internal and external factors. As a result, the agricultural production function could not replace the economic development function and become the function of rural landscape production. The research results of Qingpu District showed that the agricultural production function was no longer the primary functional form, yet the economic development function became the dominant function in this area. 2) Temporal and spatial analysis methods of rural landscape functions can accurately and comprehensively reflect the evolution of the characteristics of multifunction tradeoffs and synergies. According to the Spearman rank correlation analysis of the multifunction value of the rural landscape in the time dimension, the results masked the differences of resource and environment carrying capacity caused by the differences of regional landscape resource endowment in the spatial dimension. 3) The spatial and temporal differences of the multi-functional tradeoffs and synergies of the rural landscape in Qingpu District from 1980 to 2018 were significant. There was significant heterogeneity of tradeoffs and synergies between functions in the spatial pattern, with clustering characteristics. Meanwhile, as for the temporal pattern, the tradeoffs and synergies of functions changed differently in terms of Moran's I and the correlation coefficient. The results of this study can provide scientific references for urban-suburban-rural space reconstruction and regional sustainable development.

Cite this article

REN Guoping , LIU Liming , LI Hongqing , YIN Gang , ZHAO Xu . Spatio-temporal Pattern of Multifunction Tradeoffs and Synergies of the Rural Landscape: Evidence from Qingpu District in Shanghai[J]. Journal of Resources and Ecology, 2021 , 12(2) : 225 -240 . DOI: 10.5814/j.issn.1674-764x.2021.02.009

1 Introduction

Landscape is an integrated system, composed by inlaid spaces of natural, semi-natural and social and economic systems, and having the productive, living and ecological values (Willemen et al., 2010). Landscape function, which synthetically represents the relationship between landscape structure and ecological process, is the ability of landscape resources to supply human products and services (Peng et al., 2015a). Landscape function has the characteristics of spatial non-equilibrium and temporal variability (Firbank et al., 2013). The selectivity of human utilization of landscape function complicates the relationships between landscape functions, which is manifested by “tradeoffs” and “synergies” (Yang et al., 2015). Thus, tradeoff means that the growth of one function leads to the reduction of another function. Synergy refers to the simultaneous increase or decrease of two or more functions (Qiu and Turner, 2013).
Rural landscape resources are the basic resources and material guarantee for human survival, the important carrier of agricultural civilization and the main matrix of the agricultural landscape. As one of the important attributes of landscape, multifunctionality can effectively enhance the advantages of landscape resources and restrain the passive state of landscape space encroachment. A correct understanding of the relationships between rural landscape functions is the premise of sustainable management decisions in rural areas and contributes to the overall promotion of human well-being (Palmer and Silber, 2012). Different tradeoffs and synergies between different landscape functions in temporal and spatial scales promote ecosystem services interaction and management decisions. Accordingly, the study of tradeoffs and synergies in rural landscape functions is not only helpful for understanding the interrelated factors and mechanisms of different functions, but also for accurately analyzing and comparing the relationships between them. These insights can help guide human beings to develop and utilize natural resources more reasonably (Peng et al., 2015). A multifunctional concept has been incorporated into decision-making and management, and has become one of the effective tools for resource use and management decision-making (Qian et al., 2020a).
At present, scholars mainly take ecosystem service as the carrier to carry out ecosystem service tradeoffs and synergies on rural landscape multifunctionality. The research content mainly focuses on the theoretical basis, manifestation, driving mechanism, scale effect, benefit optimization and uncertainty of ecosystem service tradeoffs and synergies (Zhang et al., 2020). Scholars have arranged the preferential priority of ecosystem services, from high to low, into the following four types: supply service, regulatory service, cultural service and support service (Zhang et al., 2019). Studies have found that ecosystem service tradeoffs are characterized by spatial and temporal reversibility and externalities (Qian et al., 2020). Geographers believe that the spatial and temporal heterogeneity of ecosystem services, the regional differences in the supply and benefits of ecosystem services and the spatial flow, the multi-scale comprehensive effect analysis and simulation, and the natural and human driving factors of tradeoffs and synergies not only form the theoretical basis of the subject, but also serve as the entry point of the main research (Han et al., 2020). From the perspective of research methods, the existing methods for studying tradeoffs and synergies can be summarized into four categories, that is: statistical methods, GIS spatial analysis methods, scenario simulations, and ecosystem services mobility analysis methods. Common tradeoff models include InVEST, ARIES, EcoAIM, ESValue, Envisio, EPM, NAIS, and others (Li et al., 2020). Various studies typically find that there are tradeoffs or synergies between the types and quantities of ecosystem services, but the results vary in scale (Wu et al., 2019). Global scale studies showed that the tradeoff records were almost three times as frequent as those of synergy, the “preset win-win” was not of universal significance, and the trade-off can better achieve the ideal result (Howe, 2014). Research on the regional scale showed that the structural contradiction and tradeoff between the agricultural production function and the ecological function were the main obstacles to the sustainable development of agricultural ecosystems (Qian et al., 2020a). Watershed scale studies showed that the relationship between supply and regulatory services had both tradeoffs and synergies (Qian et al., 2018b). Studies on the scale of land use types showed that the relationship between multifunctionality of cultivated land was mainly that of synergy (Asadolahi et al., 2018).
Although scholars have made many achievements, the following problems still needed to be further studied. Regarding the content, the classification systems used for ecosystem services are not uniform, and there are repetitions and omissions, which results in the uncertainties for tradeoff studies. In terms of methods, there is a lack of spatiotemporal coupling models. At present, most functional evaluation and mapping focuses on the large scale, which limits the application of evaluation results at small and medium scales. In the research practice, the existing research cases cannot guide ecological planning and ecological compensation practice well, and the studies were out of touch with the implementation of specific policies. In this context, from the global scale to the local small scale, many important scientific issues of spatial tradeoff and synergy need to be studied in different regions, and then summarized and the results promoted.
With the development of China’s rapid urbanization and the deepening of urban and rural transformation, the human demands for landscape functions has gradually changed from singularity to diversification, making the complex relationships between tradeoff and synergy more and more obvious (Peng et al., 2015b). Especially in the urban suburbs, the scarcity of landscape resources and the diversity of human demands greatly stimulated the complex relationships of the tradeoffs and synergies among the landscape functions (Azam et al., 2019). Clarifying the temporal and spatial characteristics of the relationships between tradeoff and synergy among the rural landscape multi-functions has become one of the core points for promoting the overall benefits of regional functions, guiding the rational exploitation of landscape resources, and achieving economic development and ecological protection in a win-win situation (Pan and Li, 2017; Wang et al., 2018). Therefore, we attempt to incorporate the tradeoff and synergy methods into the multi-functional relationship analysis of a rural landscape. Taking Qingpu District of Shanghai as an example, we use the Spearman method and bivariate local spatial autocorrelation methods to analyze the temporal and spatial changes of rural landscape multifunctional relationships from 1980 to 2018.

2 Materials and methods

2.1 Study area

The case study area is situated in Qingpu District, a typical suburban district located on the west of Shanghai, bordering Zhejiang Province and Jiangsu Province. Qingpu extends over approximately 668 km2 and is divided into three sub-districts and eight towns, consisting of 184 villages in total (Dianshan Lake was considered as a village in this study). According to the Qingpu Planning and Land Resources Bureau (http://prog.shqp.gov.cn/), Xiayang, Yingpu, and Xianghuaqiao are three sub-districts in the urban center of Qingpu, with Zhujiajiao, Liantang, and Jinze on the west wing, and Baihe, Chonggu, Zhaoxiang, Huaxin, and Xujing on the east wing (Fig. 1).
Shanghai City is the largest city and the most economically prosperous region of China, being the major economic, financial, trade and shipping centre on China’s east coast. In 2018, the land area of Shanghai comprised 0.09% of China and the population was less than 2.1%, but its gross domestic product (GDP) accounted for 4.2% of China’s overall GDP (NBSC, 2018). Shanghai has experienced rapid economic development since the beginning of the 1990s. From 1990 to 2018, its resident population grew from 13.34 million to 37.90 million, while the GDP increased from 781.66 billion yuan to 20181.72 billion yuan (NBSC, 1991, 2019). Rapid urbanization and industrialization have had profound influences on the development of the suburban rural areas.
As a representative suburban district of the Shanghai metropolis, Qingpu is also experiencing rapid urbanization. In 2018, the resident population of Qingpu was 1.29 million, a 92% increase from 2005 (NBSC, 1991, 2019). Urban sprawl significantly changed the land-use and land-cover patterns in Qingpu, and the demand for landscape services increased. Qingpu has a humid subtropical climate and most of the region is characterized by low and open terrain. The climate and topography provide advantages for agricultural development, which is important for supporting the urban development of Shanghai. In 2018, Qingpu’s GDP was 112.82 billion yuan, which accounted for 3.88% of Shanghai’s overall GDP (NBSC, 1991, 2019), while the proportion of Qingpu’s primary industry to Shanghai’s primary industry was 8.54%. Qingpu has abundant natural and cultural landscapes tourists from the surrounding cities. Dianshan Lake is the most important water body in this area and is one of the major drinking water sources for Shanghai as well, so Qingpu implements strict surface water quality standards. The competing demands for economic development and ecological conservation make Qingpu a representative suburban district to use for conducting landscape function research.
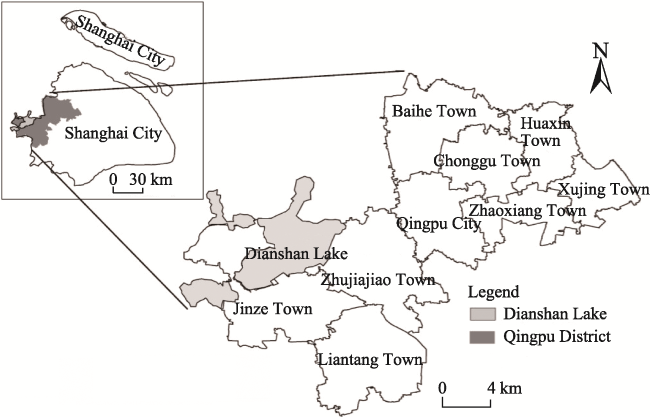
Fig. 1 Location of the case study area

2.2 Methods

2.2.1 Classification of rural landscape functions
The classification of rural landscape functions is the basis for the study of landscape function tradeoff and synergy. According to the mechanism of each function of the rural landscape and the framework of natural asset function evaluation, the evaluation index system for the productive-living-ecological functions of the rural landscape was constructed (MA, 2005; Fan, 2015). In this index system, the productive function (PF) of the rural landscape refers to the products and services which were directly or indirectly produced by landscape resources, including the agricultural production function (APF) and the economic development function (EDF) (O’Farrell et al., 2010). The living function (LF) of the landscape function covers essential services for human development such as residence, storage, aesthetic enjoyment, etc. which were provided by landscape resources, and includes the space carriage function (SCF) and the landscape aesthetic function (LAF) (Chen et al., 2014). The ecological function (EF) of the rural landscape refers to the natural conditions and utility services that maintain human survival, such as soil, vegetation, hydrology and biological elements, and includes the ecological regulation function (ERF) and the environmental maintenance function (EMF) (Mitchell et al., 2015).
2.2.2 Design of an evaluation index for rural landscape functions
Because of the difficulty of direct quantitative characterization, the multifunctional analysis of the rural landscape is often measured and expressed by using an index analysis method. Therefore, the construction of a multifunction analysis index system for the rural landscape has always been the basis and hot issue of many scholars’ research (Qian et al., 2020). While many have made useful attempts, the concept of rural landscape still lacks a widely accepted definition. In order to clarify the connotation of the rural landscape, this study defines it as follows. Rural landscape refers to the natural, complex economic system composed of different land use landscape types in rural areas, which is restricted by natural geographical conditions and influenced by social and economic activities; and it is equivalent to a regional landscape complex with a productive function, a living function and an ecological function. Therefore, the evaluation index system of the rural landscape function was constructed based on carrying the differences of the natural, economic and social elements (Ren et al., 2018). In order to avoid the one-sidedness and subjectivity of index selection, and based on the principles of regional characteristics, integrity of the evaluation units, relative stability and accessibility of indicators, experts in the fields of landscape planning, ecology, land use, natural geography and others were consulted for the final determination of the index system (Table 1).
Table 1 Evaluation index system of landscape functions and weights in Qingpu District
Target Criterion Indicators Direction Weight
PF APF X1 Annual value of food supply(yuan) Positive 0.065
X2 Annual value of cash crop supply (yuan) Positive 0.051
X3 Per capita cultivated land area
(ha person-1)
Positive 0.039
EDF X4 Per capita GDP (yuan) Positive 0.059
X5 Land urbanization rate (%) Positive 0.053
X6 Contribution of agriculture(%) Positive 0.044
LF SCF X7 Population density (person km-2) Positive 0.061
X8 Area of settlement landscape land
(ha)
Positive 0.063
X9 Per capita road mileage
(km person-1)
Positive 0.044
LAF X10 Demand (person) Positive 0.045
X11 Level of demand (yuan person-1) Positive 0.053
X12 Radiation range of landscape
aesthetics (km)
Positive 0.039
X13 Plaque agglomeration Positive 0.041
X14 Landscape diversity index Positive 0.034
EF ERF X15 Vegetation coverage index (%) Positive 0.043
X16 Water network density index (%) Positive 0.056
X17 Land degradation index Negative 0.037
EMF X18 Annual fertilizer application (t) Negative 0.065
X19 Environmental annual capacity of
landscape ecological land (t)
Positive 0.049
X20 Industrial waste emissions (t) Negative 0.059
(Jia et al., 2014). (4) LAF refers to the rural landscape as a natural and humanistic comprehensive landscape that can give aesthetic enjoyment, which is an important part of the cultural function of the cultivated land landscape (O’ Farrell et al., 2010), as affected by supply and demand. In terms of supply, the combination of cultivated land, garden land and water bodies is of greater aesthetic value. In terms of demand, the rural landscape is more attractive to urban residents with a strong willingness to pay and a high level of appreciation. The larger the population scale of adjacent cities, the higher the income level and the greater the demand for landscape availability. This study constructed an evaluation system from the dimension of supply and demand, which contained demand, level of demand, radiation range of landscape aesthetics, plaque agglomeration and a landscape diversity index of four indicators, to comprehensively represent the function of landscape aesthetics (Schmalz et al., 2016). (5) ERF refers to the ability to maintain the natural conditions of human existence and their utility. Vegetation coverage index, water network density index and land degradation index were selected to represent the regulation of the ecological environment (Langner et al., 2017). (6) EMF refers to the integrated service capacity to purify environmental pollution. Annual fertilizer application, annual environmental capacity of landscape ecological land and industrial waste emissions were selected to represent the negative environmental impacts of agroecosystems on the environment and eco-environmental thresholds of the ecological environment (Deng et al., 2016).
2.2.3 Multifunctional evaluation of the rural landscape and analysis of tradeoffs and synergies
(1) Standardization of evaluation indicators
In order to overcome the dimensionality and directional differences of the rural landscape function evaluation index, the standard method of extreme difference was used to deal with each index, making them dimensionless.
(2) Calculation of evaluation index weights
In order to overcome the influences caused by the small differences between the indexes, the factor analysis method was used to set the weight of each index. By constructing the index correlation matrix, each index weight was determined by the proportion of the principal component contribution value to the total contribution value (Table 1).
(3) Individual function evaluation of the rural landscape
The individual function of the rural landscape reflects the degree of functional importance and is a synthesis of all the index values of that function. The individual functional value was calculated by using the weighted summation model. The equation is as follows:
where F is the individual function value, Xi is the i-th index, Wi is the weight of the i-th index, and n is the number of the individual function.
(4) Quantification of tradeoffs and synergies in rural landscape multi-functionality
For analyzing the quantitative characteristics of tradeoffs and synergies in rural landscape multi-functionality, the Spearman rank correlation coefficient analysis method was used to test the nonparametric variation. This method has been widely used in the study of ecosystem service tradeoffs and synergies, and has strong universality. The equation is as follows:
${{r}_{s}}\left( {{X}_{i}},{{Y}_{i}} \right)=1-\underset{i=1}{\overset{n}{\mathop \sum }}\,\frac{{{({{P}_{i}}-{{Q}_{i}})}^{2}}}{n({{n}^{2}}-1)}$
where Xi and Yi are the data pairs with independent co-distribution; Pi is the rank of Xi; Qi is the rank of Yi; n is the independent and co-distributed data pairs; rs(Xi, Yi) is the rank correlation coefficient. A positive correlation coefficient denotes synergy between the two functions of the landscape, while a negative correlation coefficient denotes tradeoff. However, a non-significant correlation coefficient indicates an independent relationship.
(5) Spatial analysis of tradeoffs and synergies in rural landscape multi-functionality
In order to analyze the spatial characteristics of rural landscape function tradeoffs and synergies, spatial autocorrelation analysis was used to analyze their spatial agglomeration characteristics. This method includes global spatial autocorrelation and local spatial autocorrelation which was first proposed by Anselin, mainly for analyzing the correlation among geographical elements, and identifying the characteristics of spatial agglomeration and discreteness (Anselin, 1995). Meanwhile, it has also been widely used for analyzing relationships among functions.
Global spatial autocorrelation focuses on testing the degree of global aggregation and the dispersion of attribute values. The value of Global Moran's I includes the degree of overall spatial dependence among tradeoffs and synergies. The equation is as follows:
$Z\left( I \right)=1-\frac{E\left( I \right)}{\sqrt{Var\left( I \right)}}$
where N is the total number of administrative villages in Qingpu District, Wij is the spatial weight, Xi and Xj are the attribute values of regional i-th and j-th, respectively, and $\bar{X}$is the mean value. Z(I) is the threshold of standardized statistics, E(I) is the expected value of the autocorrelation of observed variables, and Var(I) is variance. Therefore, the value of Global Moran’s I is in the interval segment [-1,1]. I>0 denotes synergy between the two functions of the landscape, I<0 denotes tradeoff, and I=0 denotes non-significance.
Local spatial autocorrelation focuses on testing the degrees of local aggregation and dispersion of attribute values. The value of the local Moran’s I includes the degrees of local spatial dependence for tradeoffs and synergies. The equation is as follows:
${{I}_{i}}=\frac{\frac{{{X}_{i}}-\bar{X}}{M}\sum\limits_{j=1}^{n}{{{W}_{i}}}\left( {{X}_{j}}-\bar{X} \right)}{\frac{1}{N}\sum\limits_{i=1,j-1}^{n}{{{\left( {{X}_{j}}-\bar{X} \right)}^{2}}}}$
$S_{X}^{2}=\frac{1}{N}\underset{j=1}{\overset{n}{\mathop \sum }}\,\left[ {{W}_{ij}}{{\left( {{X}_{j}}-\bar{X} \right)}^{2}} \right ]$
where M is the total number of related administrative villages, N is the total number of administrative villages in Qingpu District, Wij is the spatial weight, Xi and Xj are the attribute values of regional i-th and j-th, respectively, and $\bar{X}$ is the mean value. S2x is the variance of attribute values. Using the local indicator of spatial association (LISA) for local correlation characteristics between landscape functions, five types were differentiated: HH type (high value synergy region), LL type (low value synergy region), HL type (high and low value tradeoff region), LH type (low and high value tradeoff region), and NN type (non-significance region).
In order to analyze the spatial characteristics of tradeoffs and synergies between the two functions of the rural landscape, on the basis of unilabiate spatial autocorrelation, a bivariate local spatial autocorrelation analysis method was adopted. The formula is as follows:
$I_{i}^{KI}=\frac{X_{i}^{K}-\overline{{{X}_{K}}}}{{{\sigma }^{K}}}\underset{j=1}{\overset{n}{\mathop \sum }}\,\left[ {{W}_{ij}}\times \frac{X_{j}^{I}-\overline{{{X}^{I}}}}{{{\sigma }^{I}}} \right]$
where: $I_{i}^{KI}$ is the correlation coefficient of bivariate local spatial autocorrelation in the i-th region, $X_{i}^{K}$ is the K-th functional value of the i-th region, $X_{j}^{I}$ is the I-th functional value of the j-th region, Wij is the spatial weight, $\overline{{{X}_{K}}}$ and $\overline{{{X}^{I}}}$ are the K-th and I-th functional mean values, respectively, and ${{\sigma }^{K}}$ and ${{\sigma }^{I}}$ are the K-th and I-th variances of the functional value.

2.3 Data sources and data pre-processing

Geospatial and socioeconomic data were used in this study. The geospatial data originated mainly from the 1:5,000 maps for the LULC of four periods (1980, 1995, 2007 and 2018), which were provided by the Qingpu District Land Bureau. The socioeconomic statistical data were collected from the China Statistical Yearbook (1981-2019), the China City Statistical Yearbook (1981-2019), the Shanghai Statistical Yearbook (1981-2019), the Qingpu Statistical Yearbook (1981-2019), and the past editions of the Land & Resource Bulletin and the Water Conservancy Annals of Shanghai. The socioeconomic data on the village scale were obtained from the Qingpu Statistical Bureau and the Qingpu Agriculture Committee.
The data processing method was as follows. As referenced by the Technical Regulation (TD/1014-2007) of the Second National Land Survey, land cover in this study was classified into eight classes by considering local expert knowledge: forest, grassland, water bodies, arable land, garden, transport land, unused land and built-up area. In order to calculate the landscape pattern index, the land-cover maps of Qingpu (for each of the four periods) were transformed to a pixel size of 30 × 30 m. In view of the fact that the water surface of Dianshan Lake belongs to Kunshan City and Qingpu District, it was distributed equally to Zhujiajiao Town and Jinze Town according to 1/4 of the area. A Rook adjacency principle was used to determine the spatial autocorrelation weight in order to decide which of the spatial weights had a proportional effect, and the structural characteristics were not obvious due to the decreased accuracy of the data estimation. In order to ensure the comparability of the statistics, all indicators related to gross domestic product were converted to the constant price index of 2018. The correlations among the selected variables were examined using multicollinearity testing through correlation coefficients and significance levels. According to our testing results, the VIF was < 10, which indicates no multicollinearity or correlation in the selected variables. All the calculations in this study were completed using the software EViews 8.0, ArcGIS 10.3 and GeoDa 095.

3 Results and interpretations

3.1 Results of the multifunctional comprehensive evaluation of rural landscape

On the basis of the constructed evaluation indexes, the weighted summation model Equation (1) was used to calculate the average values of the rural landscape functions of 184 villages in Qingpu District in different years (Table 2).
Table 2 Results of multifunctional comprehensive evaluation of the rural landscape in Qingpu District
Function 1980 1995 2007 2018
PF 0.545 0.641 0.662 0.675
LF 0.527 0.546 0.587 0.593
EF 0.605 0.505 0.334 0.396
APF 0.657 0.606 0.453 0.348
EDF 0.540 0.725 0.890 0.949
SCF 0.426 0.549 0.649 0.707
LAF 0.613 0.515 0.326 0.389
ERF 0.658 0.419 0.309 0.314
EMF 0.569 0.349 0.256 0.311
(1) The rural landscape function values were obtained for the years from 1980 to 2018. The average values of the rural landscape functions in different years were PF > LF > EF. The average value of the EDF (in 2018) was the largest (0.949), and that of the EMF (in 2007) was the smallest (0.256). During the study period, the average value of EMF in Qingpu was the smallest, and the value was 0.369.
(2) The variation of rural landscape function values was significant in the temporal dimension. The PF value and LF value increased year by year, while the EF decreased initially and then increased. The main types of function values which increased year by year were the EDF and SCF. Among these two, the growth rate of the EDF was the largest, with the function value increasing by 74.71%, and the SCF value increased by 65.82% in the past years. The main types of functions showing fluctuation were LAF, ERF and EMF. These three functional values showed an initial decline and then a rising trend during the study period. These results showed that the APF had ceased to be the primary function of Qingpu District, and the EDF had become the dominant function.

3.2 Temporal patterns of the tradeoffs and synergies for the rural landscape functions

Using the rank correlation coefficient to analyze the 72 pairs of functions of the rural landscape from 1980 to 2018 in Qingpu District, the following results were obtained. The functional tradeoffs of the rural landscape were dominant, which showed that the tradeoffs were represented by 34 groups and the synergies were seen in 31 groups, but the temporal differences between the tradeoff and synergy degrees of the rural landscape were significant.
3.2.1 Temporal patterns of the synergies for rural landscape functions
As shown in Fig. 2, the PF-LF in Qingpu District always maintained synergy during the study period, but the degree of synergism changed greatly, showing the trend of initially rising and then decreasing. The analysis indicated that six pairs of functions, APF-LAF, EDF-SCF, LAF-ERF, LAF-EMF and ERF-EMF always maintained synergy, but the degrees of synergism varied greatly. Synergies of the APF-LAF, LAF-EMF and ERF-EMF showed changes in time, which decreased at first and then increased.
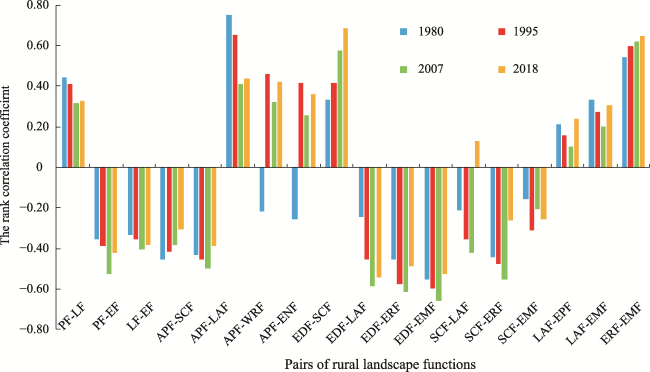
Fig. 2 Results of multifunctional correlation analysis of the rural landscape in Qingpu District
The APF mainly depended on a change in the supply values of food and cash crops caused by a change in the quantity and structure of the agricultural landscape (Zhu et al., 2018). Between the years 1980 and 2007, the total population of Qingpu District increased by 1.96-fold, and the area of agricultural landscape decreased by 11294.62 ha. Under the double pressures of population explosion and agricultural landscape area reduction, patch agglomeration decreased by 1.01 and the landscape diversity index decreased by 0.26. The above reasons caused a decrease in the synergistic degree between APF and LAF. With the decrease of agricultural landscape area, the decrease of population growth and the transformation of the agricultural structure from food crops to cash crops, the degree of the synergies between them increased.
The results showed that there was a high degree of synergy for EDF-SCF. From 1980 to 2018, the GDP of Qingpu District increased from 5.259 billion yuan to 82.74 billion yuan, the urbanization rate increased from 32.45% to 79.67%, and the proportion of agricultural industry decreased from 31.14% to 1.14%. At the same time, the rural settlement landscape area increased by 14829.91 ha and the population density increased by 8.52-fold. Therefore, the strong pull of the EDF had enhanced the SCF. However, the strong driving ability of SCF also provided a material basis for the growth of EDF. These two functions had achieved high synergy through long-term fusion and benign mutual feedback. There was a synergistic relationship between LAF-EMF and ERF-EMF. The main reasons for this synergy were that the diversity of landscape elements and the complexity of the landscape pattern had enhanced LAF, as well as the synergistic effect of soil and water conservation and absorption abilities. ERF-EMF showed high synergy, mainly because the formation mechanism of the two functions had a strong attachment (Reed et al., 2013).
3.2.2 Temporal patterns of the tradeoffs for rural landscape functions
During the study period, PF-EF in Qingpu District mainly maintained a tradeoff relationship (except the years 1980 and 1995). Among the six functional dimensions, there were always tradeoffs between the pairs of APF-EDF, APF-SCF, and EDF-LAF. There were tradeoffs between APF-EDF and APF-SCF because of the consumption of landscape resources of EDF and output reduction effect of SCF, which led to the tradeoff between these functions (Chen et al., 2014). For example, the proportions of the three industries in Qingpu District had changed from 31.14:53.18:15.68 to 1.14:54.22:44.64 from 1980 to 2018. The total value of farm output decreased by 30%. The APF gradually decreased, and the EDF increased year by year, resulting in the tradeoff between these two functions. There was also a tradeoff relationship between EDF-LAF, which was mainly attributed to the negative external effect of EDF on the destruction of the rural landscape matrix and the assimilation of landscape diversity.
3.2.3 Evolutionary patterns of the tradeoffs and synergies among rural landscape functions
APF-ERF and APF-EMF were mainly shown to have a synergistic relationship (except in 1980). These results were basically consistent with Dong’ results (Dong et al., 2019). However, the results of this study were different from those of most other scholars (Goldstein et al., 2012; Jia et al., 2014; Peng et al., 2015b; Pan and Li, 2017; Qian et al., 2018; Zhu et al., 2018). It is noteworthy that the special economic location advantage and ecological conservation functional orientation of Qingpu District caused the degradation of APF. The regional EDF can almost completely eliminate the contribution of agricultural output and maintain the synergy of the ecological regulation function and the environmental maintenance function with the management strategy of highly intensive, low-fertilizer agriculture and low-pollution industry. EDF-ERF and EDF-EMF both showed tradeoffs during the research period, but the degree of tradeoff showed a trend of first declining and then rising. The above trend coincided with the evolution of the EKC curve. With the rapid growth of both the economy and the population during 1980-2007, the consumption of landscape resources exceeded the regenerative capacity of these resources, and the environmental pollution and ecological damage intensified. However, the implementation of regional adjustments of the industrial structure and related land management policies led to the easing of the tradeoffs between these three functions from 2007 to 2018.
3.2.4 Temporal patterns of compatible relationships among rural landscape functions
The interactions between rural landscape functions include three forms: tradeoff, synergy and compatibility. This study defined the relationships that did not pass the significance test as compatibility. SCF-LAF, SCF-ERF and SCF-EMF did not pass the significance test in the different time points from 1980 to 2018. For example, for SCF-LAF, the β values of the correlation analysis were -0.351 (in 1995) and -0.421 (in 2007), which did not pass the significance test. Based on relevant research findings (Liu et al., 2011), in the area of rural bearing capacity, the functions of rural areas circulate along a path of ‘compatibility-tradeoff-compatibility-synergy- compatibility’. In this cycle, technological progress enhances the ability of human beings to transform nature, and the intensity and rate of changes between functions are gradually increasing. Our results in Qingpu District showed that the changes of these three groups of functional values were in accord with the evolutionary path.

3.3 Spatial patterns of the tradeoffs and synergies among rural landscape functions

Using the bivariate Global Moran’s I statistics of rural landscape functions in Qingpu District from 1980 to 2018, the following results were obtained (Table 3). The tradeoffs and synergies among PF, LF and EF showed that the tradeoffs applied to six groups (negative) and synergies applied to six groups (positive). Among the six sub-functions, the tradeoffs included 32 groups, the synergy relationships included 22 groups, and the compatibility relationships included six groups. The above results showed that the tradeoff relationship between rural landscape functions in Qingpu District from 1980 to 2018 was the dominant type, but the spatial differentiation between rural landscape tradeoff and synergy degrees was significant.
Table 3 Global spatial autocorrelation index between rural landscape functions in Qingpu District
Pairs of rural
landscape functions
1980 1995 2007 2018
I value Z value I value Z value I value Z value I value Z value
PF-LF 0.334 6.255 0.318 5.856 0.217 8.542 0.243 9.885
PF-EF 0.159 1.995 -0.102 6.523 -0.293 5.575 -0.185 2.688
LF-EF 0.272 9.523 0.138 5.445 -0.131 5.742 -0.109 6.635
APF-EDF -0.559 -6.859 -0.455 -5.778 -0.382 -4.524 -0.314 -3.524
APF-SCF 0.248 7.885 -0.332 -0.758 -0.459 -0.789 -0.547 -0.851
APF-LAF 0.353 7.851 -0.244 -6.855 -0.217 -4.874 0.142 3.448
APF-ERF -0.142 9.985 -0.311 -8.667 -0.564 -8.228 -0.337 5.668
APF-EMF -0.037 2.776 -0.119 -6.867 -0.325 -5.567 -0.217 2.888
EDF-SCF 0.256 7.567 0.356 9.861 0.467 10.232 0.633 11.745
EDF-LAF 0.138 2.664 -0.143 -3.752 -0.365 -4.578 -0.243 -8.347
EDF-ERF -0.251 -6.752 -0.316 -7.664 -0.542 -9.001 -0.424 -5.664
EDF-EMF -0.332 -3.341 -0.452 -4.584 -0.621 -6.854 -0.522 -7.330
SCF-LAF -0.213 -0.856 -0.311 -5.856 -0.322 -0.741 -0.362 -1.775
SCF-ERF 0.182 2.452 -0.051 -5.521 -0.242 -7.634 -0.328 -6.853
SCF-EMF 0.212 1.885 -0.101 -5.752 -0.225 -8.532 -0.362 -9.774
LAF-ERF 0.241 2.521 0.312 8.442 0.422 12.841 0.637 18.772
LAF-EMF 0.332 5.321 0.411 8.854 0.492 5.334 0.591 10.654
ERF-EMF 0.451 6.854 0.462 2.885 0.511 13.772 0.542 9.524
3.3.1 Spatial patterns of the tradeoffs and synergies for productive-living-ecological functions
PF-LF was dominated by synergy and diffused along the central axis. The HH and LL synergic regions were mainly concentrated in the eastern and central parts, as well as Dianshan Lake of Qingpu District, gradually forming the central axis of change with “Xujing Town-Zhaoxiang Town-Yingpu Street-Zhujiajiao Town” as the main line. However, the HL and LH tradeoff regions were distributed in the eastern and northern parts. PF-LF synergies originated in different areas from either the positive externality of economic development (eastern part), the agglomeration of industrial development (central part) or the amenity of the living environment (around Dianshan Lake). However, the PF-LF tradeoffs originated from the imbalance of spatial development caused by the regional “man-land-industry” conflict.
PF-EF was dominated by tradeoff and spatially diffused from the central to eastern areas. The HH and LL regions were concentrated in the western and northern parts, and the number decreased at first and then increased. Yet the tradeoffs between HL and LH were congregated in the east, and their number increased year by year. PF-EF synergistic regions originated from the huge environmental capacity of the landscape ecological land around Dianshan Lake. Although those regions were the base of the agricultural landscape and the annual fertilizer application was relatively large, the high capacity for absorption and dilution of pollutants by the good ecological matrix and water network made them highly synergistic. PF-EF tradeoffs resulted from sparse vegetation cover, population density and poor self-purification of the environment due to industrial pollutant emissions.
Tradeoffs and synergies of LF-EF were manifested in a balanced state. Among them, the tradeoffs diffused from the center to the east, and the synergistic relationships diffused from the west to both the north and the south. The HH and LL regions of synergies were mainly concentrated in the eastern, northern and lake regions. The HL and LH tradeoffs were distributed in the eastern parts, and their number increased year by year. Synergistic regions of LF-EF originated from a wide ranging agricultural landscape base, high agglomeration of agricultural patches, various types of agricultural landscape and a vast water landscape. However, the dense population and large landscape demand in the east made that region characterized by tradeoffs.
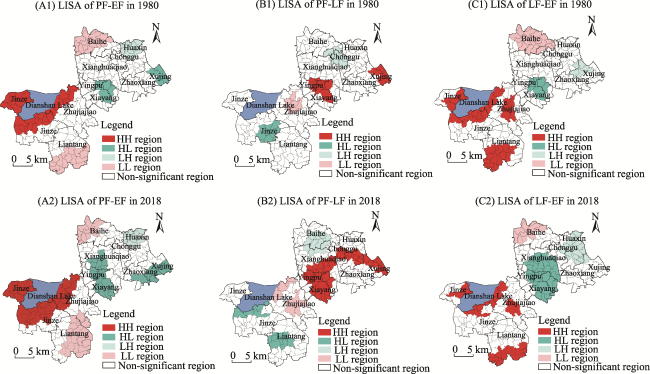
Fig. 3 LISA among productive-living-ecological functions in Qingpu District from 1980 to 2018
3.3.2 Spatial patterns of the tradeoffs and synergies for the different types of rural landscape functions
APF-EDF. The HH synergy regions were distributed around Dianshan Lake and Liantang, and the LL synergy regions were concentrated in Baihe. With the number of synergy regions gradually declining, the HH synergy regions were transformed into LL synergy regions, and LL regions were transformed into compatible regions by 2018. HL and LH tradeoffs had changed from a vertical axis (Xujing- Zhaoxiang-Xiayang-Zhujiajiao-Liantang) to a “+” shape (Huaxin-Zhonggu-Xianghuaqiao-Yingpu-Zhujiajiao), and the number increased at first and then decreased. HH and LL synergy regions originated from the changing status of the agricultural area, slow development of the secondary and tertiary industries and fertile soil conditions. On the other hand, the HL and LH tradeoff regions originated from urbanization diffusion and the radiation effect which caused the agricultural landscape land quantity to decline sharply and the agricultural output value to weaken.
APF-LAF. The HH and LL regions were distributed in Jinze, Liantang Town, Zhujiajiao Town and Baihe Town, and their quantity decreased at first and then increased, mainly due to the dense forest belt along the water system around the lake (Jinze Town), the high degree of concentration and intensification of the cultivated land (Liantang Town), and the good state of connection away from the town and habitat (Baihe Town). In addition, the HH and LL regions were distributed in Jinze, Liantang, Zhujiajiao and Baihe, and their quantity decreased initially and then increased, mainly due to the dense forests belt around the lake (Jinze), the high degree of concentration and intensification of the cultivated land (Liantang), and the good state of connection away from the town and habitat (Baihe), and other factors. The HL and LH tradeoff regions were concentrated in the east, which originated from the fragmentation and complexity of the individual agricultural landscape types and landscape patches under urbanization.
APF-ERF. There were obvious regional differences between the synergy and tradeoff regions, and the number of tradeoff regions increased at first and then decreased. However, the number of synergy regions decreased initially and then increased. Regional soil and water advantages, high vegetation coverage and strict land control measures in the west promoted the synergies. Fine landscape patches, scarce agricultural landscape resources and land degradation caused by resource overuse led to the tradeoffs.
APF-EMF. The synergy regions and the tradeoff regions in this group showed a cross-distribution pattern. The synergy regions were distributed around Dianshan Lake and along the water system network. Meanwhile, the HH regions decreased, and the LL regions increased, yet the synergy regions were distributed around the town center, and their quantity increased.
EDF-SCF. The relationship pattern appeared as an eastern tradeoff and a western synergy, and the synergy regions showed an increasing trend. The main reasons for this spatial relationship pattern were the optimization of regional industrial structure and the benign feedback of these two functions.
EDF-LAF. The changes of these two kinds of functional relationship were influenced by the residents’ demand for LAF, landscape quality and the residents’ income status (Zhu et al., 2018). This relationship also presented an eastern tradeoff and western synergy pattern, and the synergy regions showed an increasing trend. By relying on the superior conditions for the development of the agricultural industry (Jinze), the promotion of the tourism industry (Zhujiajiao) and the promotion of diversified agricultural management models (Baihe), those regions had formed a significant block of synergies. However, under the influences of population agglomeration and agricultural landscape land crowding and simplification, the eastern region formed tradeoffs.
EDF-ERF. Regional competitiveness and vitality of the rural landscape system itself is a kind of spatial occupation, which leads to a change of function. The occupation of such areas by human activities will greatly weaken the function of the rural landscape and can even cause the collapse of ecosystems (Chen et al., 2014). The eastern regions with the rapid development of secondary and tertiary industries formed EDF-ERF tradeoffs, and their number increased year by year. These relationships were mainly due to the decline of vegetation coverage and damage to the water environment caused by the fragility of the ecological environment. Although it was affected by the development of township enterprises and the improvement of the urbanization rate, the ERF of the western region was reduced to some extent. However, depending on the superior natural background conditions, there were still many synergistic regions (such as the lake-ring area).
SCF-EMF. The tradeoff and synergy regions were distributed around Qingpu District, and their number was increasing. Under the dual influences of population growth and agricultural landscape resource consumption, the trade-off regions were concentrated in the center of town. The main reason for this distribution was that the development of the social economy led to the huge consumption of agricultural landscape resources around the towns. However, the regions with less interference formed a synergy. SCF coordination originated in different areas from either the positive externality of economic development (east side of Qingpu), the agglomeration of industrial development (center side of Qingpu) or the comfortable living environment (around the Dianshan Lake). However, the SCF tradeoffs stemmed from the regional “population-land-industry” conflicts resulting in spatial development imbalances. Meanwhile, EMF synergy originated from the environmental capacity of the landscape ecological land. Good ecological resource endowment and a water network for the absorption and dilution of pollutants were the core attributes for the formation of synergy. However, the EMF weight is due to the poor self-purification of the environment caused by sparse vegetation cover and industrial pollutant emissions, and adding the pollutants produced in densely populated areas reinforces the tradeoff.
LAF-ERF and LAF-EMF. Both of these had high similarity in their spatial distributions. Among them, the tradeoff regions were concentrated in the east and the synergistic regions were distributed in the west. The number of tradeoff regions increased at first and then decreased. However, the synergy regions decreased initially and then increased, because the three functions (LAF, ERF and EMF) have certain similarities and causality in the genetic mechanisms. The west side of Qingpu District, with a high LAF value, had the regional conditions of low population density, relatively developed agricultural industry and less industrial industry, which to some extent enhanced the environmental maintenance function of the region. At the same time, this region also maintains the characteristics of a large area of regional agricultural landscape, patch agglomeration and various types of agricultural landscape. Therefore, the ecological regulation function was enhanced to some extent. On the contrary, the eastern Qingpu was characterized by tradeoff.
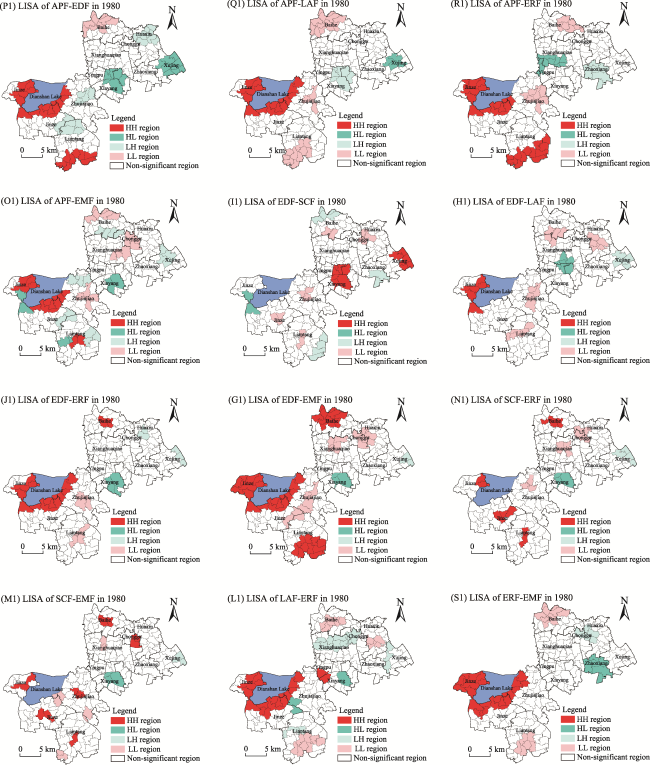
Fig. 4 Local indicators of spatial associations among rural landscape functions in Qingpu District in 1980
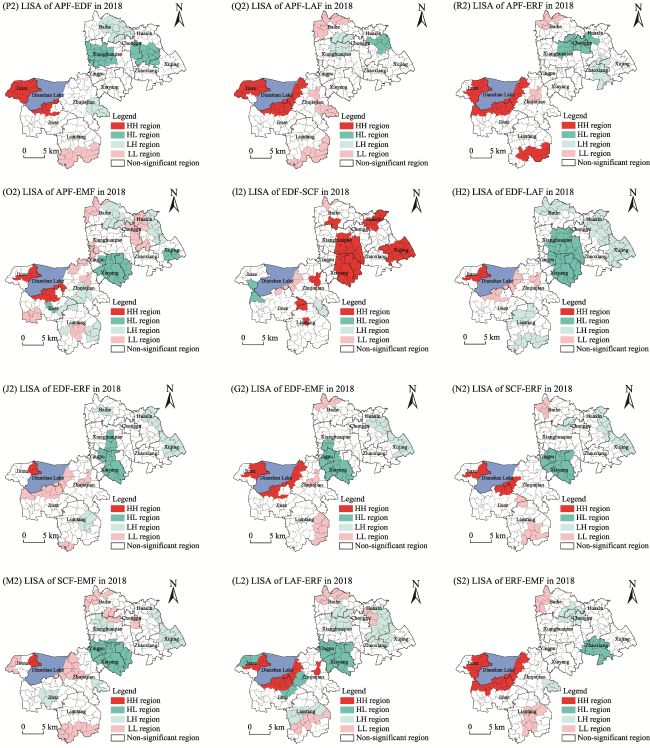
Fig. 5 Local indicators of spatial association among rural landscape functions in Qingpu District in 2018
ERF-EMF. Synergy regions were distributed around the lake area, Liantang and Baihe, while tradeoff regions were concentrated in Zhaoxiang and Zhonggu. The synergies originated from the absorption of environmental pollution by the perfect landscape ecological resource allocation. However, the tradeoffs originated from the increase of industrial pollution and the decline of environmental capacity in industrial parks.

4 Discussion

4.1 Policy implications

(1) The tradeoffs between six rural landscape functions in Qingpu District during the study period were more numerous than the synergies, validating the viewpoint that land sparing is more appropriate than land sharing in developing countries (Feng et al., 2016). That is, the win-win strategies of increasing the yield and economic benefit of surplus land by allocating part of the land for ecosystem conservation and nature conservation and using efficient and intensive means of utilization were more advantageous than the strategies of achieving biodiversity conservation while agricultural production was accompanied by strategies of adopting lower and smaller land production methods through either comprehensive utilization of the land or not dividing the no-tillage zones (Green et al., 2005). This advantage was mainly reflected in the current land ownership, because of the more efficient implementation of the government's land sparing strategies and lower cost of supervision. At the same time, this advantage used restrictive development policies to deal with the interplay between the functions of the rural landscape, which mostly depend on land, to explore the compound functions of landscape, and to improve the supply of regional ecosystem services. The results also showed that the planning scheme of “zonal development” in Qingpu District (ecological conservation region in the west, central urban region in the middle and economic development region in the east) was a reasonable layout.
(2) The observed tradeoffs among EDF-ERF and EDF-EMF proved that the economic development function and ecological functions of the rural landscape were contradictory. The rapid economic development had been realized at the expense of ecological environment during the research period in Qingpu District. Therefore, strengthening the supplemental and corrective functions of the government regulation mechanism, and realizing the maximal and long-term benefits of the rural landscape functions, should be the focus of the natural, social and economic sustainable development of Qingpu District.
(3) The synergistic relationships between LAF-ERF and LAF-EMF showed that biodiversity and agglomeration played an important role in the optimization of the ecological environment. Therefore, it is necessary to promote the conservation measures of species diversity, assist the development models based on their own characteristics, form a variety of agricultural landscape features, planting characteristics and cultural styles, meet the diverse regional characteristics of different life value orientations, and realize an environmental and aesthetic symbiosis.
(4) The APF-ERF and APF-EMF had spatial and temporal differences, that is, these two pairs of functions showed synergistic relationships in the time series and tradeoffs in the spatial distribution. The results underscored two different aspects. On the one hand, since the agricultural production function of Qingpu District was not the primary functional form, alternative research methods cannot accurately describe the relationship between the functions. On the other hand, it verified that the time series correlation analysis of the agricultural landscape functional relationship was limited and cannot characterize the systematisms of functional tradeoffs and synergies.
(5) The differentiation was apparent between SCF and ERF, and SCF and EMF in the spatial and temporal dimensions. That is, these two groups of functions showed compatibility in time and tradeoffs in space. These results showed that human interference had negative effects on rural landscape functions, but due to the differences of endowments in regional space, the negative effects did not necessarily produce tradeoffs between the functions. The key lied in how to limit the impact of human interference on the natural bearing threshold. Therefore, future measures should strengthen the delineation and protection of ecological nodes and corridors, construct a systematic and complete ecological security pattern, control the intensity and breadth of human activities, and ensure that the interference is controlled within the threshold of ecological stability, the minimum safety standard range and the carrying capacity of resources and the environment.

4.2 Analysis of possible influencing factors

Some research evidence has demonstrated that the changes of land use types and their areas were the most important factors affecting the changes of rural landscape multifunctionality, and the growth of the population and the economy was the core driving force (Asadolahi et al., 2018; Wu et al., 2019; Zhang et al., 2020). The results of the change in relationships caused by the selected index were objectively verified in this study. Compared to the year 1980, built-up area and transport land area increased by 12619.09 ha and 2210.82 ha, respectively. However, the areas of arable land, forest and water bodies decreased by 7357.87 ha, 1500.45 ha and 2263.97 ha, respectively. Meanwhile, in the past 38 years, the total population of Qingpu District has increased by 832.50 thousand. The urbanization rate of Qingpu District increased to 79.67% by 2018. Because of the disturbance from human activities, the structure of the rural landscape system in Qingpu District has changed greatly, which would lead to the corresponding transformation of its functions to a great extent. For example, arable land had high provisioning service capacities but weak regulating, supporting and cultural service capacities. Forest and grassland had the highest regulating and supporting service capacities but weak provisioning service capacities. While activities such as deforestation, reclamation of lakes and large-scale urban expansion may result in increases in the agricultural and built-up areas and an improvement in the grain and material supply services over a short period of time, the consequential decreases in the forest area and the amount of water resources are detrimental to the long-term supporting and regulating functions of the rural landscape.

4.3 Uncertainty analysis

Compared with previous studies, the relationships between APF and ERF in this study had some differences. For example, taking Baiyangdian River Basin as a case study, Bai et al. (2017) verified that the relationship between APF and ERF was synergy. The research results of Egoh et al. (2009) in South Africa showed a significant negative correlation (tradeoff) between these two functions. Qian et al. (2018) found these two functions had almost no correlation (the correlation coefficient was only 0.019) in a case study of Bailongjiang Watershed, Gansu. However, the results of this study demonstrated that there were obviously regional differences between the synergy and tradeoff regions, and the number of tradeoff regions increased initially and then decreased. The possible reasons may be that there are significant differences in the natural and social environments of different regions, which results in obvious regional differences. Even so, except for the regional factors, the following uncertainties existed in the spatial expression of geographical ecological processes at the regional scale.
(1) Static temporal nodes selection. Based on the research data, the temporal nodes in this study were selected as 1980, 1995, 2007 and 2018. However, since the differences of function values were highly dependent on temporal nodes, this factor may cause some uncertainties in the analysis of the multi-functional relationships of the rural landscape. (2) Rural landscape function composition. Six functions were selected to represent the rural landscape function, but the rural landscape function is a functional cluster composed of many functions, such as social support function, cultural heritage function and many others, which were not included in the study. (3) Index combination represented the integrity of the rural landscape functions. As it is affected by direct representation of the functions, the index representation has advantages. However, it is difficult to use relatively few indicators to accurately and comprehensively characterize the functions, and the selection of indicators and the accuracy of characterization form the basis of the accuracy of the results. (4) The difficulty of quantifying subjective needs. The hierarchy and diversity of human needs make them difficult to characterize in terms of demand. Based on the factors of landscape patch integrity, willingness to pay and attraction, the method of describing the landscape aesthetic function from the demand and demand level ignored the endowment characteristics of the rural landscape aesthetic function, that is, landscape peculiarity, landscape color and other attributes.

5 Conclusions

(1) In the process of rapid urbanization, the rural landscape function had changed in the urban suburbs under the combined factors of natural resource endowment, and social and economic conditions, which led to the situation where the APF cannot replace the EDF. The APF was no longer the first functional form in Qingpu District, and the EDF had become the leading function in this region. The separation of APF and EDF was applicable for analyzing the tradeoffs and synergies of the rural landscape in the urban suburbs.
(2) The spatial and temporal relationship patterns of rural landscape functions were different. According to the Spearman rank correlation analysis of the multi-functional value of the rural landscape in the time dimension, the results masked the differences of resource and environment carrying capacity caused by the differences of regional landscape resource endowment in the spatial dimension. Thus, it cannot fully reflect the functional tradeoffs and synergies.
(3) Rural landscape multi-functional tradeoffs and synergies were significant in Qingpu District from 1980 to 2018. The PF-LF were mainly synergy, and spaced along the central axis. The PF-EF were dominated by tradeoff, and spatially spreading from the central to eastern areas. Yet the LF-EF were more balanced, and the tradeoff regions diffused from the middle to the east, while the synergy regions diffused from the west to the north and south. The contradictions among APF-EDF, EDF-ERF and EDF-EMF were unavoidable in this region, and the rapid economic development of this region had been realized at the expense of the ecological environment. The tradeoffs between EDF and LAF were significant, and the relationship between these two functions was tradeoffs in the east, but synergies in the west, while the number of tradeoff regions was increasing. The tradeoffs among LAF-ERF and LAF-EMF were concentrated in the eastern portion of Qingpu District, yet the synergies were distributed in the western part. Meanwhile the number of tradeoff regions increased initially and then decreased, in contrast to the synergistic regions which decreased at first and then increased.
1
Anselin L . 1995. Local indicators of spatial association—LISA. Geographical Analysis, 27(2):93-115.

2
Asadolahi Z, Salmanmahiny A, Sakieh Y , et al. 2018. Dynamic trade-off analysis of multiple ecosystem services under land use change scenarios: Towards putting ecosystem services into planning in Iran. Ecological Complexity, 36:250-260.

3
Azam K M, Gholam A H, Abdol R S , et al. 2019. Exploring management objectives and ecosystem service trade-offs in a semi-arid rangeland basin in southeast Iran. Ecological Indicators, 98:784-803.

4
Bai Y, Wang M, Li H , et al. 2017. Ecosystem service supply and demand: Theory and management application. Acta Ecologica Sinica, 37(17):5846-5852. (in Chinese)

5
Chen G, Meng X M, Tan L , et al. 2014. Comparison and combination of different models for optimal landslide susceptibility zonation. Quarterly Journal of Engineering Geology and Hydrogeology, 47(4):283-306.

DOI

6
Deng X Z, Li Z H, Gibson J . 2016. A review on trade-off analysis of ecosystem services for sustainable land-use management. Journal of Geographical Sciences, 26(7):953-968.

DOI

7
Dong P Y, Zhao H F . 2019. Study on trade-off and synergy relationship of cultivated land multifunction: A case of Qingpu District, Shanghai. Resources and Environment in the Yangtze Basin, 28(2):368-375. (in Chinese)

8
Egoh B, Reyers B, Rouget M , et al. 2009. Spatial congruence between biodiversity and ecosystem services in South Africa. Biological Conservation, 142(3):553-562.

9
Fan J . 2015. Draft of major function oriented zoning of China. Acta Geographica Sinica, 70(2):186-201. (in Chinese)

10
Feng Z, Xu X G, Zhou J , et al. 2016. Land sparing versus sharing framework from ecosystem service perspective. Progress in Geography, 35(9):1100-1108. (in Chinese)

11
Firbank L, Bradbury R B, McCracken D I , et al. 2013. Delivering multiple ecosystem services from enclosed farmland in the UK. Agriculture Ecosystems and Environment, 166:65-75.

12
Goldstein J H, Caldarone G, Duarte T K , et al. 2012. Integrating ecosystem service tradeoffs into land-use decisions. Proceedings of the National Academy of Science of the USA, 109(19):7565-7570.

13
Green R E, Cornell S J, Scharlemann J P W , et al. 2005. Farming and the fate of wild nature. Science, 307(5709):550-555.

DOI PMID

14
Han H Q, Liu Y, Gao H J , et al. 2020. Tradeoffs and synergies between ecosystem services: A comparison of the Karst and non-Karst area. Journal of Mountain Science, 17(5):1221-1234.

DOI

15
Howe C, Suich H, Vira B , et al. 2014. Creating win-wins from trade-offs? Ecosystem services for human well-being: A meta-analysis of ecosystem service trade-offs and synergy in the real world. Global Environmental Change, 28:263-275.

16
Jia X Q, Fu B J, Feng X M , et al. 2014. The tradeoff and synergy between ecosystem services in the Grain-for-Green areas in Northern Shaanxi, China. Ecological Indicators, 43:103-113.

17
Langner A, Irauschek F, Perez S , et al. 2017. Value-based ecosystem service trade-offs in multi-objective management in European mountain forests. Ecosystem Services, 26:245-257.

18
Li Z H, Deng X Z, Jin G , et al. 2020. Tradeoffs between agricultural production and ecosystem services: A case study in Zhangye, Northwest China. Science of the Total Environment, 707:136032. DOI: 10.1016/j.scitotenv.2019.136032.

19
Liu Y, Liu Y S, Guo L Y . 2011. Connotations of rural regional multifunction and its policy implications in China. Human Geography, 26(6):103-106, 132. (in Chinese)

20
Mitchell M G E, Bennett E M, Gonzalez A . 2015. Strong and nonlinear effects of fragmentation on ecosystem service provision at multiple scales. Environmental Research Letters, 10(9):094014. DOI: 10.1088/1748-9326/10/9/094014.

21
NBSC(National Bureau of Statistics of China). 1980-2018. China Statistical Yearbook. Beijing, China: Chinese Statistics Press.

22
O’Farrell P J, Reyers B, Maitre D C , et al. 2010. Multi-functional landscapes in semi-arid environments: Implications for biodiversity and ecosystem services. Landscape Ecology, 25(8):1231-1246.

23
Palmer C, Silber T . 2012. Trade-offs between carbon sequestration and rural incomes in the N’hambita Community Carbon Project, Mozambique. Land Use Policy, 29(1):83-93.

24
Pan J H, Li Z . 2017. Analysis on trade-offs and synergies of ecosystem services in arid inland river basin. Transactions of the Chinese Society of Agricultural Engineering, 33(17):280-289. (in Chinese)

25
Peng J, Liu Z C, Liu Y X , et al. 2015a. Multifunctionality assessment of urban agriculture in Beijing City, China. Science of the Total Environment, 537:343-351.

26
Peng J, Lv H L, Liu Y X , et al. 2015b. International research progress and perspectives on multifunctional landscape. Advances in Earth Science, 30(4):465-476. (in Chinese)

27
Qian C Y, Gong J, Zhang J X , et al. 2018. Change and tradeoffs-synergies analysis on watershed ecosystem services: A case study of Bailongjiang Watershed, Gansu. Acta Geographica Sinica, 73(5):868-879. (in Chinese)

28
Qian F K, Chi Y R, Lal R . 2020. Spatiotemporal characteristics analysis of multifunctional cultivated land: A case study in Shenyang, Northeast China. Land Degradation & Development, 31(14):1812-1822.

29
Qiu J X, Turner M G . 2013. Spatial interactions among ecosystem services in an urbanizing agricultural watershed. Proceedings of the National Academy of Sciences of the USA, 110(29):12149-12154.

30
Reed M S, Hubacek K, Bonn A , et al. 2013. Anticipating and managing future trade-offs and complementarities between ecosystem services. Ecology and Society, 18(1):5-16.

31
Ren G P, Liu L M, Sun J , et al. 2018. Multifunction orientation of rural landscape in metropolitan suburbs based on GRA and TOPSIS models. Geographical Research, 37(2):263-280. (in Chinese)

32
Schmalz B, Kruse M, Kiesel J , et al. 2016. Water-related ecosystem services in Western Siberian lowland basins—Analysing and mapping spatial and seasonal effects on regulating services based on ecohydrological modelling results. Ecological Indicators, 71:55-65.

33
Wang C, Peng Q, Tang N , et al. 2018. Spatio-temporal evolution and the synergy and trade-off relationship of cultivated land multi-function in 2005-2015: A case of Shapingba District, Chongqing City. Scientia Geographica Sinica, 38(4):590-599. (in Chinese)

34
Willemen L, Hein L, van Mensvoort M E F, et al. 2010. Space for people, plants, and livestock? Quantifying interactions among multiple landscape functions in a Dutch rural region. Ecological Indicators, 10(1):62-73.

35
Wu Y, Tao Y, Yang G S , et al. 2019. Impact of land use change on multiple ecosystem services in the rapidly urbanizing Kunshan City of China: Past trajectories and future projections. Land Use Policy, 85:419-427.

36
Yang G F, Ge Y, Xue H , et al. 2015. Using ecosystem service bundles to detect trade-offs and synergies across urban-rural complexes. Landscape and Urban Planning, 136:110-121.

37
Zhang Y N, Long H L, Tu S S , et al. 2019. Spatial identification of land use functions and their tradeoffs/synergies in China: Implications for sustainable land management. Ecological Indicators, 107:105550. DOI: 10.1016/j.ecolind.2019.105550.

38
Zhang Z Y, Liu Y F, Wang Y H , et al. 2020. What factors affect the synergy and tradeoff between ecosystem services, and how, from a geospatial perspective? Journal of Cleaner Production, 257:120454. DOI: 10.1016/j.jclepro.2020.120454.

39
Zhu Q Y, Hu W Y, Zhao Z S . 2018. Dynamic analysis on spatial-temporal pattern of trade-offs and synergies of multifunctional cultivated land: Evidence from Hubei Province. Economic Geography, 38(7):143-153. (in Chinese)

Outlines

/