
Journal of Resources and Ecology >
Optimal Land Use Structure for Sustainable Agricultural Development—A Case Study in Changsha County, South Central China
Received date: 2020-10-15
Accepted date: 2020-12-30
Online published: 2021-05-30
Supported by
Foundation: The National Natural Science Foundation of China(41801216)
The Fundamental Research Funds for the Central Universities of China (2018B20914).()
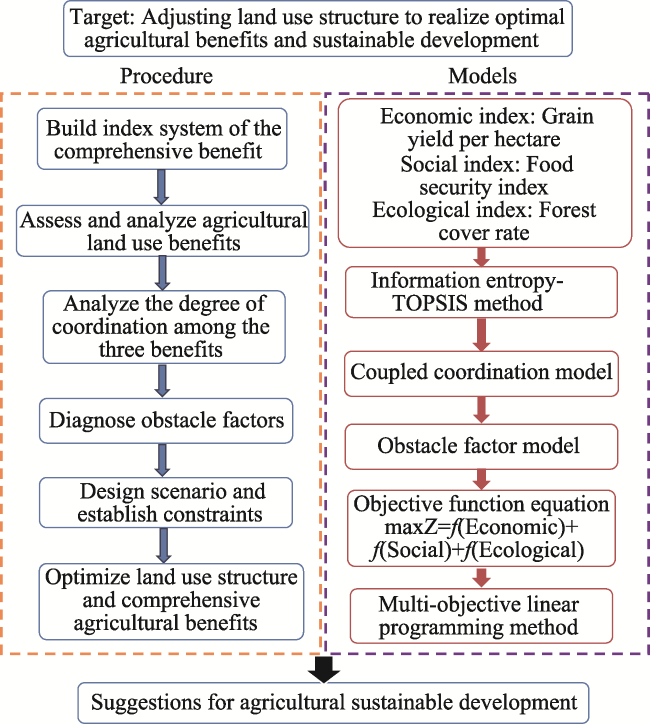
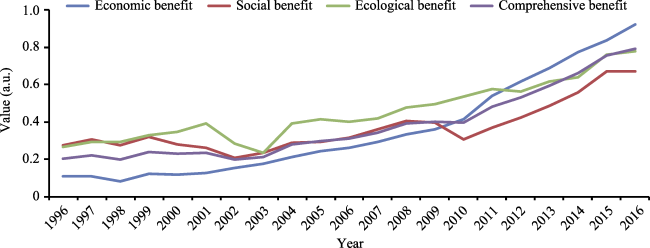
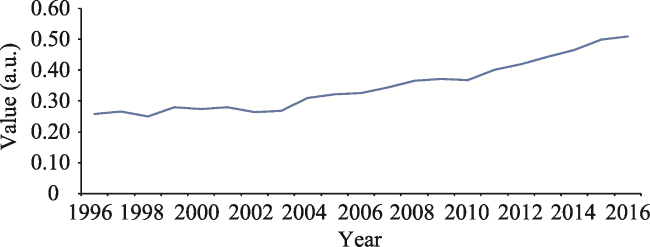
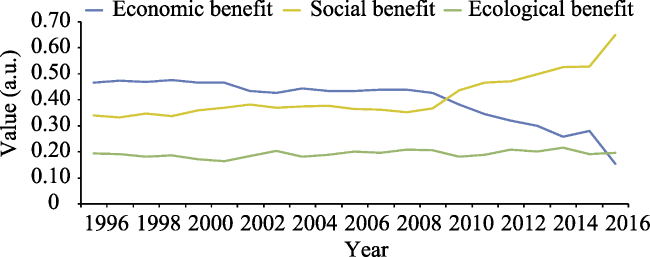
Environmental and social problems caused by overfertilization, excessive pesticides, and encroachment on farmland are increasingly serious in agricultural settings, especially in suburban agricultural areas and highly intensive agricultural areas. Hence, modern agriculture not only pursues economic benefits, but it also pays more attention to ecological functions and social stability. This paper proposes a set of methods which are designed to realize optimal agricultural benefits and sustainable development by scientifically adjusting the land use structure. Taking Changsha County in South Central China as a case study, this paper first built an index system and adopted the information entropy-TOPSIS method to assess the economic, social, and ecological benefits of agricultural land use. Next, a coupled coordination model and an obstacle model were chosen to diagnose those factors that remained as obstacles to achieving the sustainable and coordinated development of the benefits of agricultural land use. Finally, based on the analysis of the changes in the benefits and obstacles over time, socio-economic and ecological constraints were established, and the multi-objective linear programming method (MOLP) was used to determine the comprehensive benefits and optimal land use structure. The results indicate that: (1) The agricultural benefits were stably increasing from 0.20 in 1996 to 0.79 in 2016. (2) The economic benefit index is no longer the main obstacle, while the social benefit index, which includes components such as the food security index, has become the principal influencing factor. (3) The optimal land use structure and comprehensive benefits were presented by taking into consideration the economic development, environmental protection, and social needs. This study emphasizes economic development, but it also seeks coordinated development with comprehensive benefits. The results of the study could provide scientific recommendations for optimizing the agricultural land use spatial patterns and sustainable land use.
LI Hongqing , LI Wenqi , ZHENG Fei . Optimal Land Use Structure for Sustainable Agricultural Development—A Case Study in Changsha County, South Central China[J]. Journal of Resources and Ecology, 2021 , 12(2) : 203 -213 . DOI: 10.5814/j.issn.1674-764x.2021.02.007
Fig. 1 Flowchart of agricultural land use structure optimization |
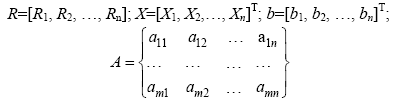
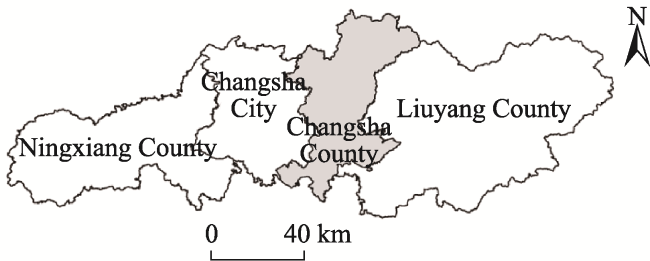
Fig. 2 Location of Changsha County |
Table 1 The index system for the comprehensive benefit of agricultural land use |
| First-grade indices | Second-grade indices | Specific indices | Unit | Weight |
|---|---|---|---|---|
| Economic benefit | Agricultural production value | Gross agricultural output value per hectare C1 | yuan ha-1 | 0.252 |
| Garden production value per hectare C2 | yuan ha-1 | 0.165 | ||
| Forestry production value per hectare C3 | yuan ha-1 | 0.328 | ||
| Husbandry value per hectare C4 | yuan ha-1 | 0.255 | ||
| Grain yield per hectare C5 | kg ha-1 | 0.041 | ||
| Agricultural land use efficiency | Labor productivity C6 | yuan person-1 | 0.228 | |
| Grain yield per labor force C7 | kg person-1 | 0.094 | ||
| Agricultural GDP per capita C8 | yuan person-1 | 0.167 | ||
| Increase in the gross agricultural output value C9 | % | 0.040 | ||
| Technical efficiency C10 | yuan (kWh) -1 | 0.548 | ||
| Agricultural mechanization degree C11 | kWh ha-1 | 0.452 | ||
| Employees per hectare C12 | person ha-1 | 0.315 | ||
| Social benefit | Rural living condition | Rural per capita net income C13 | yuan | 0.404 |
| Rural Engel coefficient C14 | % | 0.171 | ||
| Rural medical level C15 | % | 0.425 | ||
| Rural education level C16 | % | 0.396 | ||
| Rural population density C17 | person ha-1 | 0.224 | ||
| Rural labor transfer index C18 | % | 0.242 | ||
| Food security | Food security index C19 | % | 0.257 | |
| Food production per capita C20 | kg person-1 | 0.257 | ||
| Farmland area per capita C21 | ha person-1 | 0.176 | ||
| Ecological benefit | Ecological condition | Forest cover rate C22 | % | 0.144 |
| Cultivated land load C23 | % | 0.101 | ||
| Stable yields area rate C24 | % | 0.145 | ||
| Multiple cropping index C25 | % | 0.130 | ||
| Cultivated land utilization rate C26 | % | 0.389 | ||
| Irrigated area rate C27 | % | 0.092 | ||
| Environmental quality | Energy consumption per 10000 yuan C28 | kWh (104 yuan) -1 | 0.167 | |
| Pesticide use rate C29 | kg ha-1 | 0.175 | ||
| Fertilizer use rate C30 | kg ha-1 | 0.404 | ||
| Agricultural plastic film use rate C31 | kg ha-1 | 0.253 |
Fig. 3 The values of agricultural land use benefits |
Fig. 4 The degree of coordination between the economic, social, and ecological benefits |
Fig. 5 The degree of influence of the obstacles of the economic, social, and ecological benefit. |
Table 2 The top seven factors which act as obstacles to agricultural benefit |
| Year | 1 | 2 | 3 | 4 | 5 | 6 | 7 |
|---|---|---|---|---|---|---|---|
| 2010 | C16 | C3 | C13 | C15 | C19 | C20 | C30 |
| 2011 | C16 | C15 | C30 | C3 | C19 | C20 | C13 |
| 2012 | C16 | C20 | C19 | C15 | C30 | C3 | C13 |
| 2013 | C20 | C19 | C16 | C14 | C30 | C21 | C3 |
| 2014 | C20 | C19 | C17 | C16 | C14 | C21 | C30 |
| 2015 | C20 | C19 | C14 | C12 | C21 | C31 | C30 |
| 2016 | C20 | C19 | C14 | C21 | C12 | C18 | C31 |
Note: See Table 1 for the abbreviations for the factors (e.g., C3 is “forestry production value per hectare”). |
Table 3 Optimal agricultural land-use structure in Changsha County |
| Land type and benefit | Base year (2016) | Target year (2025) | Change rate (%) |
|---|---|---|---|
| Arable land (ha) | 51866 | 53213 | 2.60 |
| Garden land (ha) | 2450 | 2533 | 3.39 |
| Woodland (ha) | 77809 | 89260 | 14.72 |
| Grassland (ha) | 528 | 528 | 0 |
| Economic benefit (×106 yuan) | 5559 | 7235 | 30.15 |
| Social benefit (×106 yuan) | 1007 | 1222 | 21.38 |
| Ecological benefit (×106 yuan) | 3417 | 4476 | 30.99 |
| Overall benefit (×106 yuan) | 9983 | 12934 | 29.56 |
| 1 |
|
| 2 |
|
| 3 |
|
| 4 |
|
| 5 |
|
| 6 |
|
| 7 |
|
| 8 |
|
| 9 |
|
| 10 |
|
| 11 |
|
| 12 |
|
| 13 |
|
| 14 |
|
| 15 |
|
| 16 |
|
| 17 |
|
| 18 |
|
| 19 |
|
| 20 |
|
| 21 |
|
| 22 |
|
| 23 |
|
| 24 |
|
| 25 |
|
| 26 |
|
| 27 |
|
| 28 |
|
| 29 |
|
| 30 |
|
| 31 |
|
| 32 |
|
/
| 〈 |
|
〉 |